0715
Water exchange time between gray matter compartments in vivo1Center for Biomedical Imaging, Ecole Polytechnique Fédérale de Lausanne, Lausanne, Switzerland, 2Dept. of Radiology, New York University School of Medicine, New York, NY, United States
Synopsis
In the absence of a myelin sheath, exchange generally is non-negligible over the typical diffusion times of MRI experiments (10 – 100 ms) and should be accounted for in gray matter modeling. Here we use time-dependent kurtosis and the Kärger model (KM) of two slowly exchanging compartments to evaluate water exchange time between intra-neurite and extra-cellular compartments in rat GM in vivo. We report exchange times on the order of 10 – 30 ms. Future work will focus on exploring a broader range of diffusion times to test the asymptotic decay of kurtosis toward zero.
Introduction
If anything the many years of white matter modeling taught us, it is that elucidating and validating model assumptions should occur before bringing model fitting into the clinic. For gray matter (GM), the very basic relevant “compartments” are not established yet: Should we account for soma[1]? Is there a “stick” compartment[2, 3]? How fast is the exchange? Here we attempt to make first steps into this by quantifying water exchange.In the absence of a myelin sheath, exchange generally is non-negligible over the typical diffusion times of MRI experiments (10 – 100 ms). The estimation of water exchange time between intra-neurite/axon and extra-cellular spaces has so far yielded very diverse results, from 60 ms in freshly excised bovine optic nerve[4] to over 500 ms in major human white matter tracts using FEXI[5] and 100 – 150 ms in astrocyte and neuron cultures, respectively[6].
Here we use time-dependent kurtosis and the Kärger model (KM) of two slowly exchanging compartments[7] to evaluate water exchange time in rat GM in vivo. One substantial advantage of rat brain vs. human is the large GM volume which removes confounding effects of partial volume with white matter or CSF.
Methods
All experiments were approved by the local Service for Veterinary Affairs. Three Wistar rats (250 - 300g) were scanned on a 14T Bruker system using a home-built surface quadrature transceiver. Diffusion MRI data were acquired using a PGSE EPI sequence (TE/TR = 50/2500 ms; matrix: 128x96; FOV=25.6x19.2 mm2; 16 0.5-mm thick coronal slices; Partial Fourier = 0.55; b = 0 (4 rep); 7 b-shells, 24 dirs each: b = 1:1.5:10 ms/μm2) at four diffusion times Δ = 12/20/30/40 ms, keeping δ = 4.5 ms constant.Images were denoised and corrected for Rician bias, Gibbs ringing and motion[8]. Diffusion and kurtosis tensors were estimated from b=0, 1 and 2.5 shells using a weighted linear least-squares algorithm, from which mean diffusivity and kurtosis were derived. Powder-average signal was also computed for each shell.
Regions of interest (ROI) covering the corpus callosum (CC), hippocampus (HPC) and cortex (CTX) were manually drawn.
KM assumes time-independent diffusivity $$$D_{KM} = f·Di + (1-f)De$$$ in which case the only source of kurtosis is the inter-compartment heterogeneity which decays to zero as 1/t at long t[7, 9]:
$$K_{KM}(t)=K_{0}\frac{2t_{ex}}{t}\left[1-\frac{t_{ex}}{t}\left(1-\exp(-t/t_{ex})\right)\right]\quad (1)$$
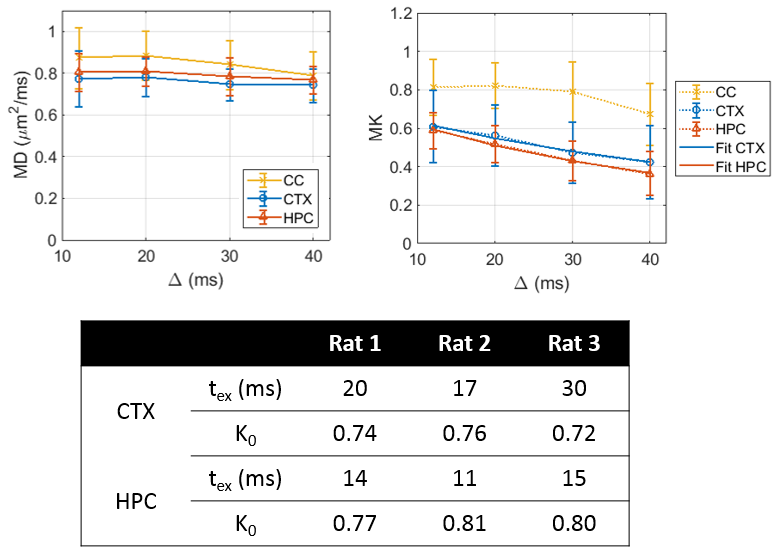
where tex is the exchange time. Mean kurtosis MK(t) was fit to Equation (1) to estimate K0 and tex, both on the average ROI signal and individually in each voxel.
The isotropic average of the full KM signal $$$S_\mathrm{anisoKM}$$$ for two anisotropic compartments[10] was also fit to the powder-averaged ROI signal over the whole b-value range (0 – 10 ms/μm2):
$$\overline{S} = \int\!{d{\bf\hat{q}}\over4\pi}\,S_\mathrm{anisoKM}({\bf q},t;\;t_{ex},f,D_i,D_e)\quad (2)$$
where Di was fixed to 2.4 μm2/ms and the extra-neurite compartment was modeled as Gaussian isotropic with De = 0.8 μm2/ms, leaving tex and f to be estimated.
Results
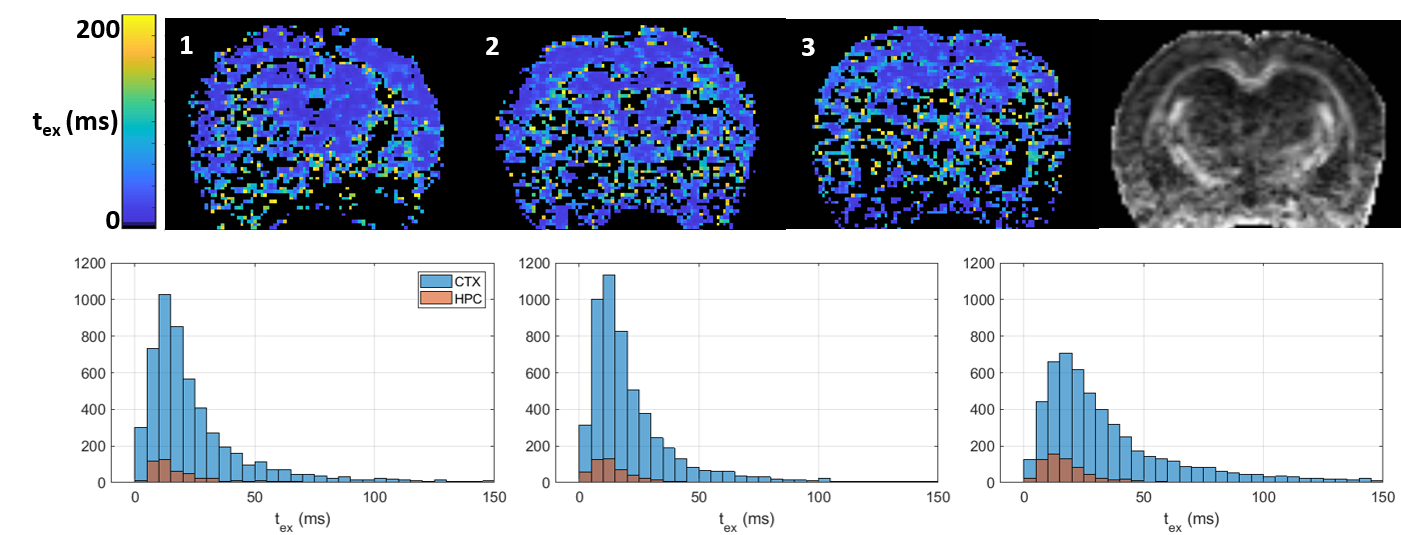
Over the range t = 12 – 40 ms explored here, diffusivities displayed little to no time-dependence in GM (Figure 1), consistent with previous literature[11-13], which supported the applicability of Eq. (1) to estimate the exchange time from MK(t).Parametric maps of tex derived from Equation (1) were homogeneous across GM regions and consistent between rats (Figure 2). Overall, exchange times averaged around 15 – 30 ms in the cortex and around 10 – 15 ms in the hippocampus.
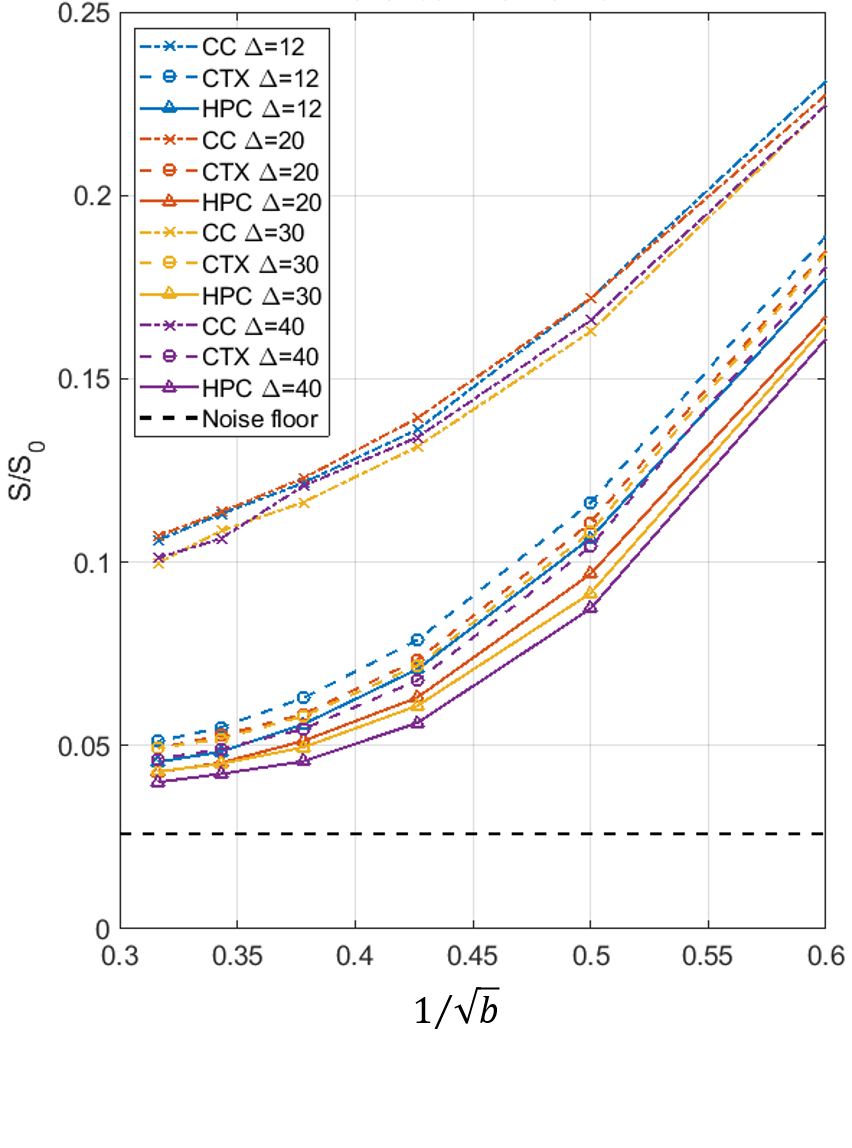
In CC, asymptotic signal decay followed the expected power law $$$b^{-1/2}$$$ characteristic of a stick compartment[2, 3], while in GM a deviation from this power law, attributable to exchange[10], was evident (Figure 3).
Estimates of exchange time and compartment fractions from fitting the two-compartment anisotropic Kärger model to powder-average data for each diffusion time were overall consistent with results from fitting K(t) in the cortex (Figure 4). Estimates were less reliable in the hippocampus (data not shown).
Discussion and Conclusions
Time-dependent kurtosis from the KM yielded rather short exchange times, similar to those found on human Connectome scanner[10], suggesting exchange cannot be neglected in gray matter modeling. The validity of Equation (1) hinges on reaching the Gaussian diffusion limit in all compartments if exchange is switched off. The near-absence of diffusivity t-dependence supports this assumption.Fitting the full KM was more prone to noise and estimates were unphysical for certain datasets. Given the limited number of data points (i.e. b-shells) available, diffusivities also had to be fixed. More data points at high b-values will be acquired in the forthcoming months.
The low-b part of the acquisition, yielding K(t), is advantageous because it does not require high b-values or special sequences and data can be acquired on any clinical scanner. Future work will focus also on exploring a broader range of diffusion times to test the asymptotic decay of kurtosis toward zero, and estimating the competing role of intra-compartment kurtosis (structural disorder)[14].
Acknowledgements
The authors thank Analina da Silva and Stefan Mitrea for assistance with animal setup and monitoring. This work was supported by Centre d'Imagerie Biomédicale (CIBM) of the EPFL, Unil, CHUV, UniGe and HUG.References
[1] M. Palombo, A. Ianus, D. Nunes, M. Guerreri, D.C. Alexander, N. Shemesh, H. Zhang, SANDI: a compartment-based model for non-invasive apparent soma and neurite imaging by diffusion MRI, ArXiv e-prints, (2019) arXiv:1907.02832 [physics.med-ph].
[2] J. Veraart, E. Fieremans, D.S. Novikov, On the scaling behavior of water diffusion in human brain white matter, NeuroImage, 185 (2019) 379-387.
[3] E.T. McKinnon, J.A. Helpern, J.H. Jensen, Modeling white matter microstructure with fiber ball imaging, NeuroImage, 176 (2018) 11-21.
[4] G.J. Stanisz, A. Szafer, G.A. Wright, R.M. Henkelman, An analytical model of restricted diffusion in bovine optic nerve, Magnetic resonance in medicine : official journal of the Society of Magnetic Resonance in Medicine / Society of Magnetic Resonance in Medicine, 37 (1997) 103-111.
[5] B. Lampinen, F. Szczepankiewicz, D. van Westen, E. Englund, P. C Sundgren, J. Lätt, F. Ståhlberg, M. Nilsson, Optimal experimental design for filter exchange imaging: Apparent exchange rate measurements in the healthy brain and in intracranial tumors, Magnetic Resonance in Medicine, 77 (2017) 1104-1114.
[6] D.M. Yang, J.E. Huettner, G.L. Bretthorst, J.J. Neil, J.R. Garbow, J.J.H. Ackerman, Intracellular water preexchange lifetime in neurons and astrocytes, Magnetic resonance in medicine : official journal of the Society of Magnetic Resonance in Medicine / Society of Magnetic Resonance in Medicine, 79 (2018) 1616-1627.
[7] E. Fieremans, D.S. Novikov, J.H. Jensen, J.A. Helpern, Monte Carlo study of a two-compartment exchange model of diffusion, NMR in biomedicine, 23 (2010) 711-724.
[8] B. Ades-Aron, J. Veraart, P. Kochunov, S. McGuire, P. Sherman, E. Kellner, D.S. Novikov, E. Fieremans, Evaluation of the accuracy and precision of the diffusion parameter EStImation with Gibbs and NoisE removal pipeline, NeuroImage, 183 (2018) 532-543.
[9] J. Kärger, NMR self-diffusion studies in heterogeneous systems, Advances in Colloid and Interface Science, 23 (1985) 129-148.
[10] J. Veraart, E. Fieremans, U. Rudrapatna, D.K. Jones, D.S. Novikov, Biophysical modeling of the gray matter: does the "stick" model hold?, in: ISMRM, Paris, France, 2018, pp. 1094.
[11] N. Pyatigorskaya, D. Le Bihan, O. Reynaud, L. Ciobanu, Relationship between the diffusion time and the diffusion MRI signal observed at 17.2 Tesla in the healthy rat brain cortex, Magnetic resonance in medicine : official journal of the Society of Magnetic Resonance in Medicine / Society of Magnetic Resonance in Medicine, 72 (2014) 492-500.
[12] M.D. Does, E.C. Parsons, J.C. Gore, Oscillating gradient measurements of water diffusion in normal and globally ischemic rat brain, Magnetic resonance in medicine : official journal of the Society of Magnetic Resonance in Medicine / Society of Magnetic Resonance in Medicine, 49 (2003) 206-215.
[13] S. Portnoy, J.J. Flint, S.J. Blackband, G.J. Stanisz, Oscillating and pulsed gradient diffusion magnetic resonance microscopy over an extended b-value range: Implications for the characterization of tissue microstructure, Magnetic Resonance in Medicine, 69 (2013) 1131-1145.
[14] A. Papaioannou, D.S. Novikov, E. Fieremans, In vivo observation and interpretation of time dependent diffusion in human gray matter, in: ISMRM 25, Honolulu, HI, USA, 2017, pp. 723.
[15] J. Veraart, D.S. Novikov, D. Christiaens, B. Ades-Aron, J. Sijbers, E. Fieremans, Denoising of diffusion MRI using random matrix theory, NeuroImage, 142 (2016) 394-406.Figures