0714
In vivo observation and interpretation of time-dependent diffusion in human brain gray matter1Center for Biomedical Imaging, Department of Radiology, NYU School of Medicine, New York, NY, United States
Synopsis
The purpose of this work is to identify the relevant microstructural features for the human brain gray matter. For that, we estimate the diffusivity and kurtosis time-dependence in 25 gray matter sub-regions of 10 healthy subjects, and compare the effects of the structural disorder and exchange (Karger model). The estimated power-law dynamical exponent θ≈1/2 is consistent with the structural disorder picture in a 1-dimensional micro-geometry of randomly positioned restrictions along neurites. In contrast, Karger model yields exchange time much shorter than values in previous studies, and below our shortest diffusion time.
Purpose
The dependence of the diffusion MRI signal on diffusion time $$$t$$$ is a hallmark of tissue microstructure, and has recently been observed in human gray matter (GM) using either oscillating gradients[1] or pulsed gradients[2]. Here, we provide a more comprehensive study by measuring the time-dependence of the mean diffusivity $$$D(t)$$$ and mean kurtosis $$$K(t)$$$ in 25 different deep and cortical GM regions of 10 healthy subjects, and providing a decision tree to discern between the microstructural features causing the observed time-dependence.Methods
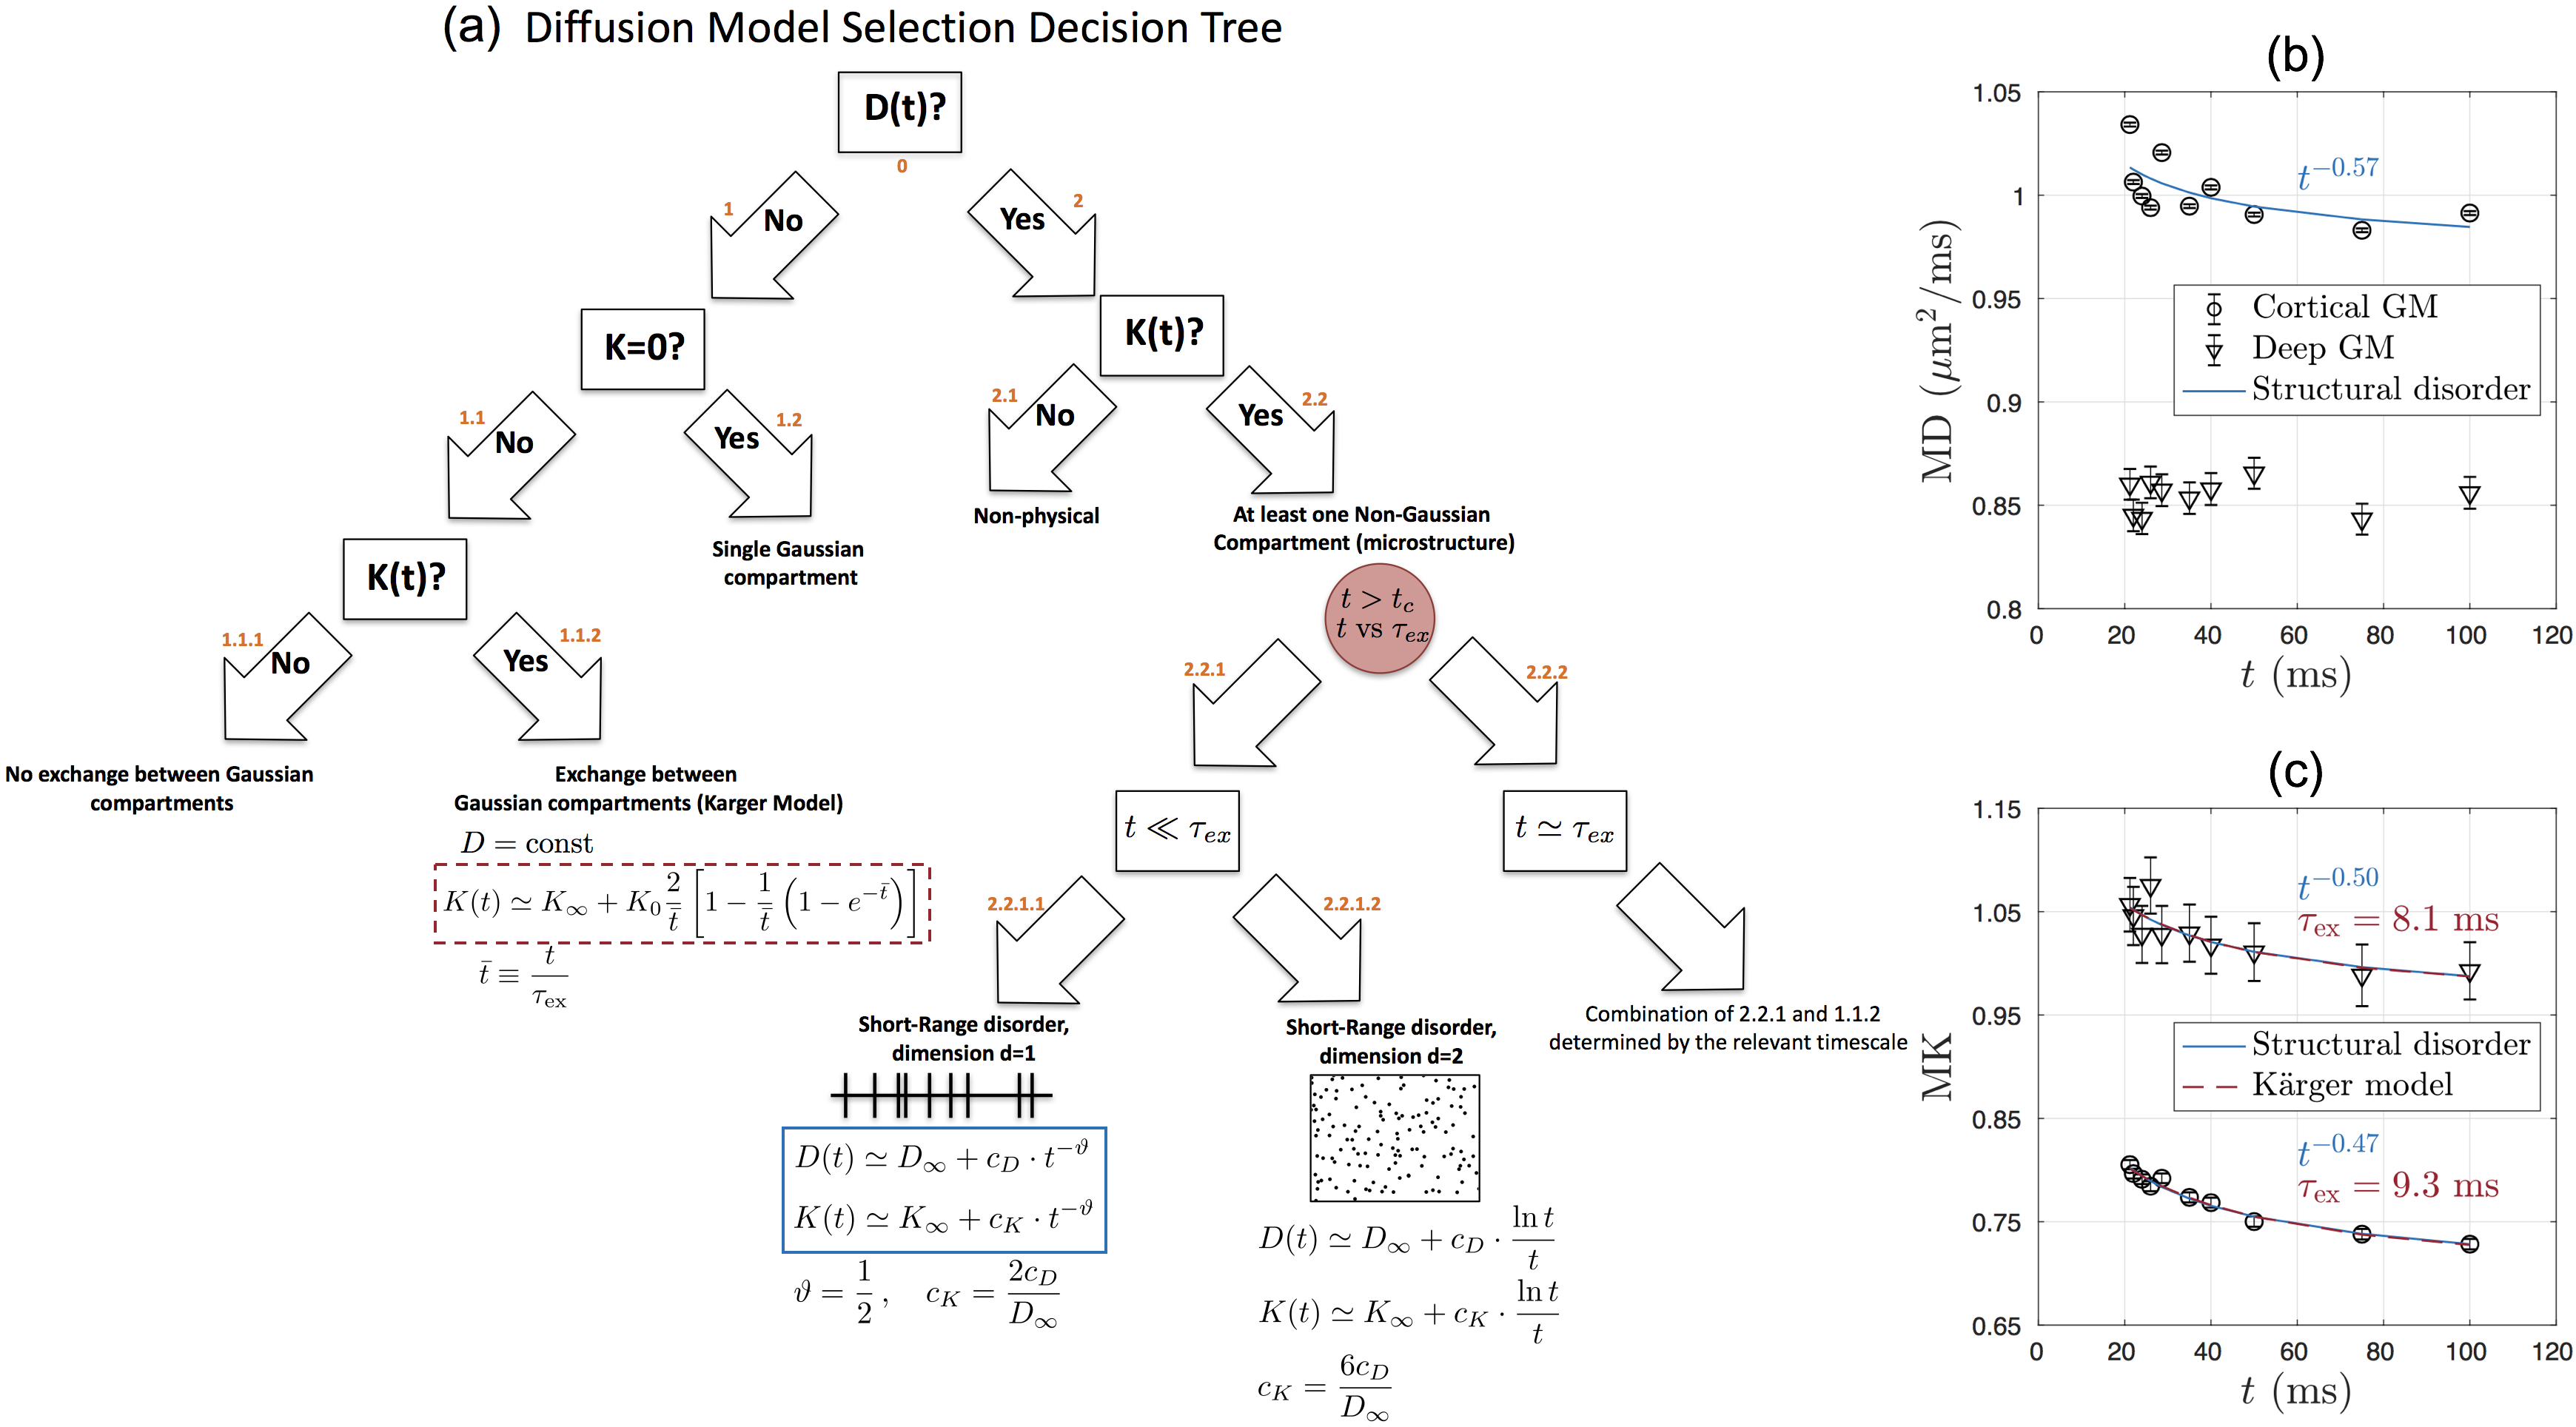
$$$\textit{Theory}$$$Fig. 1a describes the hierarchy of models that describe the connection between $$$D(t)$$$ and $$$K(t)$$$ with the various compartments and microstructure types that are likely to be present in the brain. To explain the observed gray matter $$$D(t)$$$ and $$$K(t)$$$ time-dependence, we focus on nodes 1.1.2 and 2.2.1.1.
On the one hand, time-dependence in both $$$D$$$ and $$$K$$$ could be caused by microstructural inhomogeneity, i.e. $$$\textbf{structural disorder}$$$, leading to the time-dependent part: $$$\delta D(t)\sim t^{-\vartheta}$$$ and $$K(t)\simeq K_\infty+c_K\cdot t^{-\vartheta}\,,\quad\quad(1)$$
with $$$K_\infty$$$ the kurtosis in $$$t\to\infty$$$ limit, $$$c_K$$$ the amplitude of the time-dependence, and $$$\vartheta$$$ signifying the universality class of the tissue micro-geometry[3,4,5]. Previous histological studies show that bead-like structures are randomly positioned along neurites in GM[6,7], which indicates short-range disorder in 1$$$d$$$ with $$$\vartheta$$$=1/2[4]. We test this assumption in GM sub-regions by fitting Eq.(1) to measured $$$K(t)$$$.
On the other hand, a competing cause of the observed $$$K(t)$$$ time-dependence is water exchange[8,9]. A simplified two-pool model considering exchange in-between (dubbed as $$$\textbf{Kärger model(KM)}$$$) yields no time-dependence in $$$D$$$, but does in $$$K$$$ related to the exchange time $$$\tau_{\rm ex}$$$: $$K(t)\simeq K_\infty+K_0\frac{2}{\bar{t}}\left[1-\frac{1}{\bar{t}}\left(1-e^{-\bar{t}}\right)\right]\,,\quad\bar{t}\equiv\frac{t}{\tau_{\rm ex}}\quad\quad(2)$$ with $$$K_0=3\frac{{\rm var}(D_i)}{{\rm mean}(D_i)^2}$$$. We fit Eq.(2) to $$$K(t)$$$ in GM sub-regions, and estimate the exchange time to test KM applicability.
$$$\textit{In vivo MRI}$$$
dMRI was performed on 10 healthy subjects (7 males, 23-30y/o) using a monopolar PGSE sequence provided by the vendor (Siemens WIP 511) on a 3T Siemens Prisma scanner with a 64-channel head coil to acquire a brain slab consisting of 15 slices aligned parallel to the AC-PC line. Diffusion time was varied, $$$t$$$=21.2-100ms, and gradient pulse width $$$\delta$$$ was fixed at 15ms. For each $$$t$$$, we obtained 2 $$$b$$$=0 images (A>>P), one additional $$$b$$$=0 image with blipped phase-encoding direction, and $$$b$$$=[100,400,1000,1500]s/mm$$$^2$$$-images along 64 directions in total, with an isotropic resolution (2mm)$$$^3$$$ and FOV of 222$$$\times$$$222mm$$$^2$$$. All scans were performed with the same TR/TE=5000/150ms. In addition, MPRAGE was acquired for segmentation. Total protocol took $$$\sim$$$60min per subject.
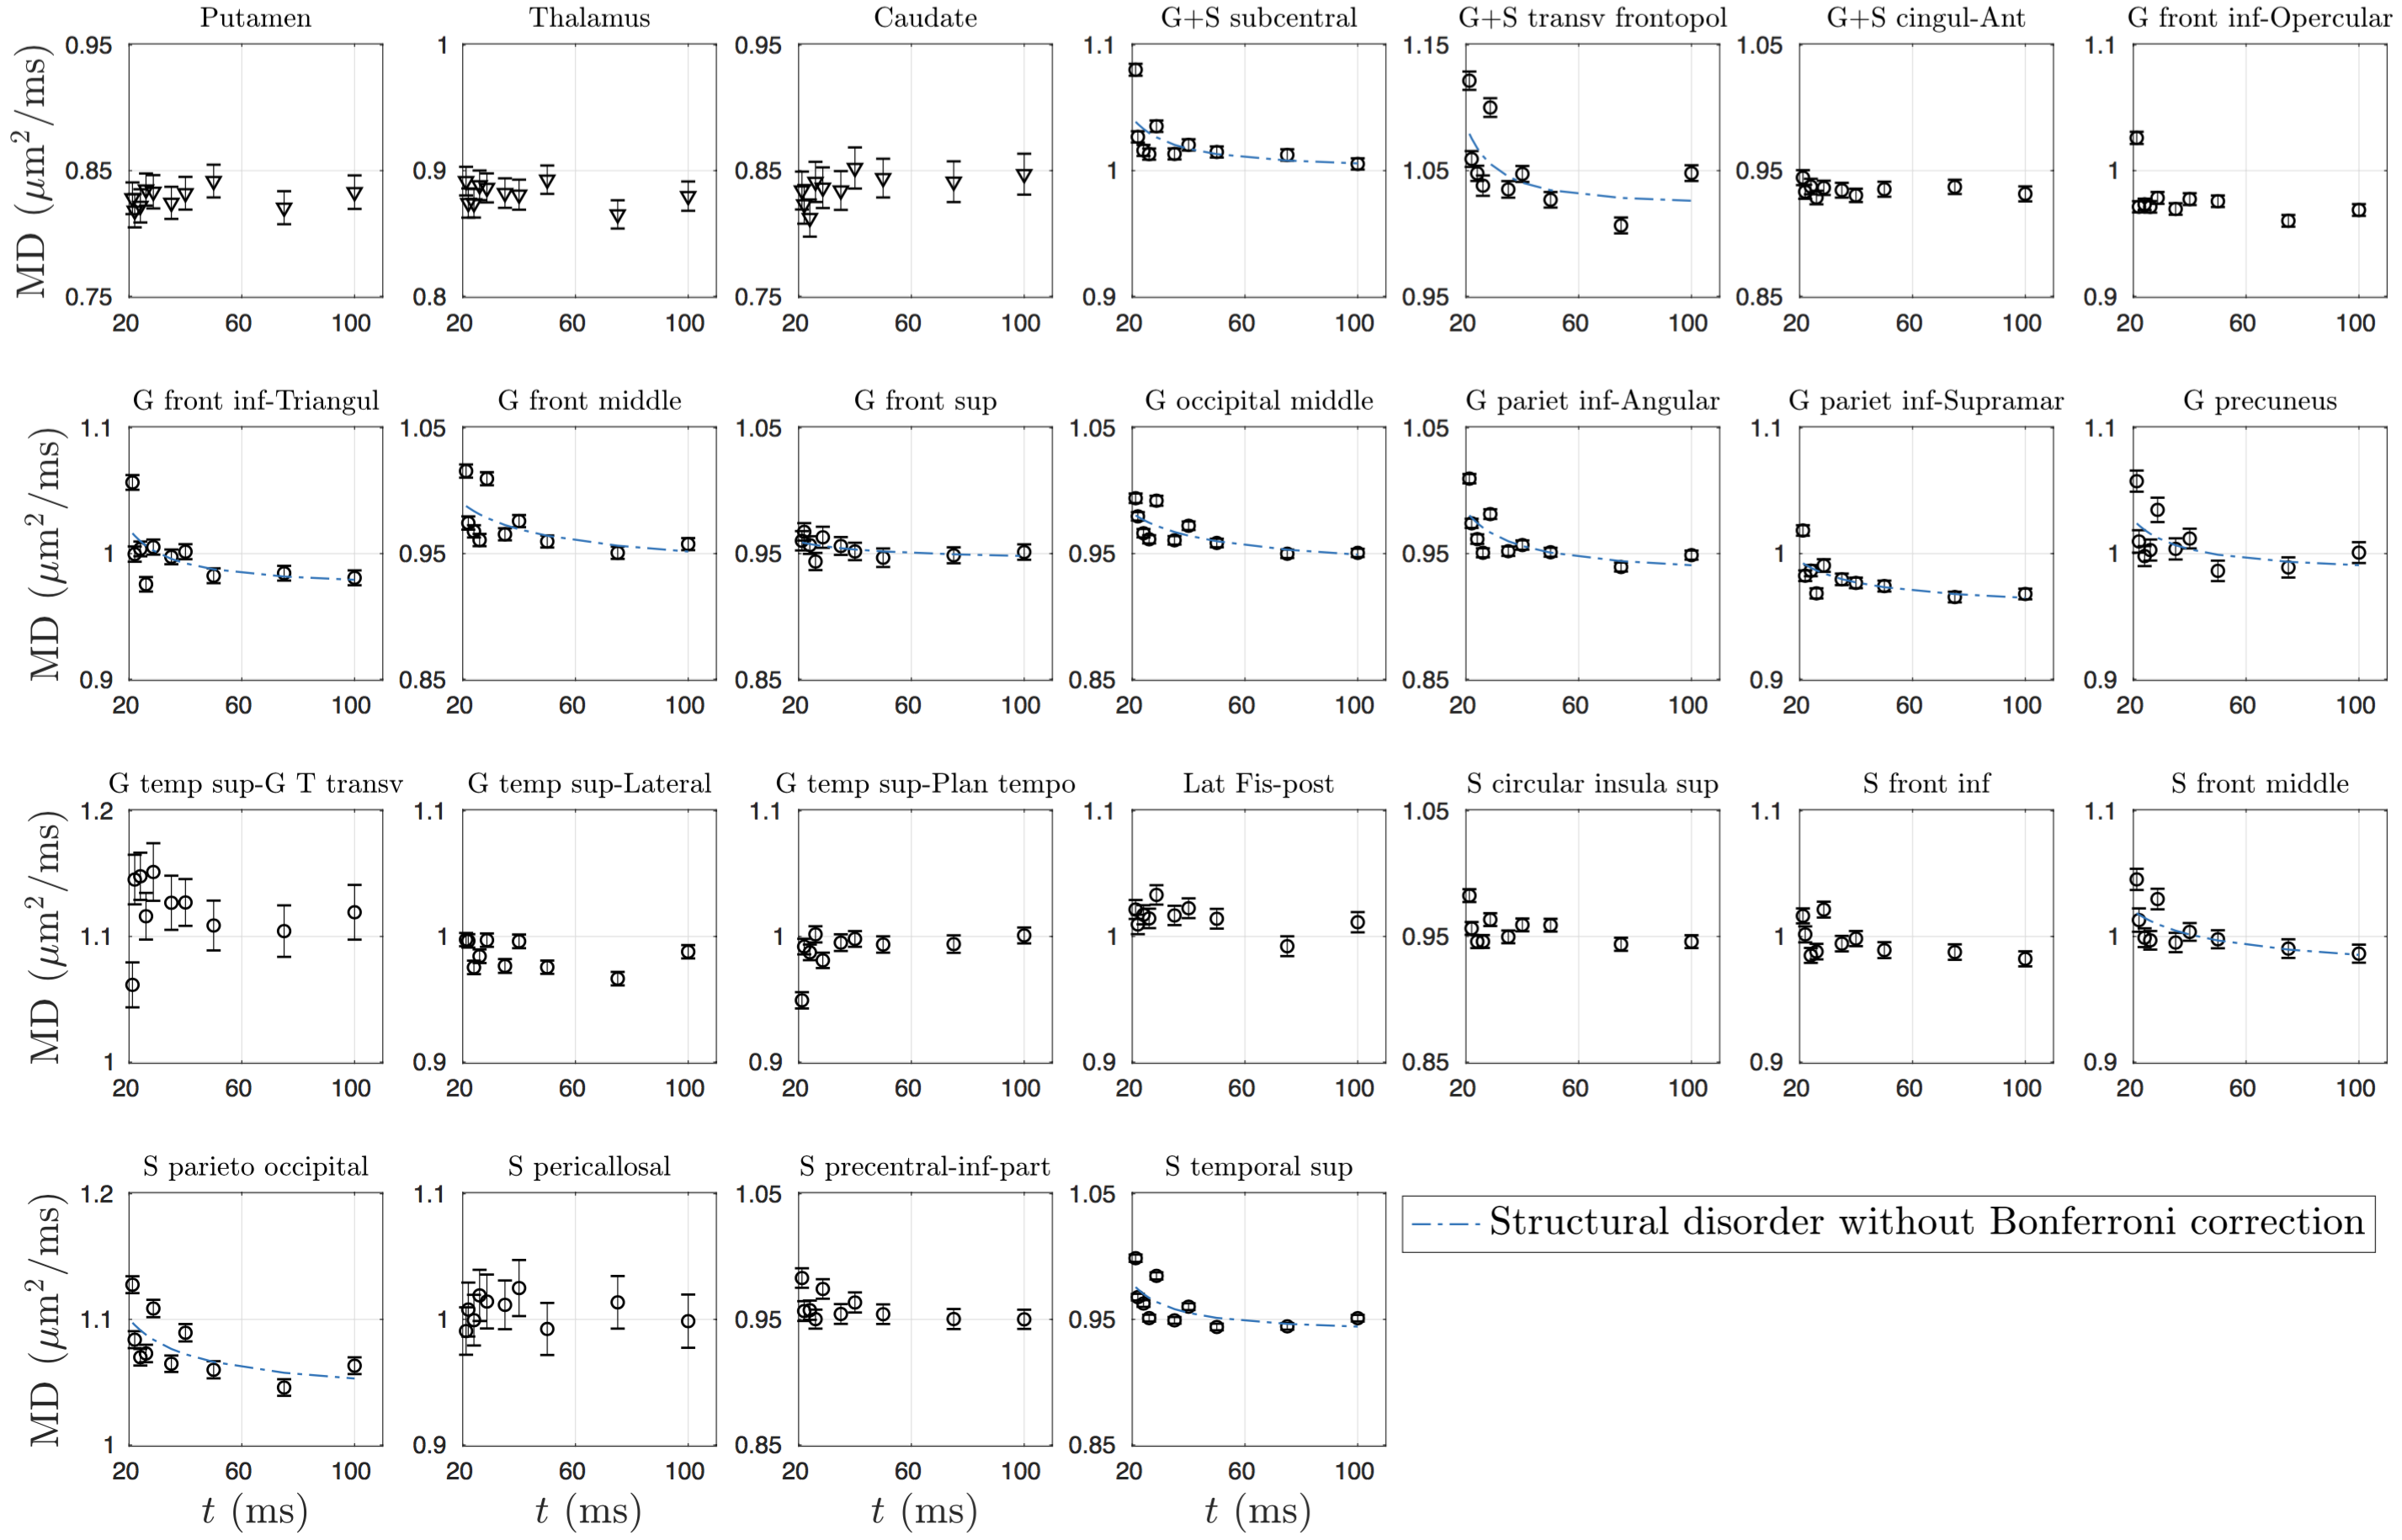
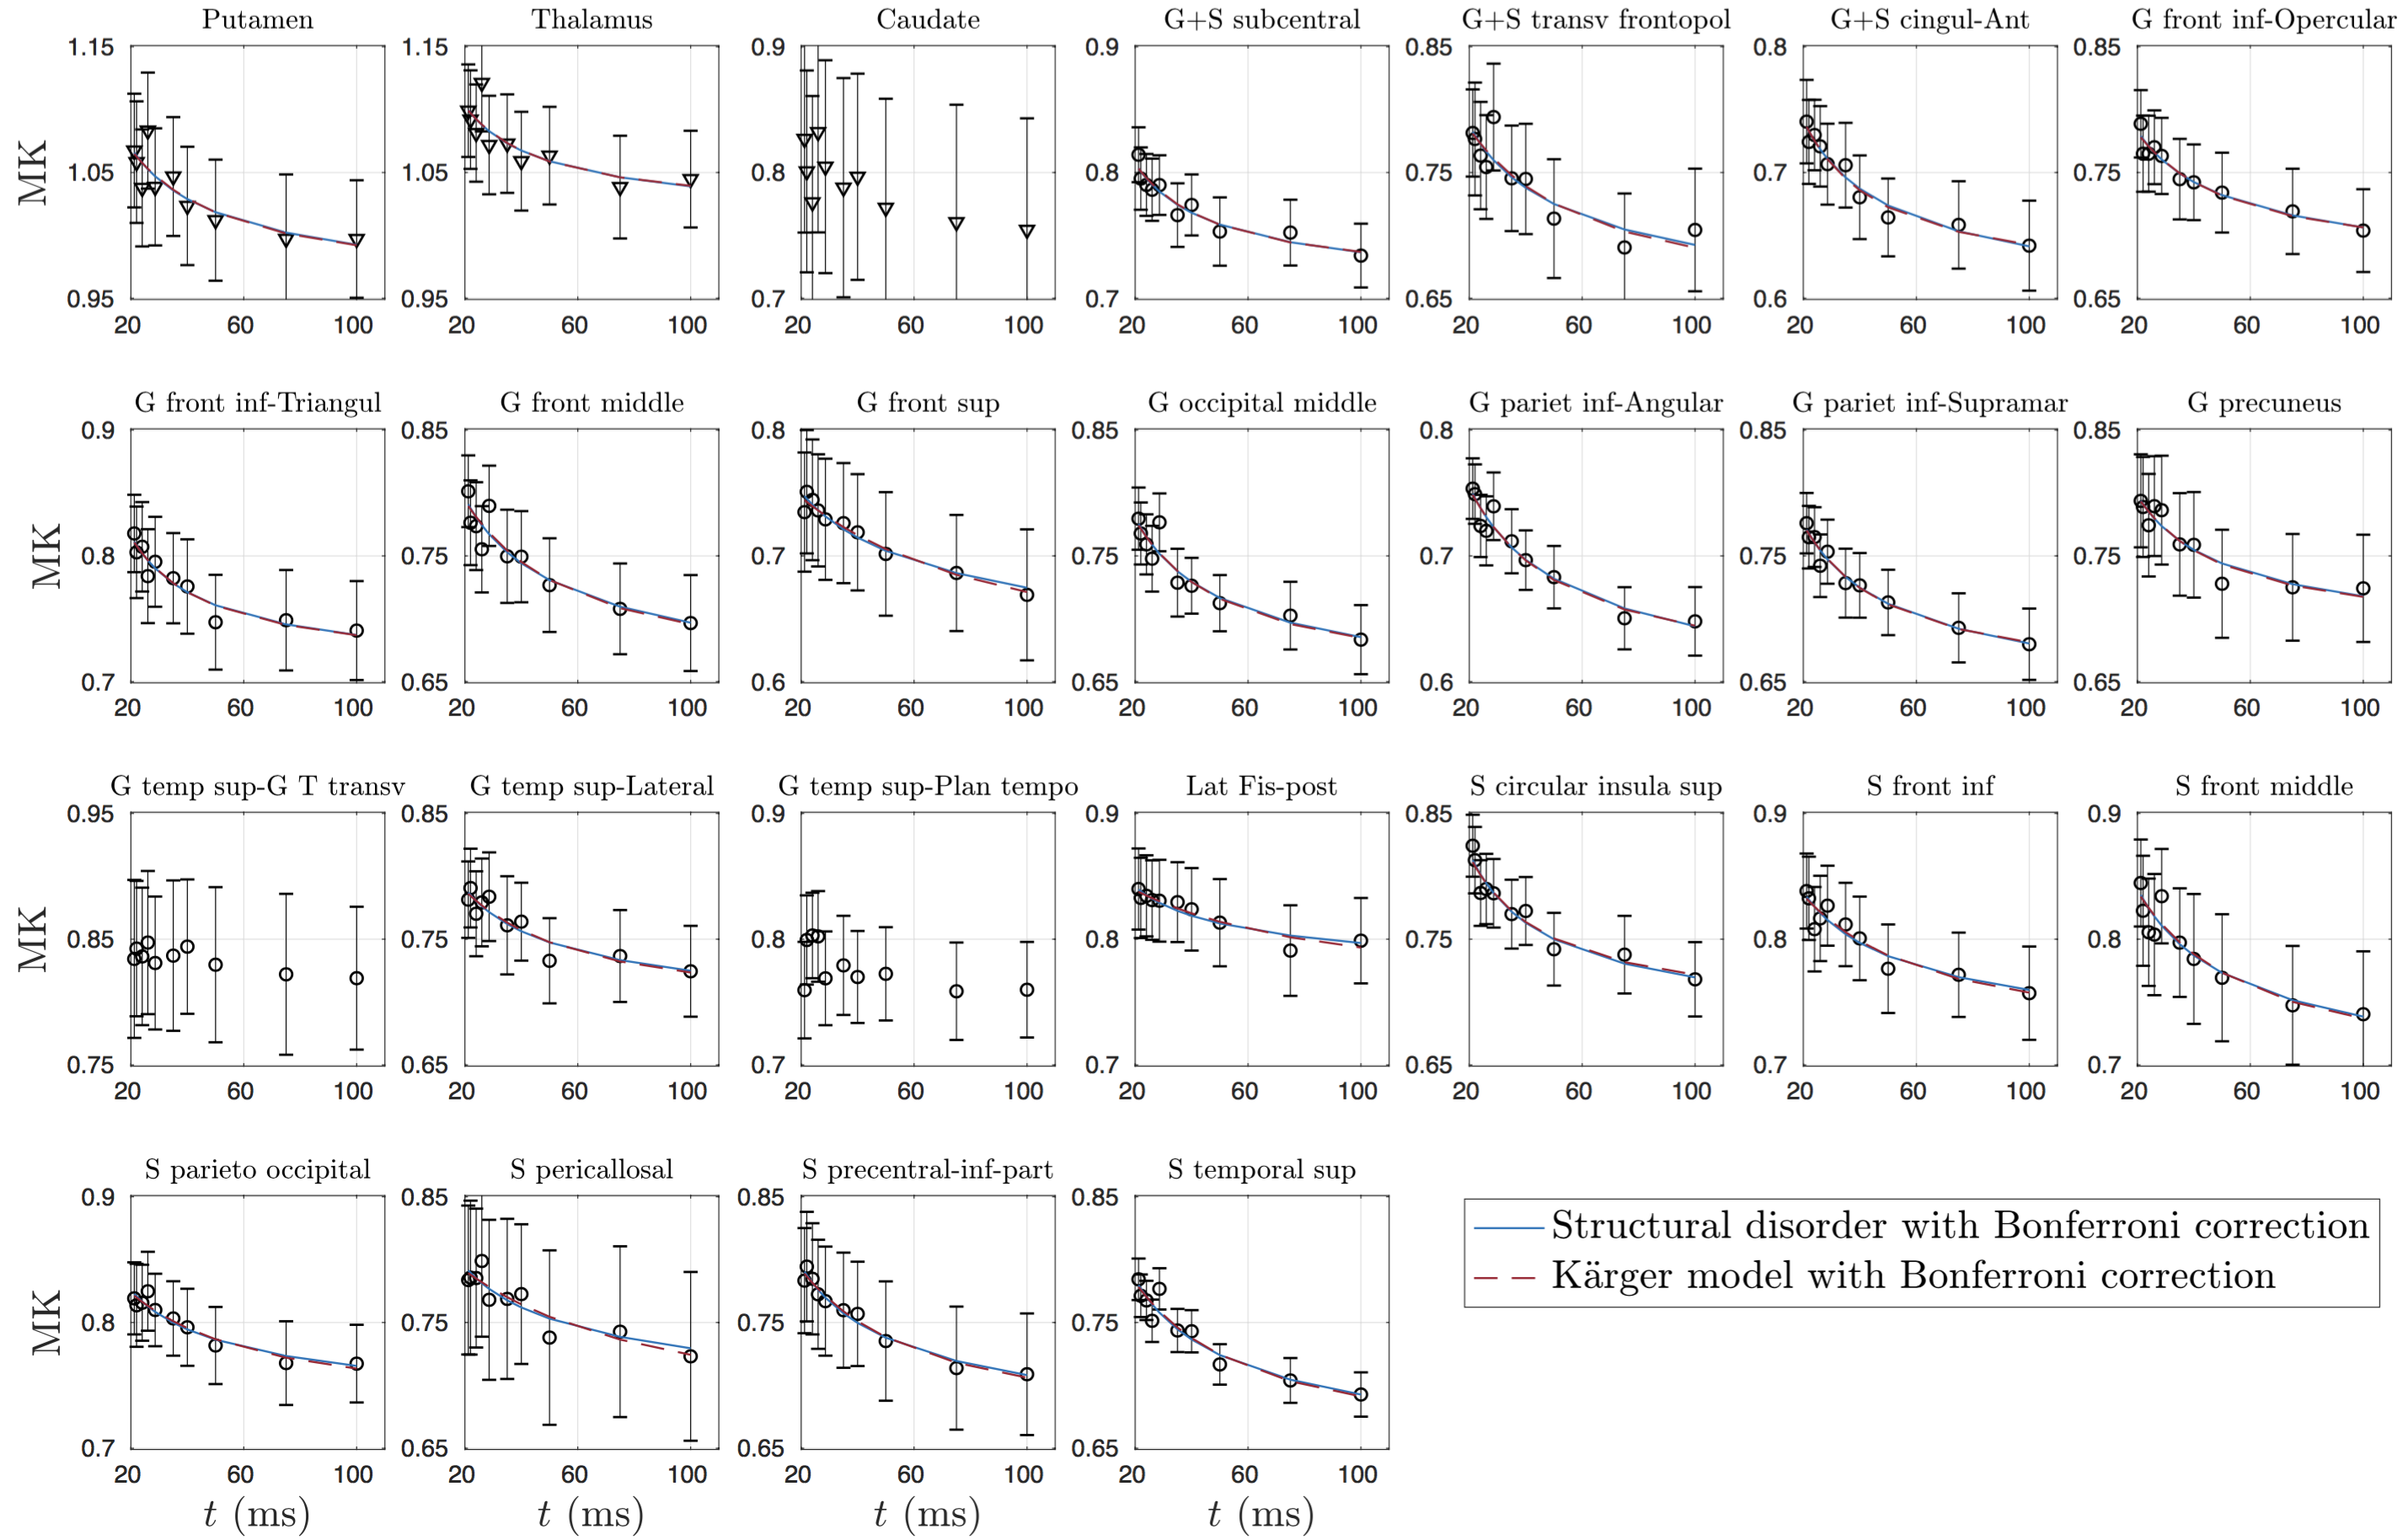
dMRI was processed using DESIGNER[10], and for each $$$t$$$, $$$K$$$-maps were calculated[11]. GM sub-regions (list shown in Fig.4)were segmented using Freesurfer[12], and transformed to dMRI-space[13]. CSF mask dilated by one voxel was applied to avoid partial volume effect.
Results
Overall, time-dependence is found for $$$D(t)$$$ in cortical GM, but not in deep GM (Fig.1b). In contrast, a stronger $$$K(t)$$$ time-dependence is found both in cortical GM and deep GM (Fig.1c).Results for GM subregions are shown in Figs.2-5. While Fig.2 shows $$$D(t)$$$ time-dependence in 12/25 regions (all cortical), it disappears after correction for multiple comparisons. In contrast, Fig.3 shows stronger $$$K(t)$$$ time-dependence in 22/25 regions that remain significant after correction.
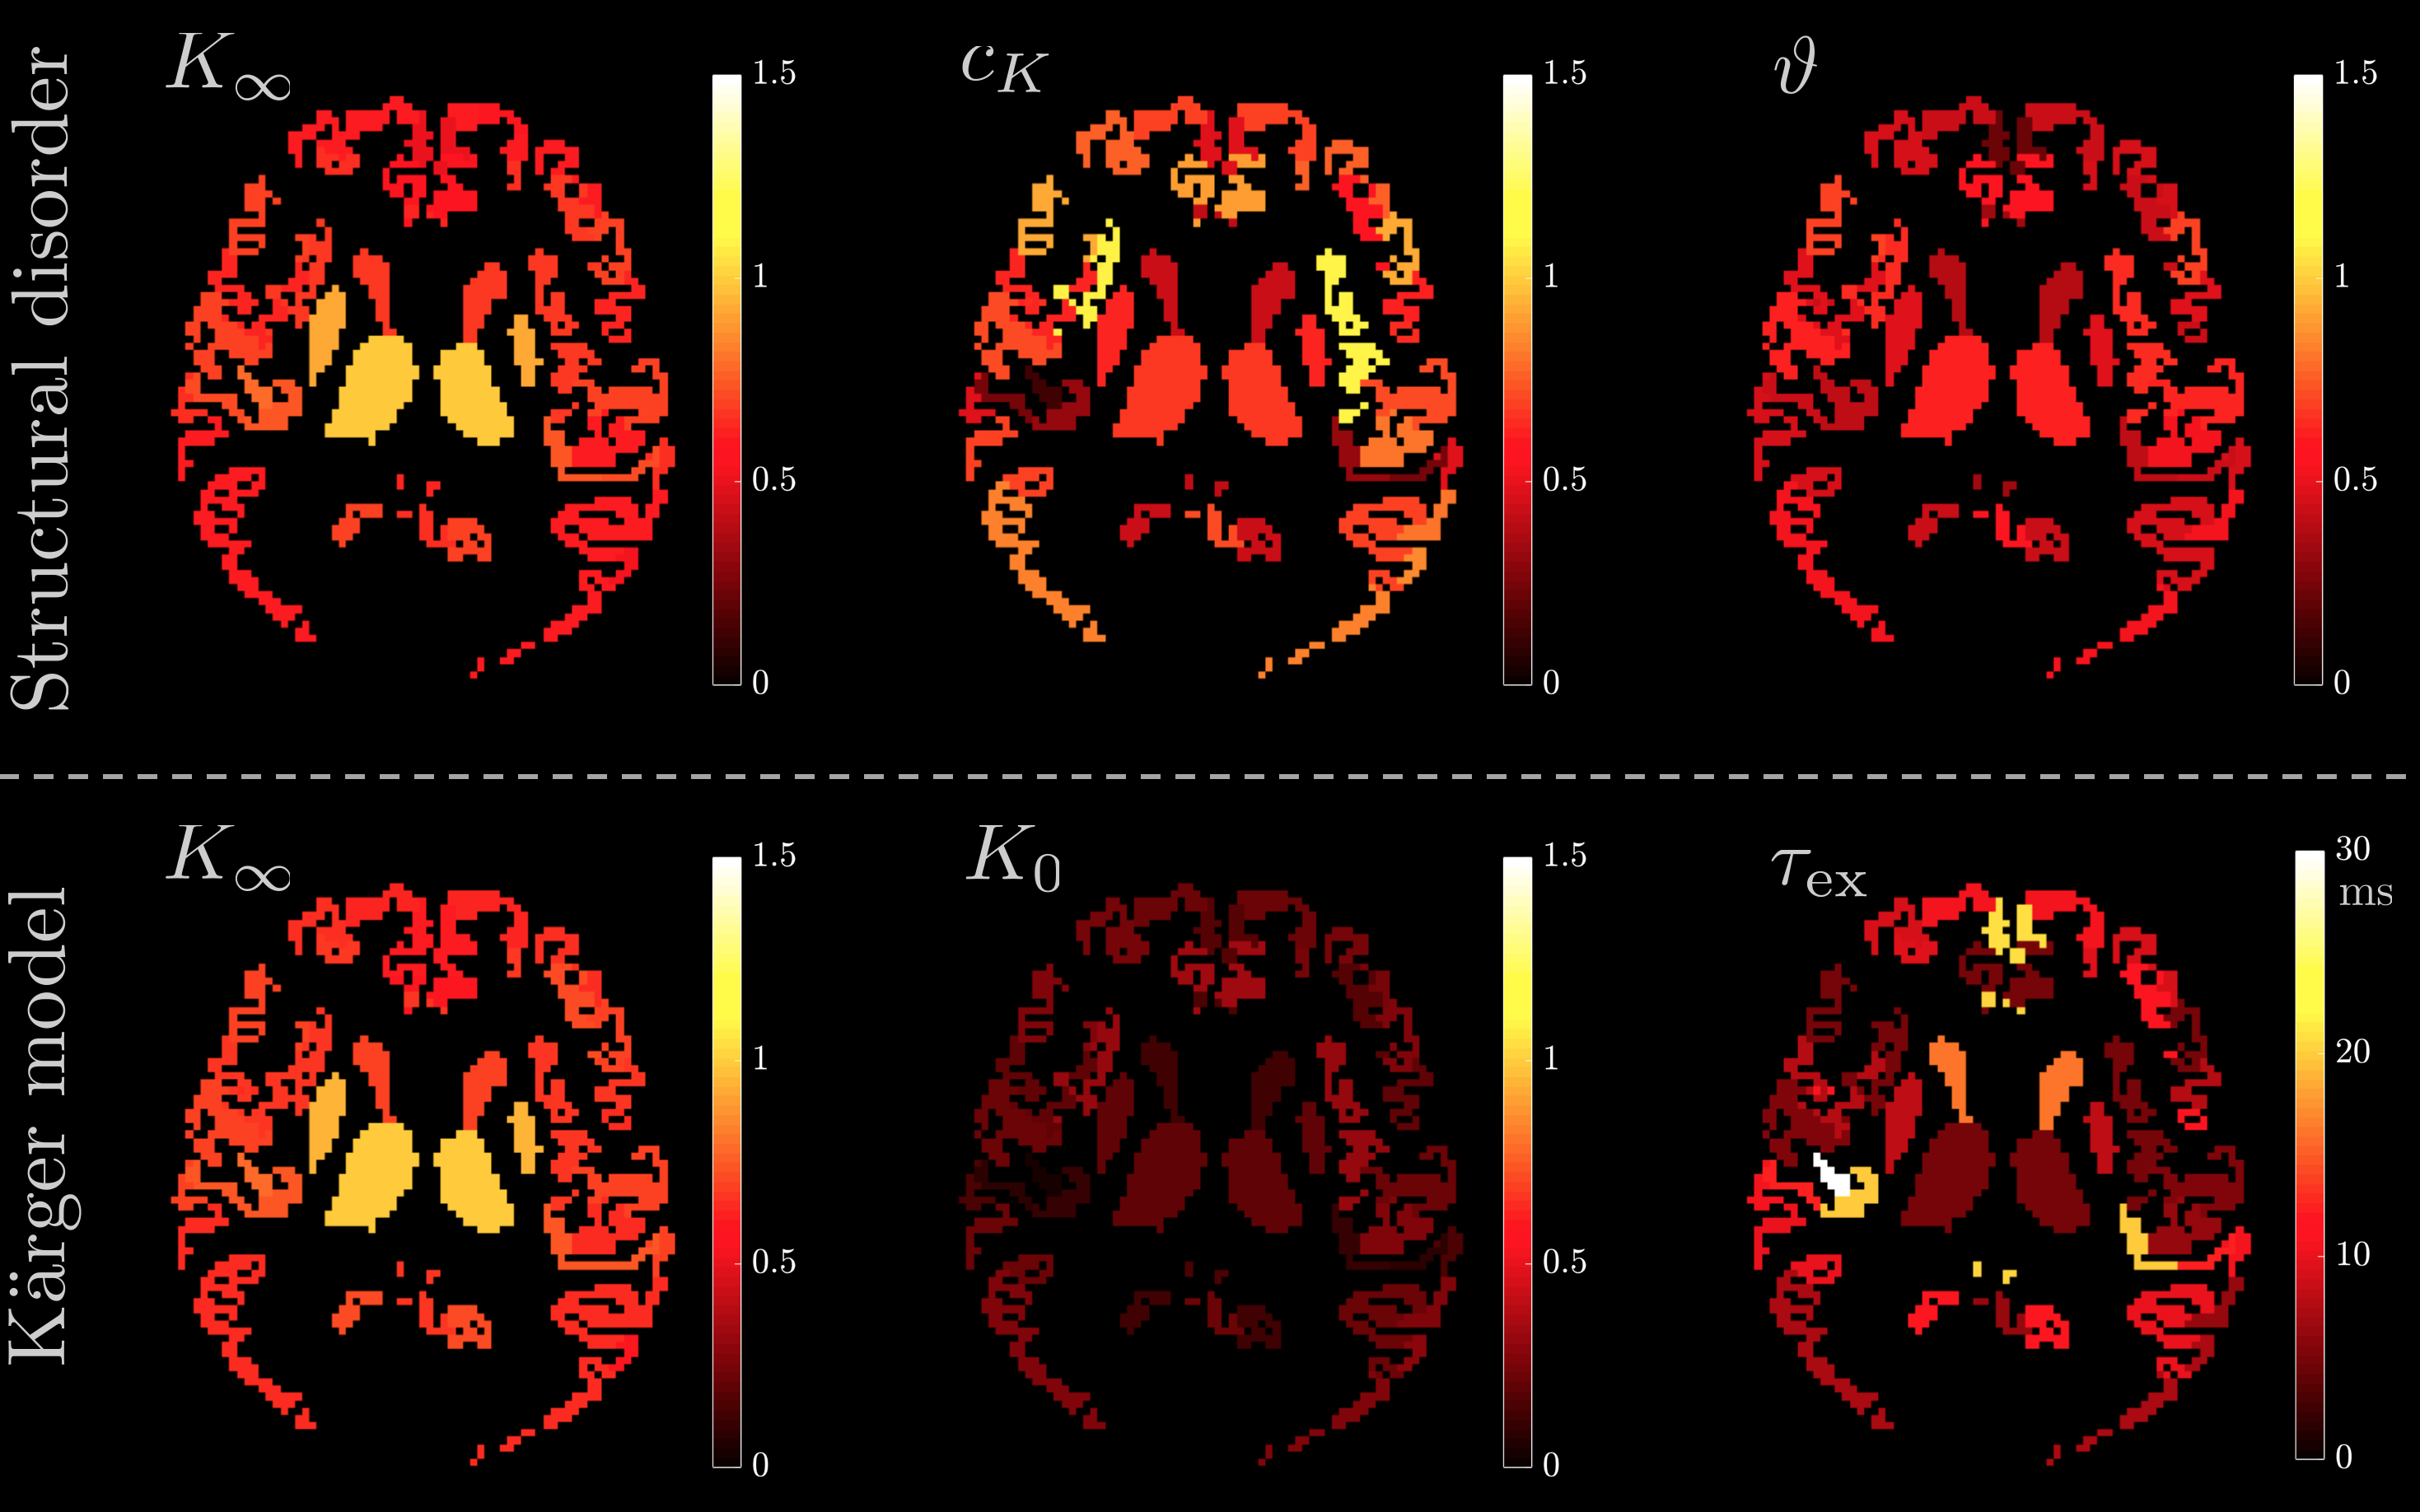
Since our results show an overall fairly weak or non significant time-dependence in $$$D(t)$$$, we considered both models (structural disorder vs KM) for fitting the data. The corresponding fit parameters are shown in Fig.1b-c for deep and cortical GM, and in Fig.4 for GM subregions. For structural disorder, Eq.(1), the dynamical exponent $$$\vartheta\approx0.5$$$ in most of the regions, indicating that restrictions along neurites are randomly positioned (short-range disorder in 1$$$d$$$). In contrast, for the KM, Eq.(2), the exchange time $$$\tau_\mathrm{ex}\sim10$$$ms, which is below the actual $$$t$$$-range of the experiment.
Fig.5 visualizes the spatial variation of fit parameters in a human GM. For structural disorder, $$$\vartheta$$$ is uniformly close to 1/2, while the other parameters $$$K_\infty$$$ and $$$c_K$$$ show more variation, particularly between deep and cortical GM.
Discussion and Conclusion
Using the proposed decision tree to interpret $$$D(t)$$$ and $$$K(t)$$$ in GM, we observe that 1$$$d$$$ structural disorder explains our in vivo human data well. Fitting of Eq.(1) yields $$$\vartheta\approx1/2$$$, which suggests that diffusion along neurites is affected by short-range disorder (randomly positioned restrictions), consistent with histological results[6,7], and the observed power law is different from KM $$$K(t)\sim1/t$$$ for $$$t\gg\tau_{ex}$$$, Eq.(2).Furthermore, KM fitting yields exchange time $$$\sim$$$10ms, which is out of our measurement range (shortest $$$t$$$=20ms), as well as contradicts the underlying assumption of slow exchange regime[9]. Hence, we conclude that KM cannot be used to explain the observed time-dependence. At the same time, however, we cannot exclude a possible contribution of exchange to our observed data. While exchange time $$$\tau_\mathrm{ex}>1000$$$ms was in vivo measured in lenticular nucleus and thalamus using FEXI[14], and $$$\tau_\mathrm{ex}\approx115$$$ms found between extra-neurite space and astrocytes in vitro[15], much shorter $$$\tau_\mathrm{ex}\sim10-30$$$ms range was recently found in human GM.[16] If exchange, we speculate that human GM may be in the crossover regime, where it competes with structural disorder (node 2.2.2 in Fig.1).
In conclusion, while model-selection is not fully resolved, we argue here to include structural disorder in GM modeling. Regional variation in $$$K_\infty$$$ and $$$c_K$$$ potentially relates to spine density and warrants further investigation.
Acknowledgements
We would like to thank Thorsten Feiweier for developing advanced diffusion WIP sequence. Research was supported by the National Institute of Neurological Disorders and Stroke of the NIH under award number R01 NS088040 and R21 NS081230, and was performed at the Center of Advanced Imaging Innovation and Research (CAI2R, www.cai2r.net), an NIBIB Biomedical Technology Resource Center (NIH P41 EB017183).References
[1] Baron, C. A., & Beaulieu, C. (2014). Oscillating gradient spin‐echo (OGSE) diffusion tensor imaging of the human brain. Magnetic resonance in medicine, 72(3), 726-736.
[2] Papaioannou, A., Novikov, D. S., & Fieremans, E. (2017). In vivo observation and interpretation of time dependent diffusion in human gray matter. Proceedings of ISMRM, 25, 0723.
[3] Novikov, D. S., & Kiselev, V. G. (2010). Effective medium theory of a diffusion‐weighted signal. NMR in Biomedicine, 23(7), 682-697.
[4] Novikov, D. S., Jensen, J. H., Helpern, J. A., & Fieremans, E. (2014). Revealing mesoscopic structural universality with diffusion. Proceedings of the National Academy of Sciences, 111(14), 5088-5093.
[5] Dhital, B., Kellner, E., Kiselev, V. G., & Reisert, M. (2018). The absence of restricted water pool in brain white matter. Neuroimage, 182, 398-406.
[6] Hellwig, B., Schüz, A., & Aertsen, A. (1994). Synapses on axon collaterals of pyramidal cells are spaced at random intervals: a Golgi study in the mouse cerebral cortex. Biological cybernetics, 71(1), 1-12.
[7] Shepherd, G. M., Raastad, M., & Andersen, P. (2002). General and variable features of varicosity spacing along unmyelinated axons in the hippocampus and cerebellum. Proceedings of the National Academy of Sciences, 99(9), 6340-6345.
[8] Kärger, J., & Heink, W. (1983). The propagator representation of molecular transport in microporous crystallites. Journal of Magnetic Resonance (1969), 51(1), 1-7.
[9] Fieremans, E., Novikov, D. S., Jensen, J. H., & Helpern, J. A. (2010). Monte Carlo study of a two‐compartment exchange model of diffusion. NMR in Biomedicine, 23(7), 711-724.
[10] Ades-Aron, B., Veraart, J., Kochunov, P., McGuire, S., Sherman, P., Kellner, E., Novikov, D. S., & Fieremans, E. (2018). Evaluation of the accuracy and precision of the diffusion parameter EStImation with Gibbs and NoisE removal pipeline. NeuroImage, 183, 532-543.
[11] Veraart, J., Sijbers, J., Sunaert, S., Leemans, A., & Jeurissen, B. (2013). Weighted linear least squares estimation of diffusion MRI parameters: strengths, limitations, and pitfalls. NeuroImage, 81, 335-346.
[12] Reuter, M., Schmansky, N. J., Rosas, H. D., & Fischl, B. (2012). Within-subject template estimation for unbiased longitudinal image analysis. Neuroimage, 61(4), 1402-1418.
[13] Jenkinson, M., Bannister, P., Brady, M., & Smith, S. (2002). Improved optimization for the robust and accurate linear registration and motion correction of brain images. Neuroimage, 17(2), 825-841.
[14] Lampinen, B., Szczepankiewicz, F., van Westen, D., Englund, E., C Sundgren, P., Lätt, J., ... & Nilsson, M. (2017). Optimal experimental design for filter exchange imaging: Apparent exchange rate measurements in the healthy brain and in intracranial tumors. Magnetic resonance in medicine, 77(3), 1104-1114.
[15] Yang, D. M., Huettner, J. E., Bretthorst, G. L., Neil, J. J., Garbow, J. R., & Ackerman, J. J. (2018). Intracellular water preexchange lifetime in neurons and astrocytes. Magnetic resonance in medicine, 79(3), 1616-1627.
[16] Veraart, J., Fieremans, E., Rudrapatna, U., Jones, D. K., & Novikov, D. S. (2018). Biophysical modeling of the gray matter: does the “stick” model hold? Proc. Intl. Soc. Mag. Reson. Med. 26, p.1094
Figures