0713
Modeling cortical architectonic features by analyzing diffusion MRI data in the cortical reference frame1NICHD, National Institutes of Health, Bethesda, MD, United States, 2The Henry Jackson Foundation, Bethesda, MD, United States, 3NIMH, National Institutes of Health, Bethesda, MD, United States, 4NINDS, National Institutes of Health, Bethesda, MD, United States
Synopsis
We quantified the alignment between the DTI reference frame (DRF) and the cortical reference frame (CRF) throughout the entire cerebral cortex in a macaque brain, and found relatively good correspondence, especially in regions with high curvature such as the gyral walls and the cortical sulci. Based on this correspondence, we analyze cortical diffusion signals in the CRF and construct a simple model of cortical diffusion with distinct radial (columnar) and tangential (sheet-like) diffusion processes in cortical layers. The variation of model parameters with cortical depth reflects architectonic features described in a histologically defined digital macaque brain atlas.
INTRODUCTION
Diffusion MRI (dMRI) analysis in anisotropic tissues such as white matter (WM) can be simplified considerably by using the diffusion tensor imaging (DTI)1 reference frame (DRF). The DRF is coincident with the dominant orientation of the underlying tissue microanatomy and provides a basis for making useful simplifying assumptions in the construction of many WM tissue models, such as CHARMED2 or AxCaliber3. In tissues with low anisotropy, such as gray matter (GM), due to the similarity of the principal diffusivities, the DRF is poorly defined and prone to sorting bias4 preventing the construction of a continuous and anatomically-consistent DRF tensor field approximation. Nevertheless, recent studies5-7 suggest that at high spatial resolution diffusion anisotropy in the cortex varies with the folding geometry, i.e., the cortical reference frame (CRF), showing preferentially radial and tangential components8-10 which evoke cortical columns and layers11,12, respectively, that can be observed with post-mortem histological staining.We conduct a whole-cortex analysis of the alignment between the DRF and the CRF in the macaque brain and explore the possibility of employing the latter to construct eloquent, simplified models of water diffusion in the cortex. We analyze tissue model parameters in cortical regions-of-interest (ROIs) obtained from a histologically-defined macaque brain atlas13,14. dMRI models that reveal columnar (radial) and sheet-like (tangential) diffusion components in the cortex could automate in vivo cortical architectonic mapping, improve the clinical characterization of neuroinflammatory and neurodegenerative diseases, and advance our ability to study the developmental timelines of cortical cyto- and myelo-architecture15,16 inter alia.
METHODS
We acquired 101 diffusion-weighted images (DWIs) of a perfusion-fixed macaque brain17 at 7T using a 250µm isotropic resolution, FOV=78x64x72cm, TE/TR=33.3/250ms. We used multiple b-values (100,600,1500,2800,4800,7200,10000s/mm2) with gradient orientations (3,4,8,12,18,24,32 respectively) uniformly sampling the unit sphere for each b-shell and across shells, and gradient pulse parameters δ=8ms and Δ=16.1ms. We also conducted a magnetization transfer (MT) prepared gradient-echo experiment, segmented18 the WM and GM, reconstructed the GM/WM and pial cortical surfaces19 and computed intermediate surfaces corresponding to cortical layers using the equivolumetric principle20,21. We registered22 the histologically-defined D99 digital rhesus macaque brain atlas13,14 to the EPI distortion-corrected DWIs23 allowing for correlation analysis between dMRI parameters and histological stains in corresponding cortical areas.We quantified the relative alignment between the CRF and the DRF throughout the cortex by measuring the radial and tangential deviations, angles $$$\theta$$$ and $$$\phi$$$, respectively (Fig.1), and found relatively small deviations which justified dMRI analysis in the CRF. Consequently, we analyzed the DWIs (interpolated at each vertex of each layer surface) in the CRF using a simple two-component “stick-and-disc” tissue model that accounts for separate (non-exchanging) radial and tangential diffusion processes in each cortical layer (Fig.2):
$$E_{c}(\mathbf{g})=fe^{-\mathbf{g^T(\widehat{n}\widehat{n}^T)g}D_{r}}+(1-f)e^{-\mathbf{g^T(\widehat{c_{1}}\widehat{c_{1}}^T+\widehat{c_{2}}\widehat{c_{2}}^T)g}D_{t}}$$,
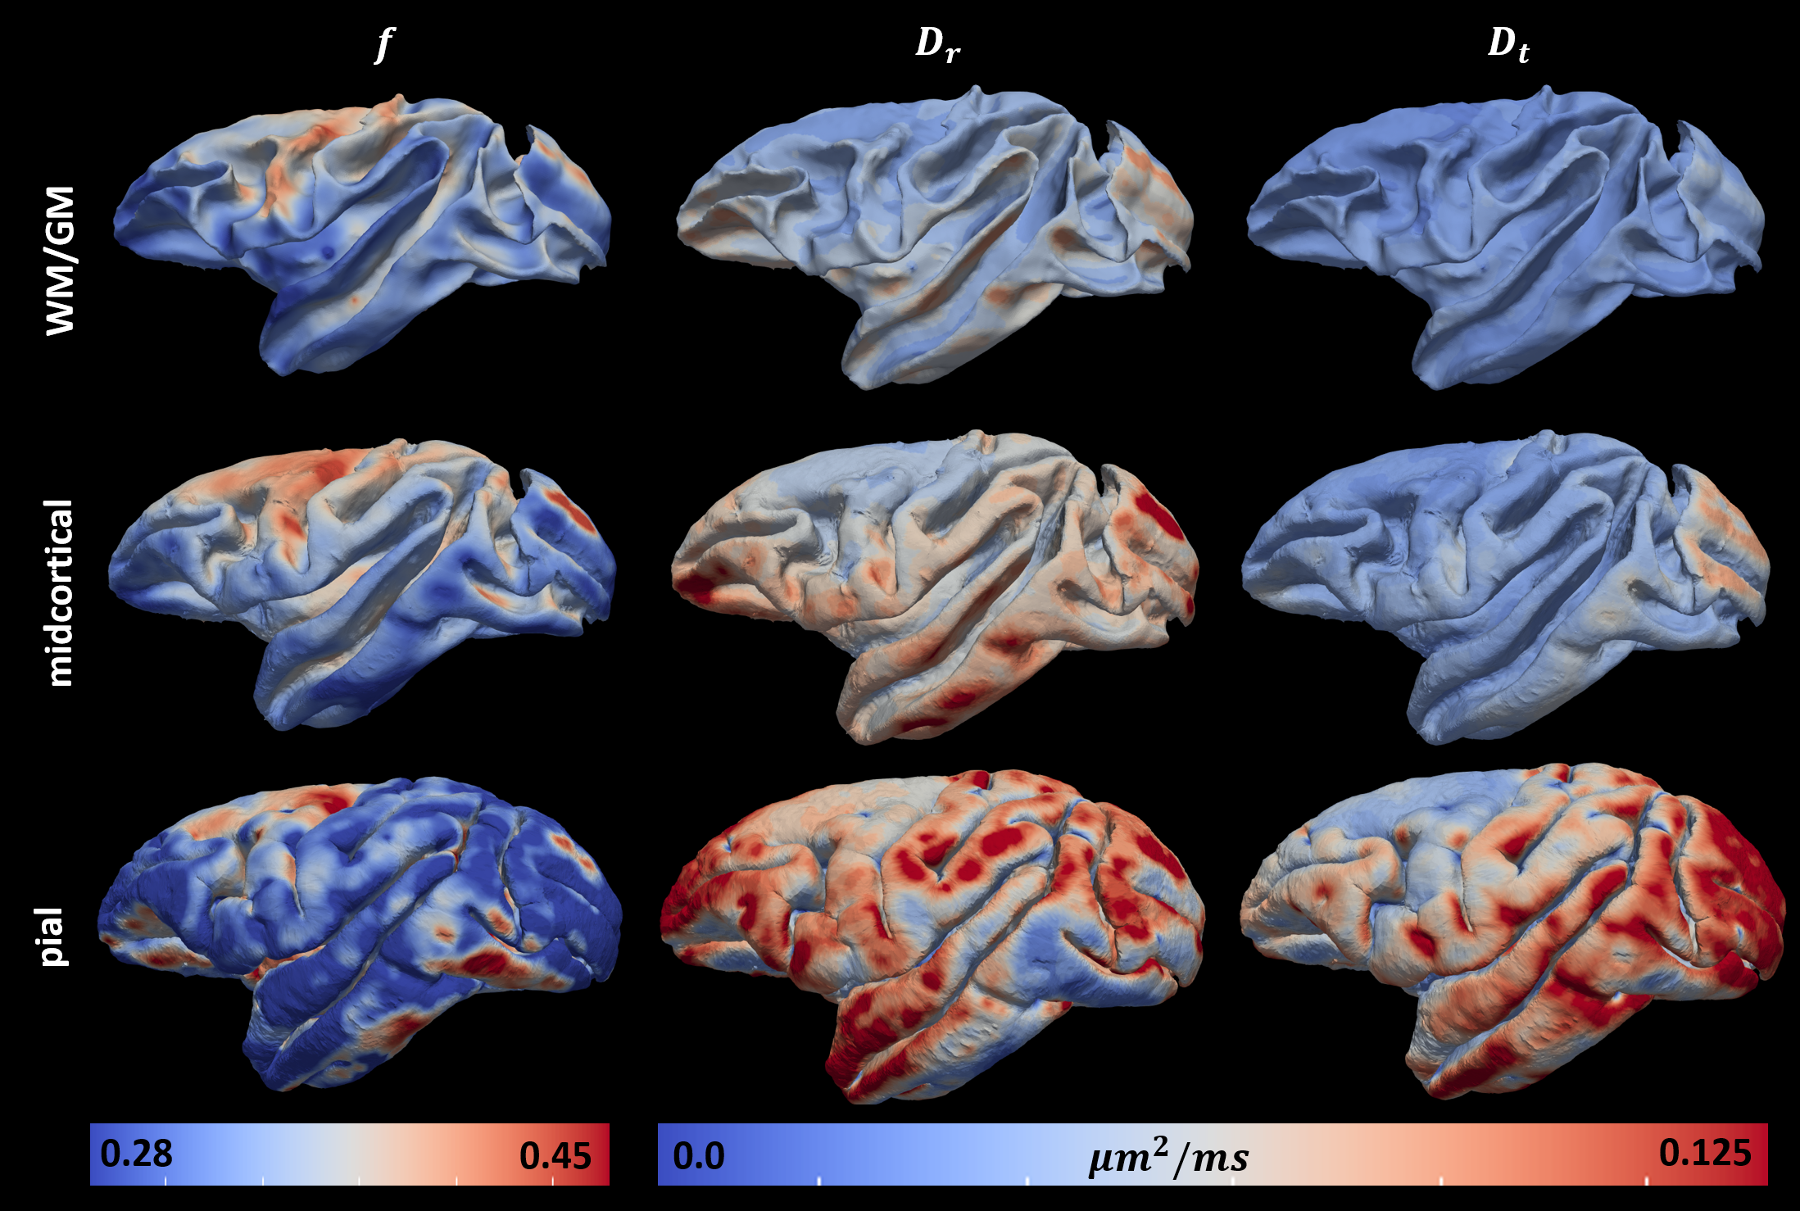
where $$$E_{c}(\mathbf{g})$$$ is the diffusion signal attenuation as a function of the applied gradient $$$\mathbf{g}$$$; $$$f$$$ represents the signal fraction of the radial diffusion component; while the scalars $$$D_{r}$$$ and $$$D_{t}$$$ define the cylindrically symmetric degenerate rank-1 (radial) and rank-2 (tangential) diffusion tensors aligned with the cortical surface normal, $$$\widehat{n}$$$, and the tangent plane defined by the minimum and maximum Gaussian curvature orientations, $$$\widehat{c_{1}}$$$ and $$$\widehat{c_{2}}$$$, respectively (Fig.1). We computed cortical depth profiles of $$$f$$$, $$$D_{r}$$$ and $$$D_{t}$$$ and quantified their statistics in regions-of-interest (ROIs) obtained from the histologically-defined D99 macaque brain atlas.
RESULTS
Matching the axes of the DRF and CRF (Fig.1) in regions with very low anisotropy, allows reordering of the diffusion tensor axes (i.e., sorting of the principal diffusivities) to produce a more continuously-varying tensor field approximation in the cortex. Moreover, the relatively small deviations between the DRF and CRF (Fig.2) suggest that the CRF may provide a well-defined anatomically-consistent and continuous reference fame for use in dMRI analysis, especially in regions with high curvature.The largest misalignment is observed in regions with negative curvature (i.e., gyral crowns) and low diffusion anisotropy (e.g., the superior temporal gyrus) where the DRF is poorly-defined (Fig.2). Significantly better alignment can be observed in cortical areas with high curvature along the gyral walls and in the sulci.
The mid-cortical layer shows the largest values of f (Fig.4), consistent with the increased presence of radial projections in histological observations of cortical myeloarchitecture (Fig.3). The largest difference between Dr and Dt, was also found in the mid-cortical layers, suggesting the presence of strong diffusion processes along cortical columns, in agreement with previous findings8-10 (Fig.4).
DISCUSSION AND CONCLUSIONS
Our results point to a remarkable correspondence between structural and functional reference frames across multiple length scales. The DRF describes a physiological process (water diffusion) at the microscopic scale (~5μm) while the CRF characterizes brain anatomy (cortical folding) at the macroscopic and mesoscopic scales (~500μm). The correspondence between these two reference frames (Fig.2) suggests that biological structures at the meso- and macroscopic scales may arise from processes at the microscopic scale, which would determine local transport properties, particularly the diffusion of various molecules (e.g., growth factors) during development15.Concurrently, our results also imply that, from the cortical surface geometry, one could infer information about the microscopic tissue organization, which may simplify dMRI analysis within cortical areas, and among cortical layers, primarily by reducing the number of degrees of freedom in analyzing signals and constructing tissue models.
Acknowledgements
This work was supported by the Intramural Research Program of the Eunice Kennedy Shriver National Institute of Child Health and Human Development, “Connectome 2.0: Developing the next generation human MRI scanner for bridging studies of the micro-, meso- and macro-connectome”, NIH BRAIN Initiative 1U01EB026996-01 and the CNRM Neuroradiology/Neuropathology Correlation/Integration Core, 309698-4.01-65310, (CNRM-89-9921). We thank Drs. Paul Taylor and Daniel Glen for helpful discussions and Dr. Bernard Dardzinski for providing the RF coil used in this experiment.References
1 Basser, P. J., Mattiello, J. & LeBihan, D. MR diffusion tensor spectroscopy and imaging. Biophysical journal 66, 259-267 (1994).
2 Assaf, Y. & Basser, P. J. Composite hindered and restricted model of diffusion (CHARMED) MR imaging of the human brain. NeuroImage 27, 48-58, doi:10.1016/j.neuroimage.2005.03.042 (2005).
3 Assaf, Y., Blumenfeld‐Katzir, T., Yovel, Y. & Basser, P. J. AxCaliber: a method for measuring axon diameter distribution from diffusion MRI. Magnetic Resonance in Medicine: An Official Journal of the International Society for Magnetic Resonance in Medicine 59, 1347-1354 (2008).
4 Pierpaoli, C. & Basser, P. J. Toward a quantitative assessment of diffusion anisotropy. Magnetic resonance in Medicine 36, 893-906 (1996).
5 Miller, K. L. et al. Diffusion imaging of whole, post-mortem human brains on a clinical MRI scanner. NeuroImage 57, 167-181, doi:10.1016/j.neuroimage.2011.03.070 (2011).
6 McNab, J. A. et al. Surface based analysis of diffusion orientation for identifying architectonic domains in the in vivo human cortex. NeuroImage 69, 87-100, doi:https://doi.org/10.1016/j.neuroimage.2012.11.065 (2013).
7 Cottaar, M. et al. A gyral coordinate system predictive of fibre orientations. NeuroImage 176, 417-430, doi:https://doi.org/10.1016/j.neuroimage.2018.04.040 (2018).
8 Aggarwal, M., Nauen, D. W., Troncoso, J. C. & Mori, S. Probing region-specific microstructure of human cortical areas using high angular and spatial resolution diffusion MRI. NeuroImage 105, 198-207, doi:10.1016/j.neuroimage.2014.10.053 (2015).
9 Leuze, C. W. U. et al. Layer-Specific Intracortical Connectivity Revealed with Diffusion MRI. Cerebral Cortex 24, 328-339, doi:10.1093/cercor/bhs311 (2012).
10 Kleinnijenhuis, M. et al. Layer-specific diffusion weighted imaging in human primary visual cortex invitro. Cortex 49, 2569-2582, doi:10.1016/j.cortex.2012.11.015 (2013).
11 Bastiani, M. et al. Automatic segmentation of human cortical layer-complexes and architectural areas using Ex vivo diffusion MRI and its validation. Frontiers in Neuroscience 10, doi:10.3389/fnins.2016.00487 (2016).
12 Nagy, Z., Alexander, D. C., Thomas, D. L., Weiskopf, N. & Sereno, M. I. Using High Angular Resolution Diffusion Imaging Data to Discriminate Cortical Regions. PLoS ONE 8, doi:10.1371/journal.pone.0063842 (2013).
13 Reveley, C. et al. Three-dimensional digital template atlas of the macaque brain. Cerebral Cortex 27, 4463-4477 (2016).
14 Saleem, K. S. & Logothetis, N. K. A combined MRI and histology atlas of the rhesus monkey brain in stereotaxic coordinates. (Academic Press, 2012).
15 McKinstry, R. C. et al. Radial organization of developing preterm human cerebral cortex revealed by non-invasive water diffusion anisotropy MRI. Cerebral cortex 12, 1237-1243 (2002).
16 Barkovich, A. (Philadelphia, New York, 2000).
17 D'Arceuil, H. E., Westmoreland, S. & de Crespigny, A. J. An approach to high resolution diffusion tensor imaging in fixed primate brain. NeuroImage 35, 553-565, doi:10.1016/j.neuroimage.2006.12.028 (2007).
18 Zhang, Y., Brady, M. & Smith, S. Segmentation of brain MR images through a hidden Markov random field model and the expectation-maximization algorithm. IEEE transactions on medical imaging 20, 45-57 (2001).
19 Fischl, B. FreeSurfer. NeuroImage 62, 774-781, doi:10.1016/j.neuroimage.2012.01.021 (2012).
20 Bok, S. T. Der Einflu\ der in den Furchen und Windungen auftretenden Krümmungen der Gro\hirnrinde auf die Rindenarchitektur. Zeitschrift für die gesamte Neurologie und Psychiatrie 121, 682-750, doi:10.1007/BF02864437 (1929).
21 Wagstyl, K. et al. Automated segmentation of cortical layers in BigBrain reveals divergent cortical and laminar thickness gradients in sensory and motor cortices. bioRxiv, 580597, doi:10.1101/580597 (2019).
22 Avants, B. B., Tustison, N. & Song, G. Advanced normalization tools (ANTS). Insight j 2, 1-35 (2009).
23 Pierpaoli, C. et al. in 18th Scientific Meeting of the International Society for Magnetic Resonance in Medicine. 1597.
Figures
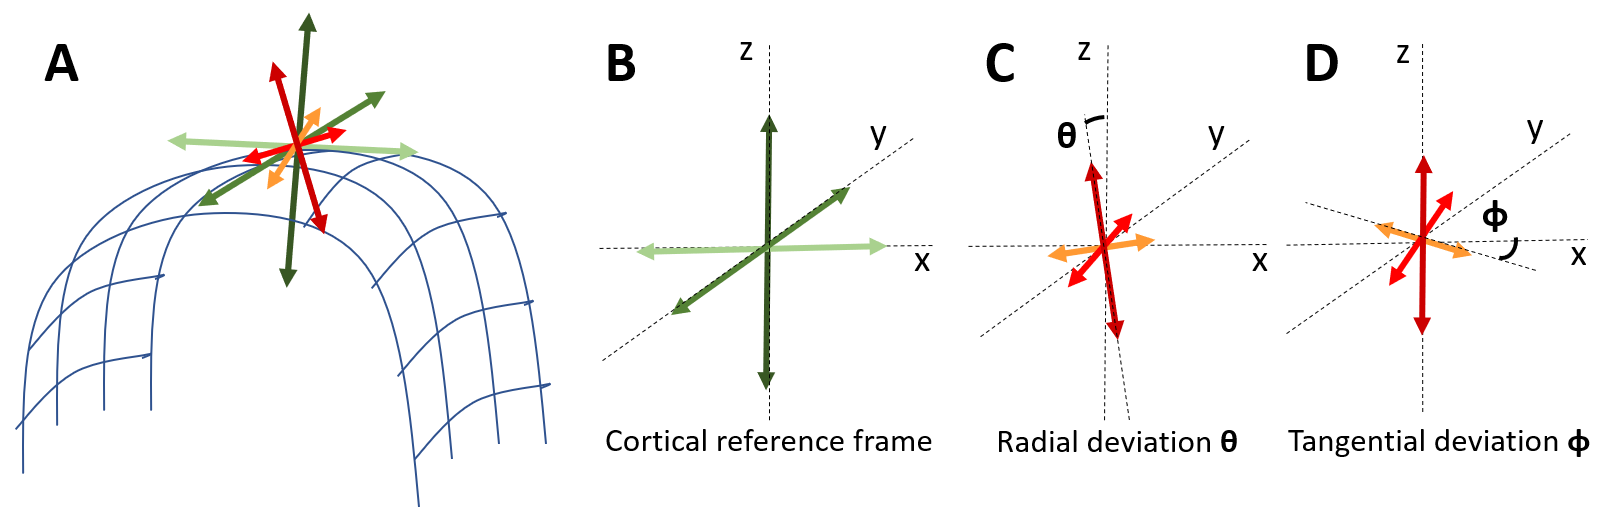
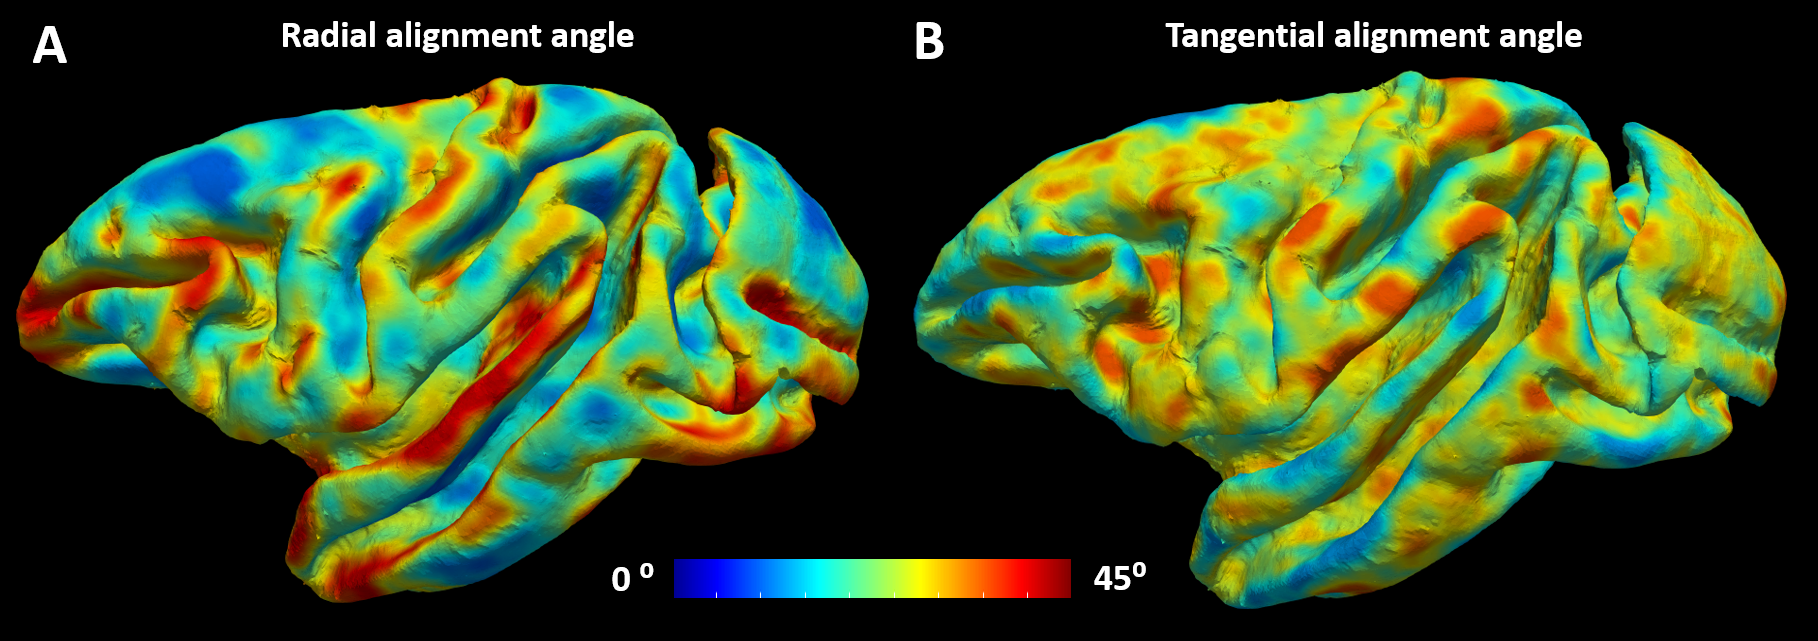
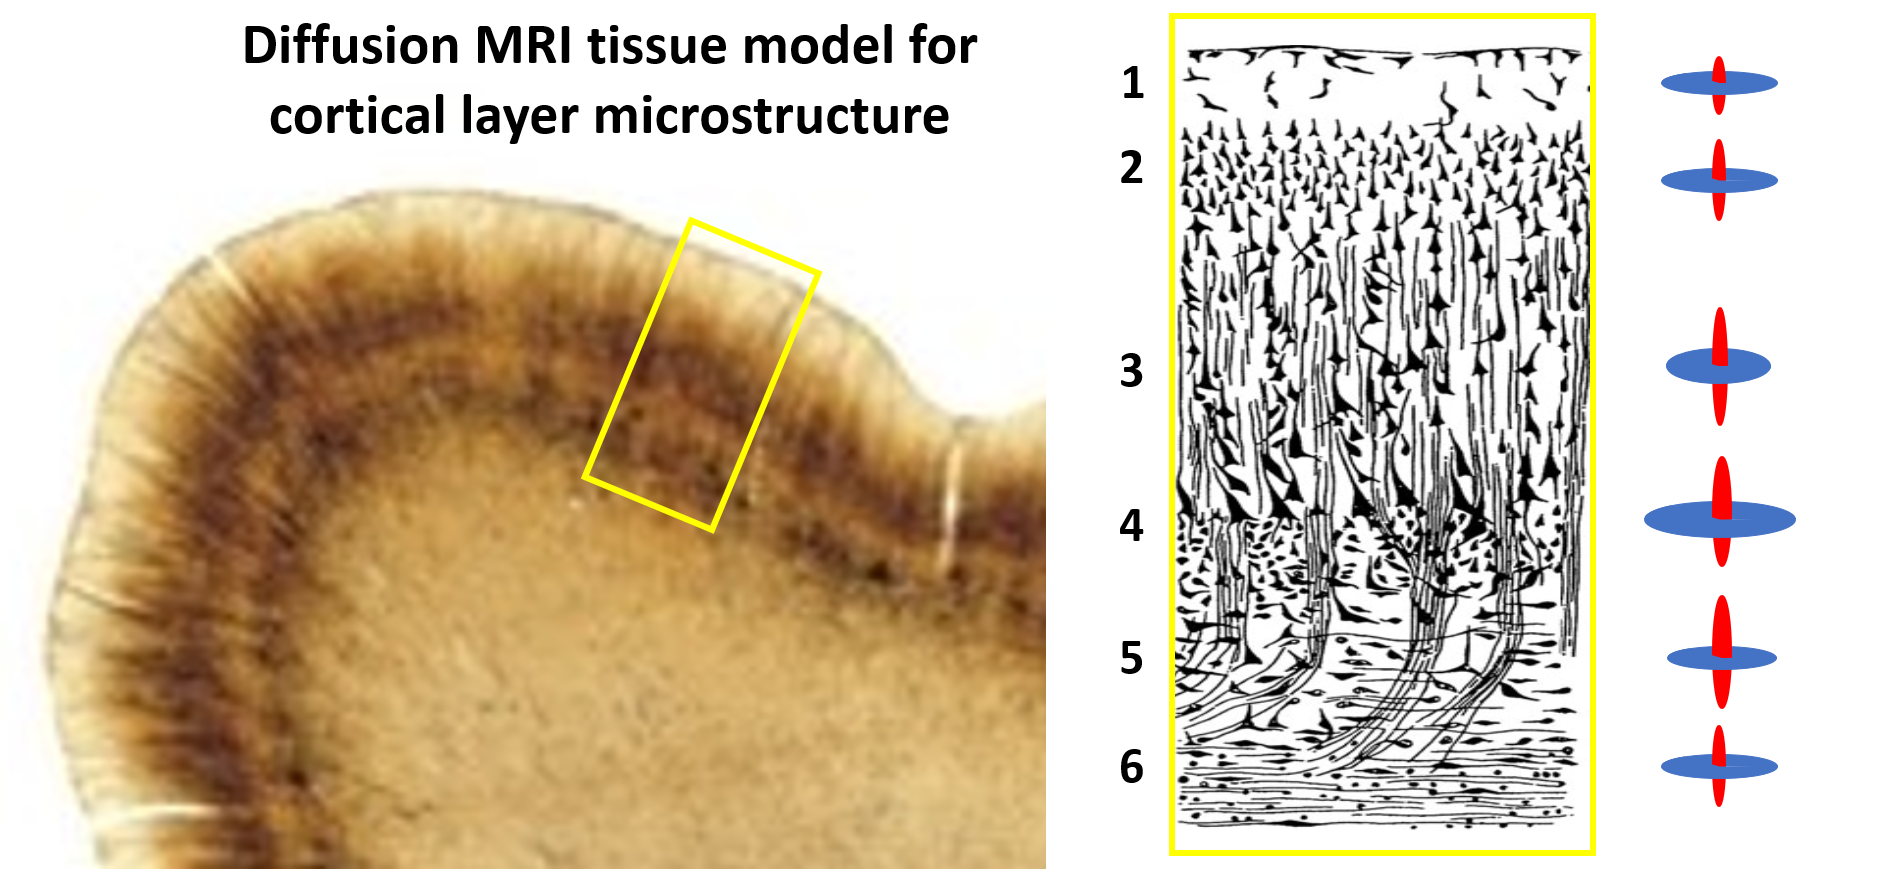
Figure 3: Tissue model for cyto and myelo-architecture in the macaque cerebral cortex. Histology section showing the lamination in the motor cortex (left). Schematic of the cortical laminar architecture (middle). The diffusion signal in cortical layers is decomposed into radial (red) and tangential (blue) components defined with respect to the CRF (right) and described using a “stick-and-disk” model with parameters: f-signal fraction, Dr and Dt radial and tangential scalar diffusivities.