0712
The impact of axon orientation dispersion and 3D diameter variations on the transverse apparent diffusion coefficient1Department of Applied Mathematics and Computer Science, Technical University of Denmark, Kgs. Lyngby, Denmark, 2Danish Research Centre for Magnetic Resonance, Hvidovre, Denmark, 3Ecole Polytechnique Fédérale de Lausanne, Lausanne, Switzerland, 4The European Synchrotron, Grenoble, France, 5Department of Medical Radiation Physics, Clinical Science, Lund University, Lund, Sweden, 6Radiology Department, Centre Hospitalier Universitaire Vaudois and University of Lausanne, Lausanne, Switzerland
Synopsis
We extract the orientation dispersion (OD) and 3D axon diameter variations of long axons (>100 µm) from an ultra-high resolution, synchrotron X-ray nano-holotomography (XNH) scan of the monkey splenium. From this, we discover a relationship between mean axon diameter and along-axon diameter variations. Monte Carlo simulations are then performed on the intra-axonal spaces (IAS) of different substrates which inherit their morphological features from the segmented axons. These simulations show that the OD significantly affects the transverse apparent diffusion coefficient (ADC⟂) of the axon substrate at diffusion times up to 50 ms, while diameter variations do not.
Introduction
Diffusion magnetic resonance imaging (MRI) provides non-invasive 3D insight into live brain microstructure. By modelling tissue architecture with biophysical models, mean axon diameters and axon diameter distributions (ADD) can be estimated. These parameters are indicative of the performance of white matter, since axon diameter is proportional to axonal conduction speed 1. The biophysical models e.g. ActiveAx 2,3 and AxCaliber 4, commonly represent axons as parallel cylinders. Although diffusion MRI captures general trends in axon diameter, it overestimates when compared to histological methods 2,5 : 2D ADDs from light- 6 or electron microscopy 7. Sources of overestimation may include axonal dispersion, MRI hardware limitations 3 and the inaccurate representation of axons as cylinders. We and other groups have shown that individual axons exhibit varying diameters in 3D 8–10. It is also shown that periodic beading affects the transverse apparent diffusion coefficient (ADC⟂) of axons 11. However, the effect of anatomically realistic axon diameter variations on the ADC⟂ of the intra-axonal space (IAS), compared to the constant-diameter case, has not previously been investigated. Here, we isolate the 3D axonal diameter variations and orientation dispersion (OD) of 54 long (>100 µm) axons from the monkey splenium. To investigate how the OD and axon diameter variations affect the ADC⟂ of the IAS, we perform Monte Carlo simulations within the IAS of three substrates of varying anatomical complexity (Figure 3).Methods
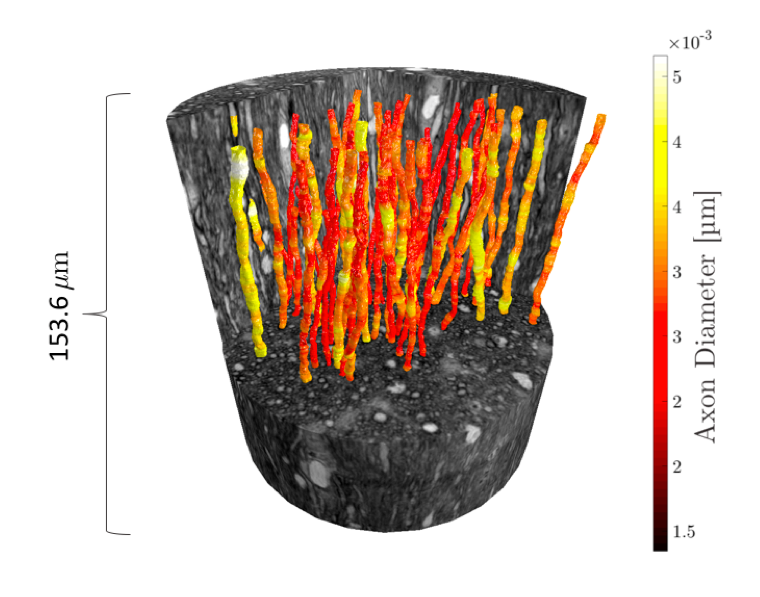
The axons range between 2-4 µm in mean diameter and originate from the splenium of a 32-month old, female, perfusion fixated monkey brain, previously studied with ActiveAx 2. The image volumes are obtained from synchrotron X-ray nano-holotomography (XNH) at the European Synchrotron, beamline ID16A, with an isotropic voxel size of 75 nm3. The processing, imaging and segmentation of the axons is described in 8.Axon Segmentation Analysis
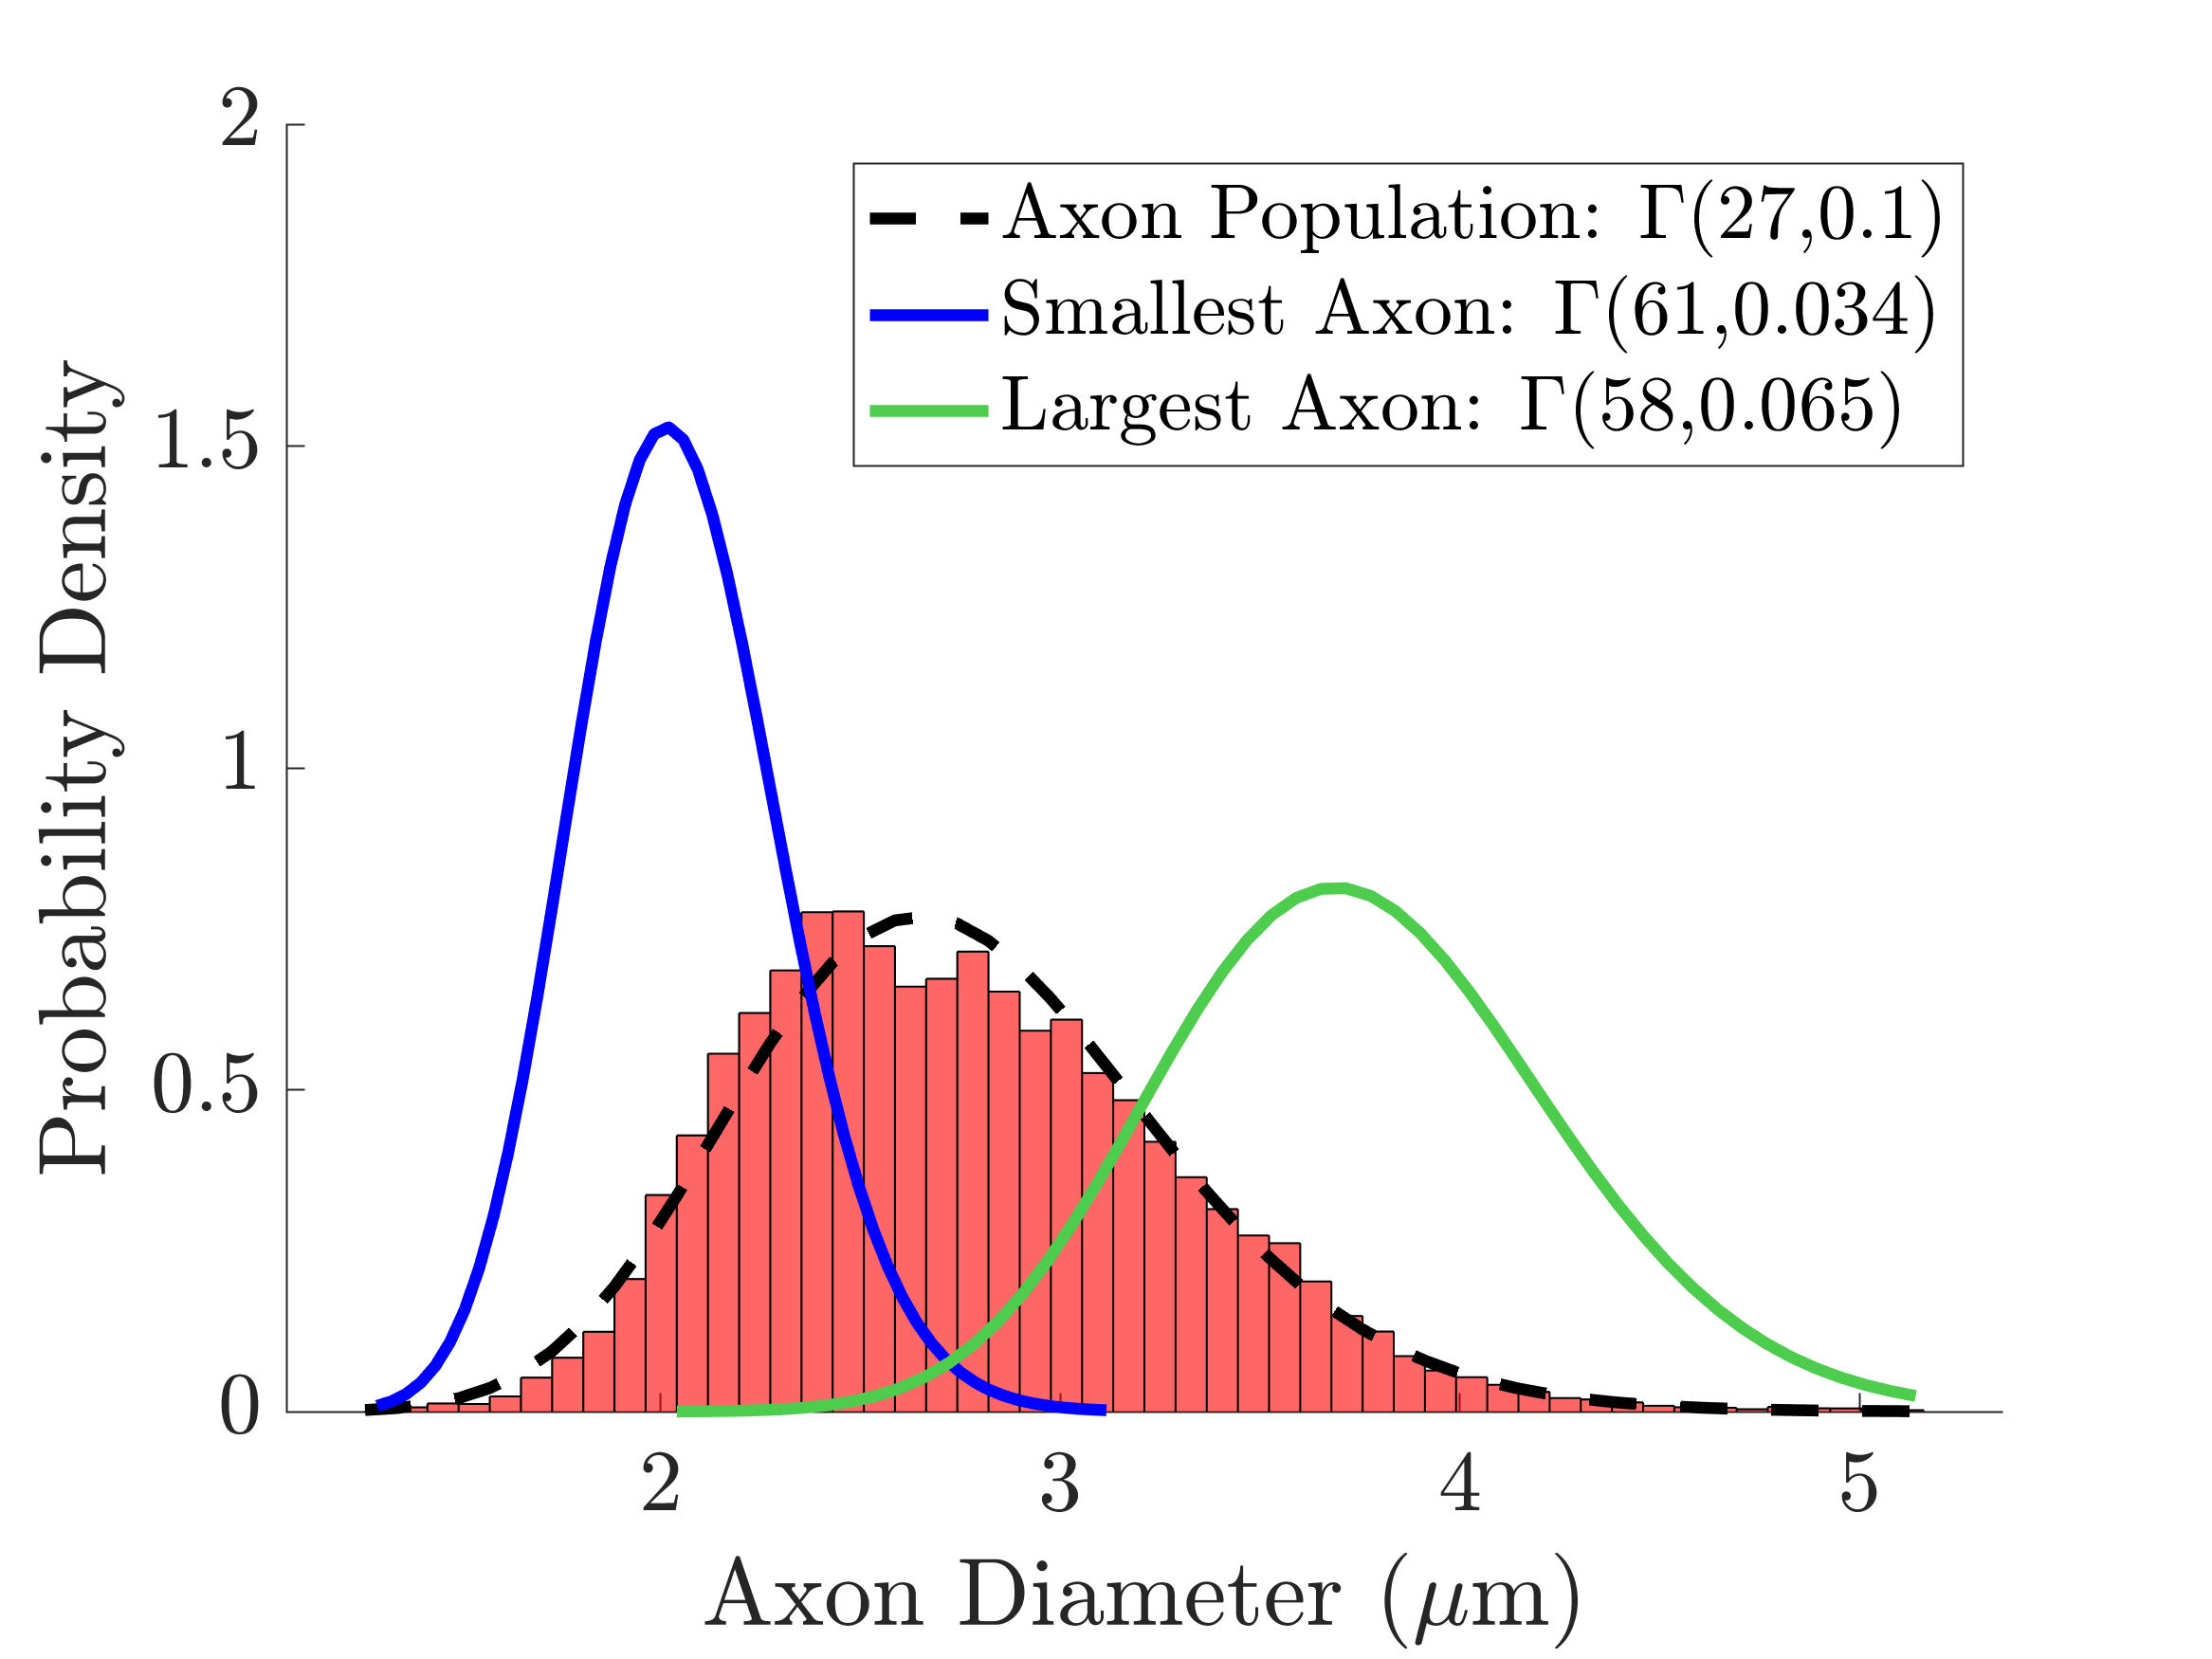
The equivalent diameters of axons were quantified every 150 nm along the axon trajectories, perpendicular to the local axon trajectory. The combined histogram over all encountered diameters within the volume is termed the “combined 3D ADD”. The main direction of each axon was calculated based on its centreline.
Monte Carlo Simulations
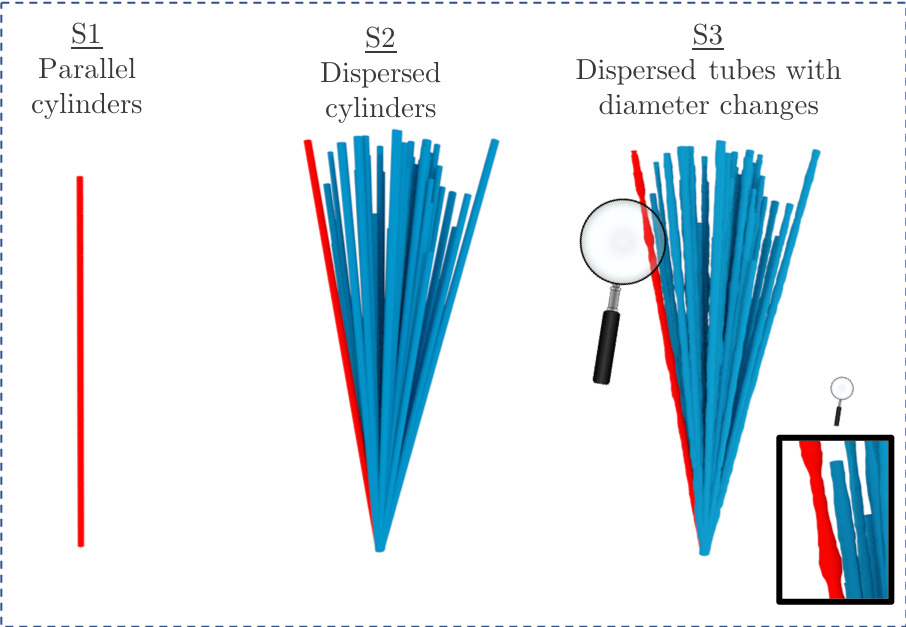
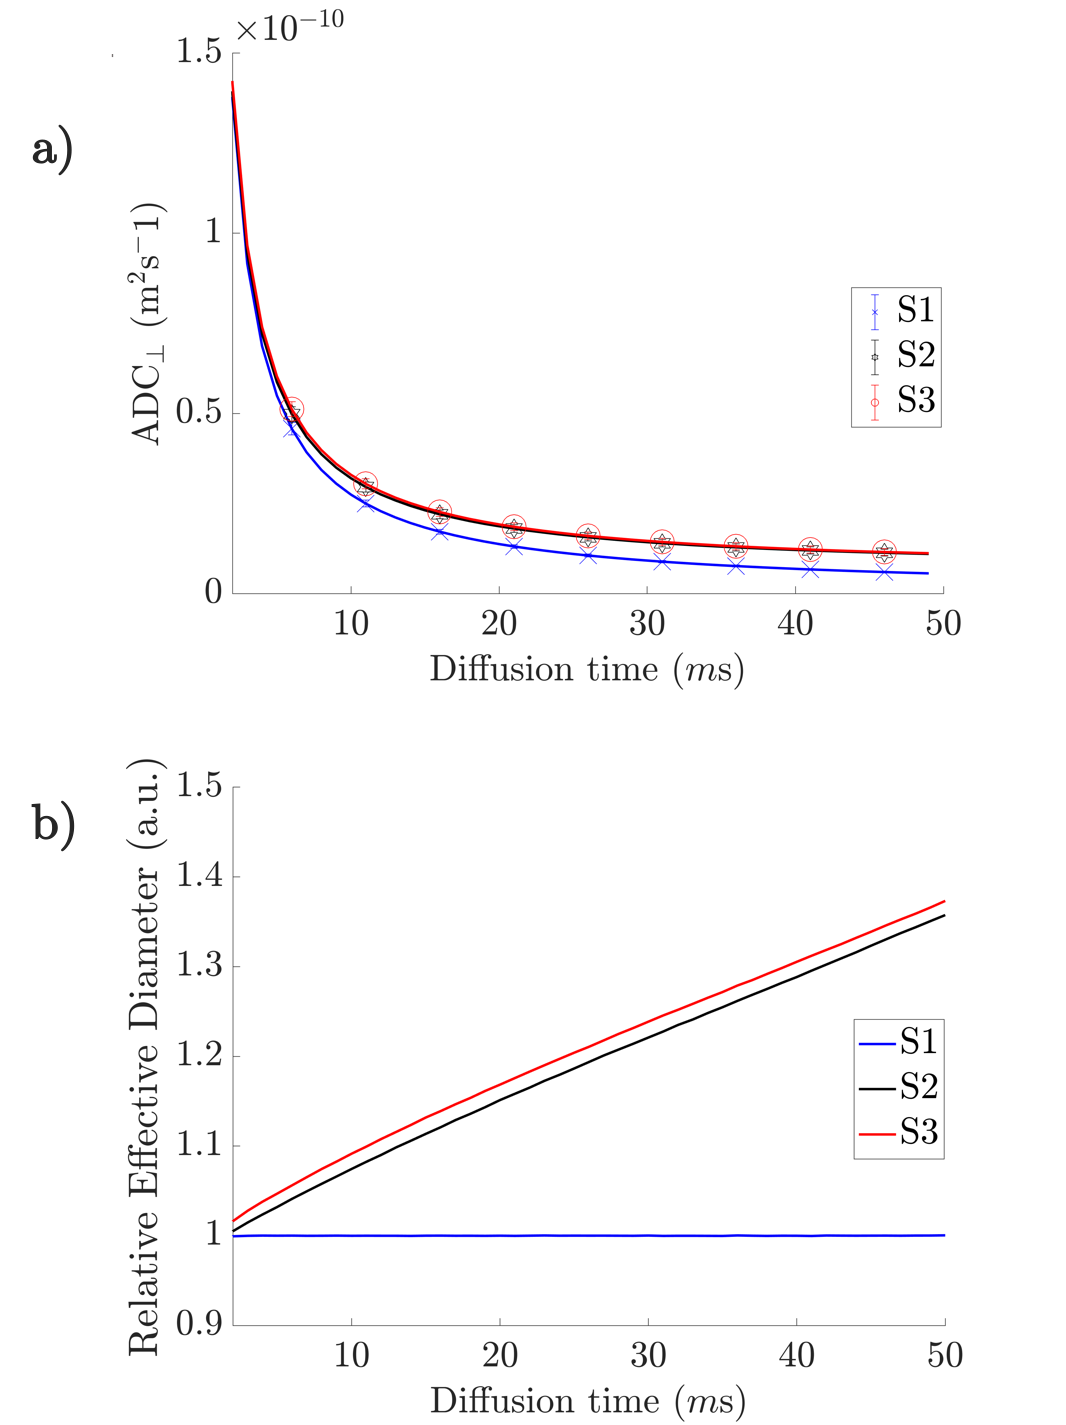
Three substrates (S) were generated for simulations (as in Figure 3): S1) 54 parallel cylinders, S2) 54 cylinders with orientation dispersion and S3) 54 tubes with OD and diameter changes. The average axon diameters, OD and diameter changes present in the substrates matched the corresponding measurements in each of the 54 XNH-segmented axons. An in-house Monte Carlo simulator 12 was used to simulate diffusion within the intra-axonal space of each axon separately. Each simulation employed an intrinsic diffusivity of $$$ 0.6 \cdot 10^{-9}$$$ m$$$^2$$$/s, $$$2 \cdot 10^5$$$ spins and $$$1 \cdot 10^{-5}$$$ seconds per time step. The diffusion propagators transverse to the main axis of the substrate were recorded at diffusion times between 1-50 ms at intervals of 1 ms. From these, ADC⟂ was calculated from the Einstein relation:
$$\lambda^2_\bot = 2 \cdot \text{ADC}_{\bot} \cdot D_t$$
where $$$\lambda^2_\bot$$$ is the root-mean-square displacement in the transverse direction and $$$D_t$$$ is the diffusion time. The average ADC⟂ of the substrates were calculated by weighting the axonal ADC⟂ values by axon volume 2. Furthermore, the effective axon diameter, D, (assuming a cylindrical geometry) was calculated according to 13:
$$\lambda^2_\bot =\frac{1}{2} (\frac{D}{2})^2$$
Results and Discussion
The segmented axons exhibited significant diameter changes, as in Figure 1. The combined 3D ADD is shown in Figure 2, as well as the individual 3D ADDs of the axons with smallest and largest mean diameters within the dataset. In general, contrary to the suggestion we made in 8, we find that the 3D ADDs of axons with large mean diameters are wider than those of their smaller counterparts. Simulation of the three substrates of varying complexity (Figure 3) show that the OD introduced in S2 significantly changes the value of the time-dependent ADC⟂ compared to the parallel, cylindrical case in S1. However, the inclusion of diameter variations in S3 does not significantly alter the value of the ADC⟂ or relative effective diameter compared to S2 (Figures 4a-b). Thus, although axon diameter varies considerably along the axonal trajectory, this variation does not significantly change the ADC⟂ within the diffusion times studied here. The parallel ADC, on the other hand, is significantly affected (results not shown). For even longer diffusion times, it is possible that diameter variations will affect the transverse ADC⟂.Conclusion
The analysis of high resolution, 3D axonal geometries increases our understanding of axonal morphology and has implications for microstructure estimations with diffusion MRI. In this dataset, we find a positive correlation between mean axon diameter and the 3D axon diameter variation. This should be considered when constructing white matter phantoms or analysing individual axons based on 2D measurements. For diffusion times up to 50 ms, we find that the OD of axons has a significant, time-dependent effect on the ADC⟂ and effective axon diameter estimates of axon substrates. On the other hand, including diameter variations does not significantly affect the substrate ADC⟂. For accurate estimates of axon diameter, it therefore seems more important to remove effects arising from OD than to account for a 3D variation in axon diameters.Acknowledgements
MA, HMK were supported by the Capital Region Research Foundation (grant number: A5657) (PI:TD).References
1. Hursh, J. B. Conduction Velocity And Diameter Of Nerve Fibres. American Journal of Physiology-Legacy Content. 1939; 127:131–139.
2. Alexander, D. C. et al. Orientationally invariant indices of axon diameter and density from diffusion MRI. Neuroimage. 2010; 52:1374–1389.
3. Dyrby, T. B., Søgaard, L. V., Hall, M. G., Ptito, M. & Alexander, D. C. Contrast and stability of the axon diameter index from microstructure imaging with diffusion MRI. Magn. Reson. Med. 2013; 70:711–721.
4. Assaf, Y., Blumenfeld-Katzir, T., Yovel, Y. & Basser, P. J. AxCaliber: a method for measuring axon diameter distribution from diffusion MRI. Magn. Reson. Med. 2008; 59:1347–1354.
5. Barazany, D., Basser, P. J. & Assaf, Y. In vivo measurement of axon diameter distribution in the corpus callosum of rat brain. Brain. 2009; 132:1210–1220.
6. Caminiti, R., Ghaziri, H., Galuske, R., Hof, P. R. & Innocenti, G. M. Evolution amplified processing with temporally dispersed slow neuronal connectivity in primates. Proceedings of the National Academy of Sciences. 2009; 106:19551–19556.
7. Aboitiz, F., Scheibel, a. B., Fisher, R. S. & Zaidel, E. Fiber composition of the human corpus callosum. Brain Res. 1992; 598:143–153.
8. Andersson M, Kjer HM, Rafael-Patino J, Andersen Dahl V, Pacureanu A, Thiran JP, Bech M, Bjorholm Dahl A, and Dyrby T. Uncovering 3D Axonal Morphologies with Synchrotron Imaging: Impact on Microstructure Imaging with Diffusion MRI. International Society for Magnetic Resonance in Medicine 27th Annual Meeting. 2019.
9. Abdollahzadeh, A., Belevich, I., Jokitalo, E., Tohka, J. & Sierra, A. Automated 3D Axonal Morphometry of White Matter. Sci Rep. 2019; 9:6084.
10. Lee, H.-H. et al. Along-axon diameter variation and axonal orientation dispersion revealed with 3D electron microscopy: implications for quantifying brain white matter microstructure with histology and diffusion MRI. Brain Struct. Funct. 2019; 224:1469–1488.
11. Lee H-H, Fieremans E, and Novikov D. Exploring the effect of varying axonal shape on the transverse diffusion inside EM-reconstructed axons using 3d Monte Carlo simulations. International Society for Magnetic Resonance in Medicine 27th Annual Meeting. 2019.
12. Rafael-Patino, J. et al. Robust Monte-Carlo Simulations in Diffusion-MRI: Effect of the substrate complexity and parameter choice on the reproducibility of results. arXiv [physics.med-ph]. 2019.
13. Vangelderen, P., Despres, D., Vanzijl, P. C. M. & Moonen, C. T. W. Evaluation of Restricted Diffusion in Cylinders. Phosphocreatine in Rabbit Leg Muscle. J. Magn. Reson. B. 1994; 103:255–260.
Figures