0710
Relaxed-VERDICT: decoupling relaxation and diffusion for comprehensive microstructure characterization of prostate cancer.1Centre for Medical Image Computing, Department of Computer Science, University College London, London, United Kingdom, 2Centre for Medical Imaging, University College London, London, United Kingdom
Synopsis
This work presents a comprehensive VERDICT prostate model (relaxed-VERDICT) that includes compartment-specific relaxation effects providing prostate microstructural estimates unbiased by the relaxation properties of the tissue. We compare relaxed-VERDICT with the original VERDICT model and use it to provide estimates of T2 and T1 in benign and tumor prostate tissue. Our results suggest that original VERDICT’s fic contrast is mostly driven by diffusion, supporting its use as imaging marker of apparent cellular volume fraction. Relaxed-VERDICT estimates of T1/T2 values are in very good agreement with literature. Finally, we propose a machine learning based processing pipeline that provides ultra-fast quantitative maps.
Introduction
Prostate cancer (PCa) diagnosis requires transrectal biopsy, which is invasive and prone to error. VERDICT1,2 is a non-invasive imaging technique that exploits properties of endogenous water to infer cancer microstructure through diffusion-weighted MRI (dMRI). Specifically for prostate, VERDICT is based on a biophysical model of three non-exchanging compartments allowing estimation of intracellular (fic), extracellular-extravascular (fees) and vascular (fvasc) volume fractions, and cell size2.Despite the simple description of the biological tissue, VERDICT has shown promising results in clinical settings, discriminating normal from malignant tissue2 and identifying specific Gleason grades3. However, the original formulation2 does not account for potential compartmental differences in T2 relaxation. Thus, the signal fractions fic, fees, fvasc are effectively T2-weighted.
This work presents a VERDICT prostate model that includes compartment-specific T1/T2 relaxation to provide estimates unbiased by relaxation properties. We compare the new with the original model and provide estimates of T2 and T1 in benign and tumor prostate tissue. We also propose a machine learning (ML) based processing pipeline that provides ultra-fast quantitative maps.
Methods
VERDICT. The total MR signal for the VERDICT model is2:$$S(b) = f_{vasc}S_{vasc}(D_{vasc}=8, b)+f_{ic}S_{ic}(D_{ic}=2, R, b)+f_{ees}S_{ees}(D_{ees}=2, b)[1]$$
where fi=vasc,ic,ees are proportions of signal without diffusion-weighting (details in1,2), diffusivities in μm2/ms. Three model parameters are estimated by data fitting: fees, fic, R. The $$$f_{vasc}=1-f_{ic}-f_{ees}$$$, and a cellularity index $$$\zeta=f_{ic}/R^3$$$. A recent variant also estimates Dees4.
Relaxed-VERDICT. Similar to5,6, we use transverse MR relaxation to identify the T2 components and disentangle the cellular, luminal and vascular compartment contributions to the dMRI signal. For the ic compartment we consider fast T2~1-100 ms according to7. The other two compartments have slow T2: ees has T2~150-800 ms7 and vasc has T2~100-250 ms (oxygenated/deoxygenated blood8). Because of this overlap we consider only one slow T2vasc/ees~100-500 ms. We also consider monoexponential T1 relaxation, with expected T1~2944±765 ms9,10. Mathematically, the proposed extended VERDICT model is:
$$S(b,TE,TR) = S_0(1-e^{-TR/T1})[f^0_{vasc}e^{-TE/T2_{vasc/ees}}S_{vasc}(D_{vasc}=8, b)+f^0_{ic}e^{-TE/T2_{ic}}S_{ic}(D_{ic}=2, R, b)+$$
$$+f^0_{ees}e^{-TE/T2_{vasc/ees}}S_{ees}(D_{ees}, b)][2]$$
where f0i=vasc,ic,ees are signal fractions now unbiased by relaxation properties and $$$f^0_{vasc}+f^0_{ic}+f^0_{ees}=1$$$, diffusivities in μm2/ms. We estimate eight parameters: S0, T1, T2ic, T2vasc/ees, f0ees, f0ic, R, Dees by data fitting.
dMRI acquisition. Five men with PCa were imaged as part of the INNOVATE clinical trial11. All patients underwent biopsy, multiparametric‐MRI12 and VERDICT-MRI on a 3T scanner (Achieva, Philips). VERDICT-MRI acquired five b‐values (0.090-3 ms/μm2), five TE (50-90 ms) and TR values (2482-3945 ms), voxel size 1.3×1.3×5 mm and matrix size 176×176 (further details in4).
Data processing. We denoise the raw dMRI using MP-PCA13,14, and correct for Gibbs ringing15 using custom Matlab code. For motion correction we use a combination of mutual-information rigid and affine registration implemented in Matlab.
Data analysis. We obtain parametric maps from the original VERDICT, extended to also fit Dees as in4, and the proposed relaxed-VERDICT, by fitting Eq.[1] and [2] to the dMRI data. Note that we exploit the TE and TR dependence of the b=0 in each shell for improving the estimation of the T1/T2 relaxation times. We perform the fitting using a ML approach based on random forest regression16-18 implemented in Matlab: #estimators=200, maxdepth=20, cost-function=mean-squared-error, maxfeatures=squared-root. The regressor was trained on 104 and tested on 2x10³ different signals, generated by using Eq.[1] (original VERDICT) and [2] (relaxed-VERDICT) with random values between reasonable intervals: S0=[minIntensity(b=0)/10, maxIntensity(b=0)x10], T1=[10,4000] ms, T2ic=[1,150] ms, T2vasc/ees=[150,800] ms, fees and f0ees=[0.01,0.99], fic and f0ic=[0.01,0.99], R=[0.01,15] μm and Dees=[0.5,3] μm2/ms. We add Rician noise corresponding to signal-to-noise ratio of 35. The ML training (to be done only once) took ~120 seconds; prediction for ~4.3x10⁵ voxels took ~20 seconds, for each subject (4-threads on IntelCorei7 at 2.4GHz).
Region-of-interest (ROI) statistics. We manually define benign and tumor ROIs and compute distributions of parameter estimates to assess statistical differences (paired two-tail t-test).
Results
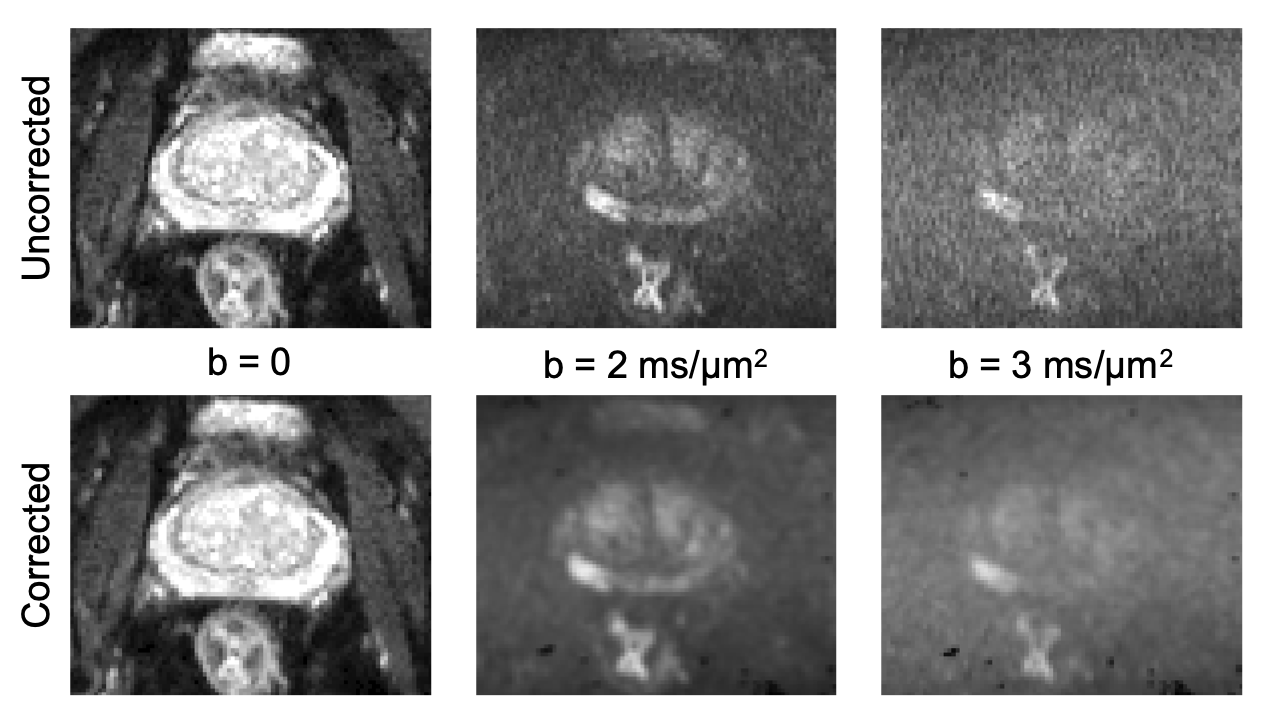
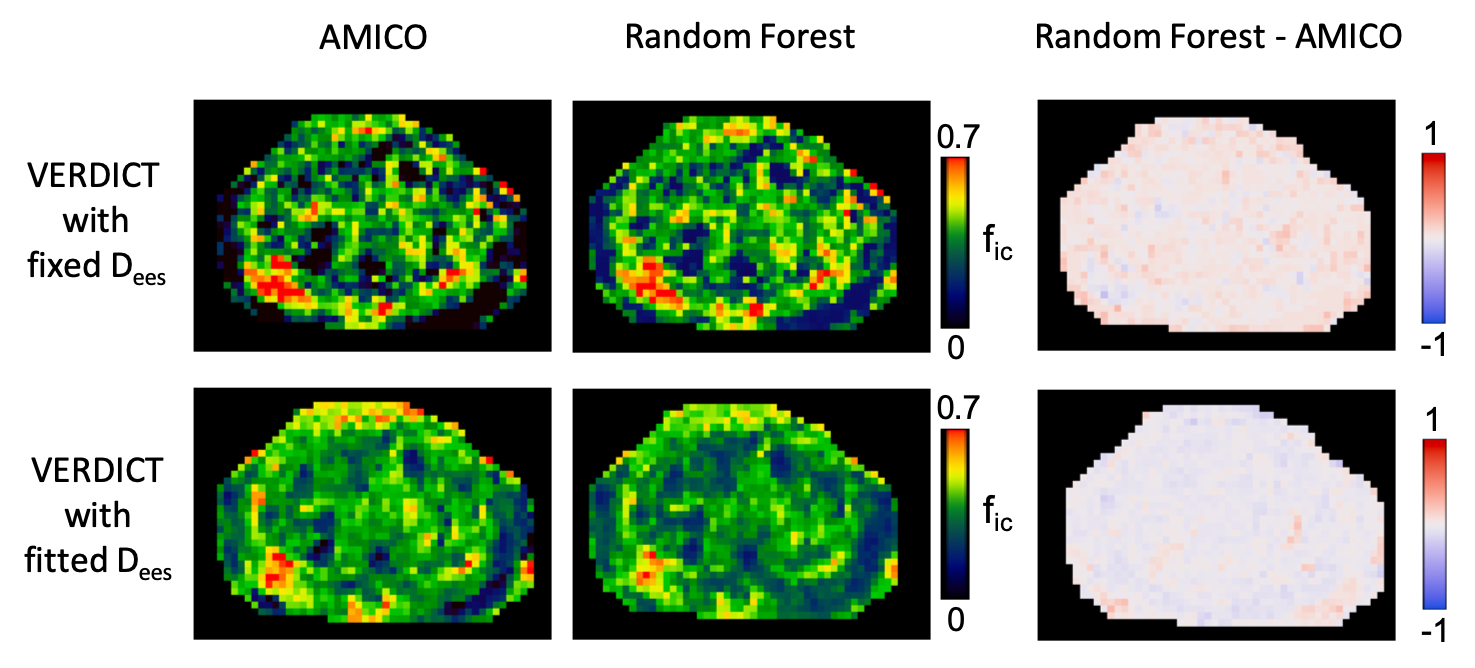
Fig.1 shows an example of data quality after pre-processing.Fig.2 compares the fic estimates from original VERDICT using AMICO4 and the proposed ML. We found that the ML pipeline provides estimates similar to state-of-the-art methods like AMICO4.
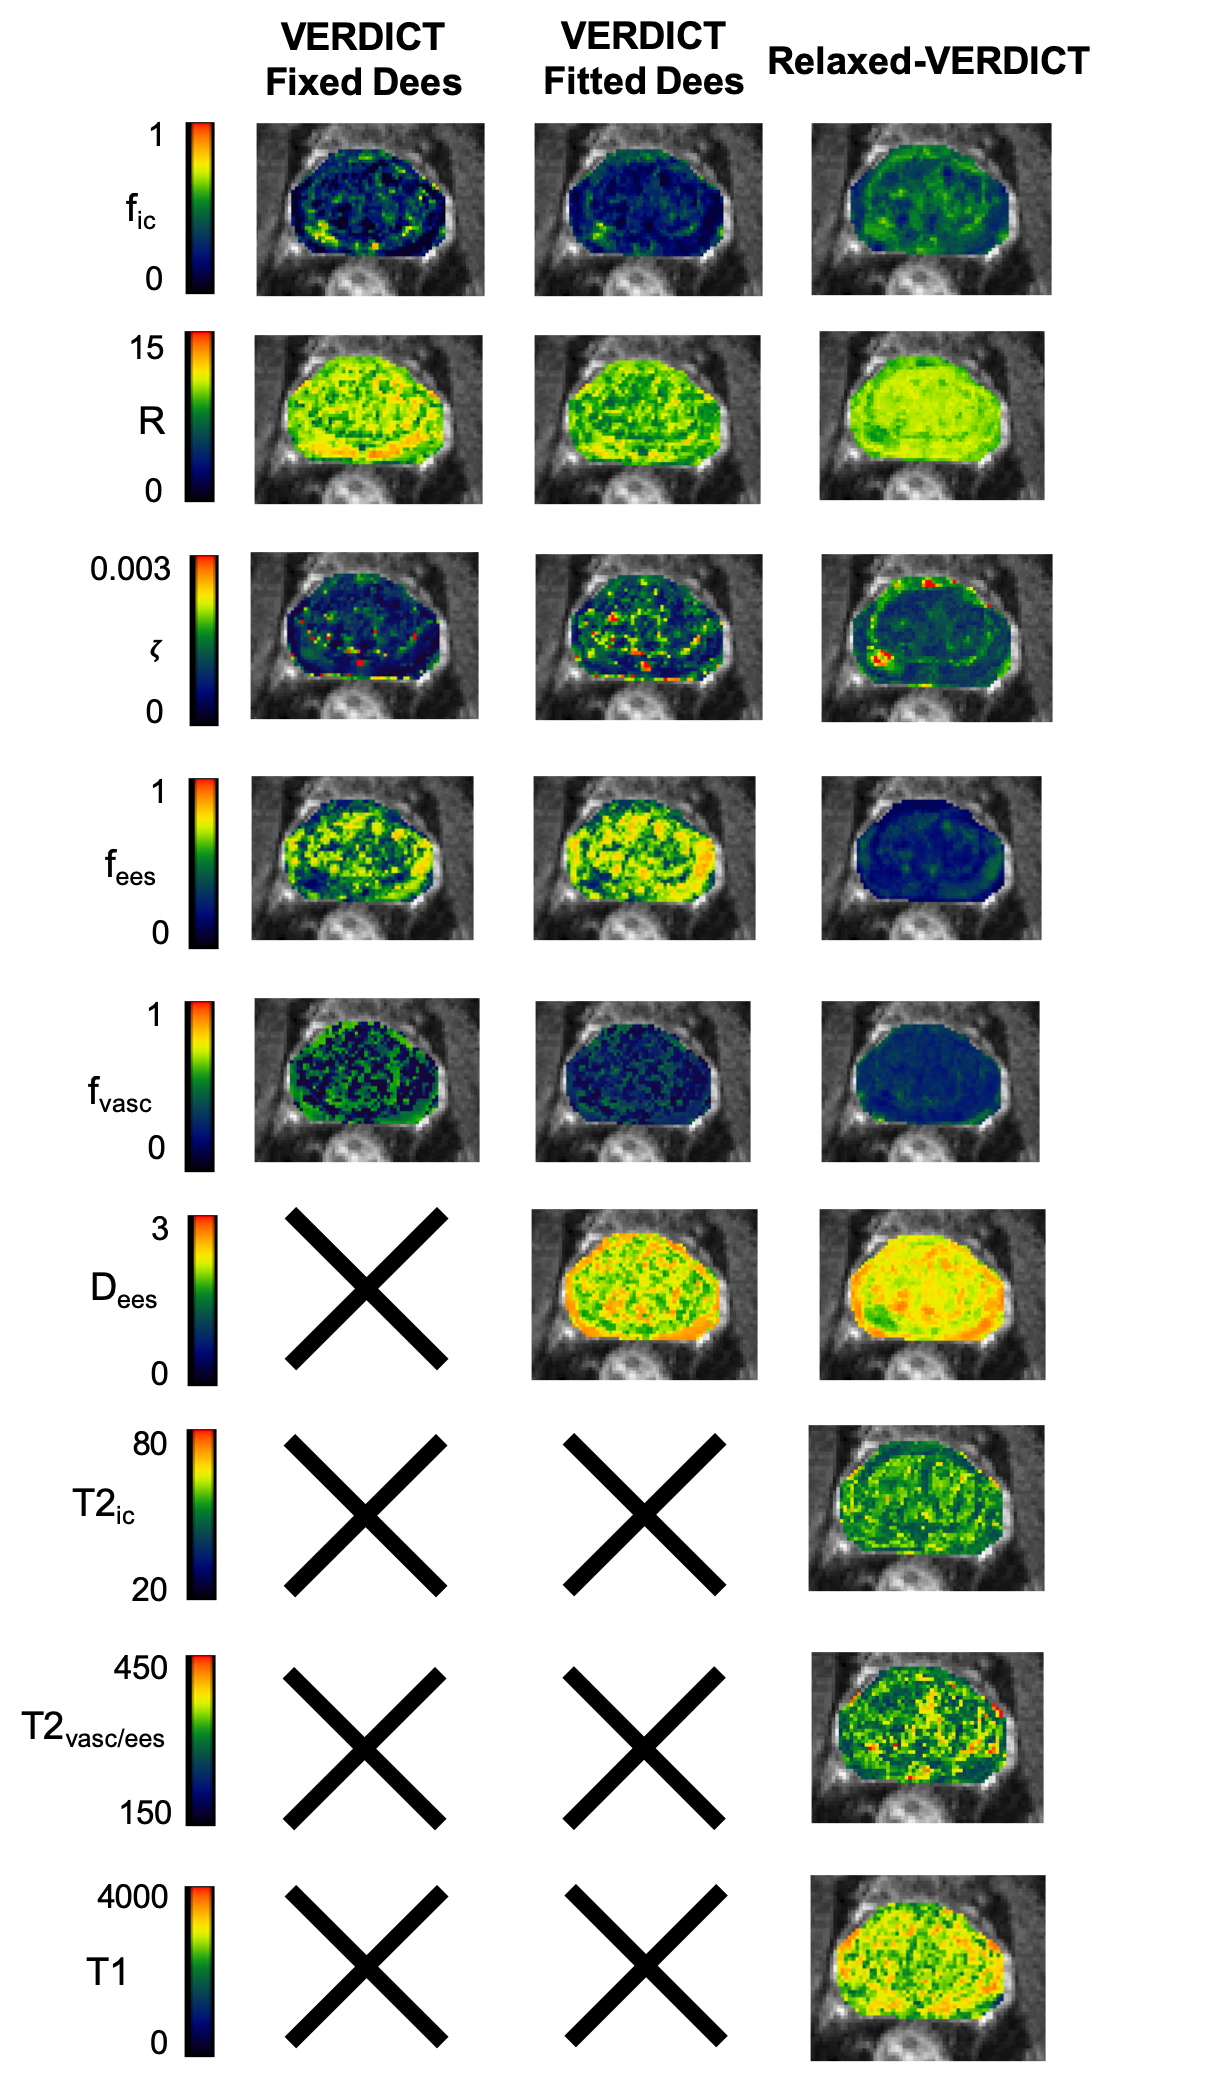
Fig.3 shows comparison of all the parametric maps obtained using original VERDICT with fixed and fitted Dees and relaxed-VERDICT. Overall, we found that conspicuity of relaxed-VERDICT’s f0ic maps in tumor is preserved, showing that fic contrast in original VERDICT is mostly driven by diffusion.
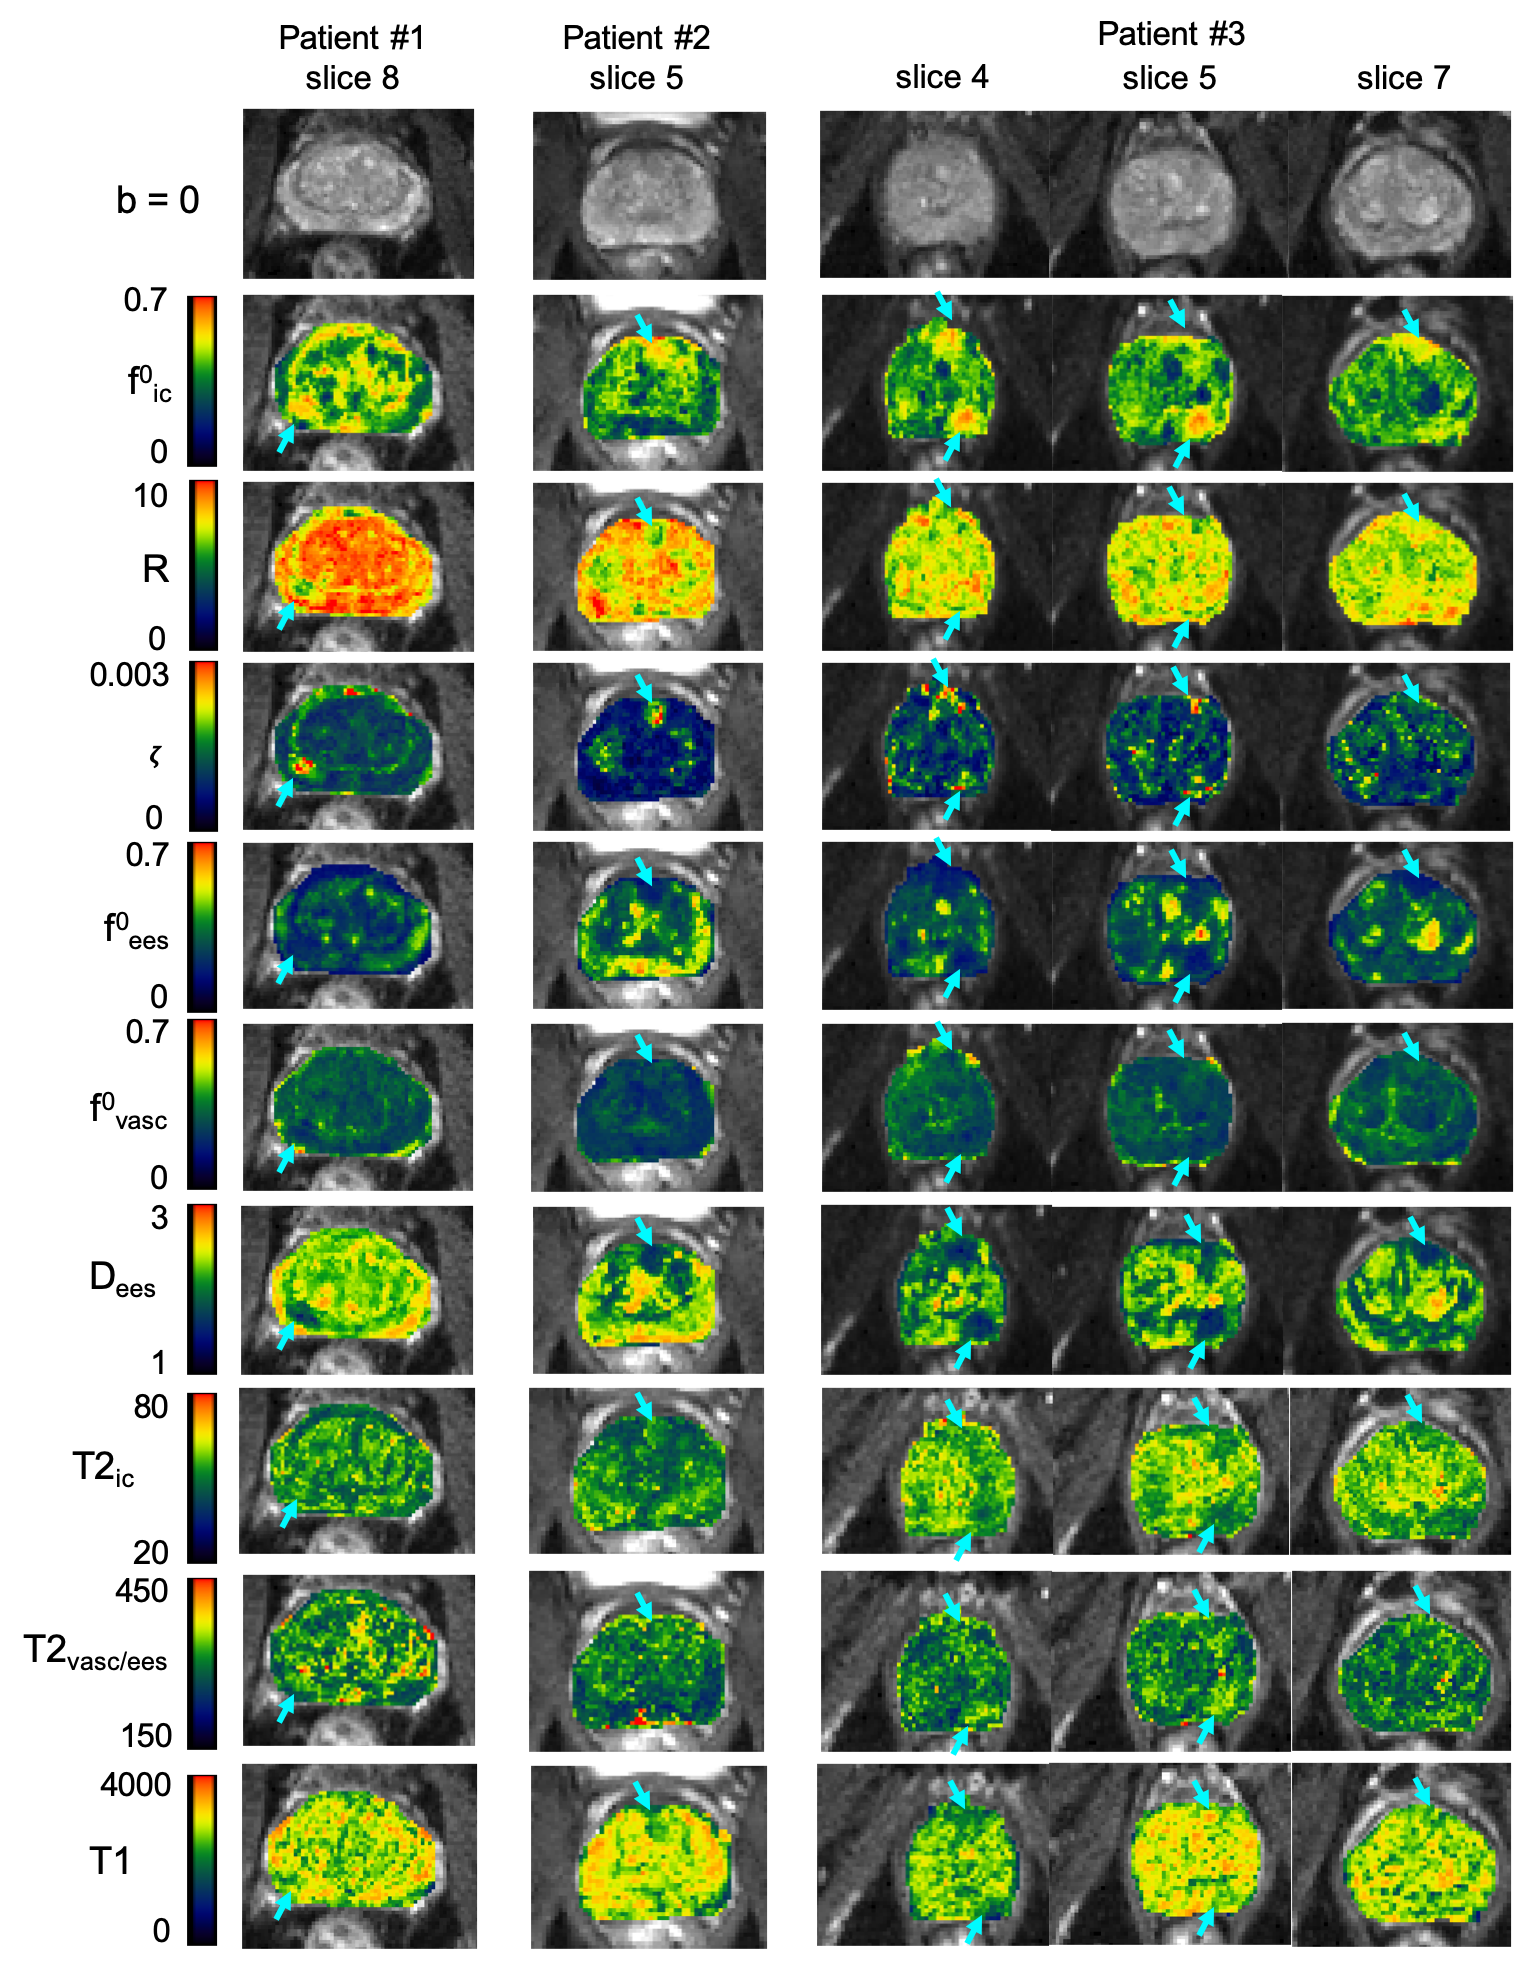
Fig.4 shows quantitative maps of f0ic, R, f0vasc, f0ees, Dees, $$$\zeta$$$ for three patients.
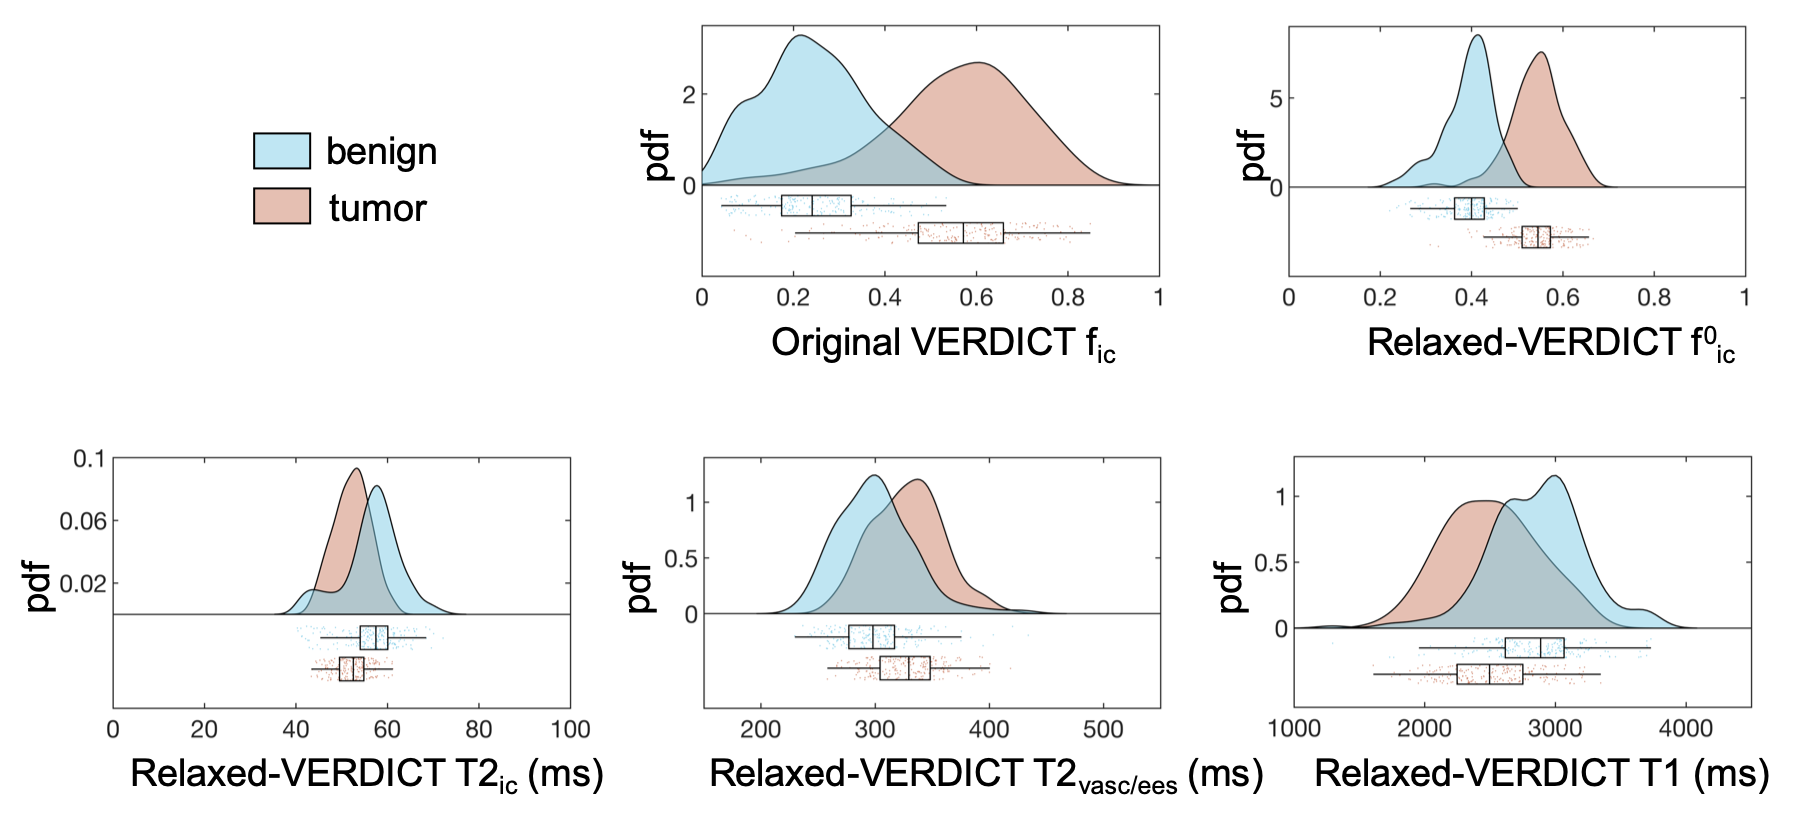
Fig.5 reports ROI based statistics. We found significantly higher fic and f0ic in tumor compared to benign tissue (P<0.001); not significant changes in T2ic, T2vasc/ees and T1. Average relaxation values for benign and tumor were T2ic=58±4 ms and 54±7 ms; T2vasc/ees=300±50 ms and 340±40 ms; T1=2900±400 ms and 2500±520 ms, in agreement with6-10 despite the limited TE range in VERDICT-MRI.
Discussion and Conclusion
This work introduces relaxed-VERDICT for simultaneous quantification of relaxation and diffusion processes in PCa. We showed that relaxed-VERDICT provides reasonable maps of T1/T2 relaxation times, together with relaxation-unbiased VERDICT metrics. Comparison with original VERDICT showed conserved conspicuity of fic, suggesting that its contrast is predominantly driven by diffusion, and supporting its use as imaging marker of apparent cellular volume fraction. Finally, we proposed a ML pipeline for the ultra-fast analysis of dMRI data, enhancing the use of VERDICT and more complex relaxed-VERDICT in clinical settings.Acknowledgements
This project has received funding from Engineering and Physical Sciences Research Council (EPSRC EP/N021967/1, EP/N018702/1); Prostate Cancer UK Targeted Call 2014: Translational Research St.2, project reference PG14-018-TR2; the NIHR UCLH Biomedical Research Centre; Grant 510419 from the UCLH Biomedical Research Centre.References
1. Panagiotaki E, et al. (2014) Noninvasive Quantification of Solid Tumor Microstructure Using VERDICT MRI. Cancer Res 74(7):1902-1912.
2. Panagiotaki E, et al. (2015) Microstructural Characterization of Normal and Malignant Human Prostate Tissue With Vascular, Extracellular, and Restricted Diffusion for Cytometry in Tumours Magnetic Resonance Imaging. Invest Radiol 50(4):218-227.
3. Brizmohun M, et al. (2018) The intracellular component of VERDICT (Vascular, Extracellular, and Restricted Diffusion for Cytometry in Tumors) MRI distinguishes Gleason 4 pattern better than Apparent Diffusion Coefficient. Joint Annual Meeting ISMRM-ESMRMB 2018.
4. Bonet-Carne E, et al. (2019) VERDICT-AMICO: Ultrafast fitting algorithm for non-invasive prostate microstructure characterization. Nmr Biomed 32(1).
5. Veraart J, Novikov DS, & Fieremans E (2018) TE dependent Diffusion Imaging (TEdDI) distinguishes between compartmental T2 relaxation times. Neuroimage 182:360-369.
6. Lemberskiy G, et al. (2018) Characterization of prostate microstructure using water diffusion and NMR relaxation. Front Phys 6.
7. Storas TH, Gjesdal KI, Gadmar OB, Geitung JT, & Klow NE (2008) Prostate magnetic resonance imaging: multiexponential T2 decay in prostate tissue. J Magn Reson Imaging 28(5):1166-1172.
8. Grgac K, Li W, Huang A, Qin Q, & van Zijl PC (2017) Transverse water relaxation in whole blood and erythrocytes at 3T, 7T, 9.4T, 11.7T and 16.4T; determination of intracellular hemoglobin and extracellular albumin relaxivities. Magn Reson Imaging 38:234-249.
9. Storaas T & Gjesdal KI (2012) Assessment of biexponential T1 decay in prostate tissue. ISMRM 20th Scientific Meeting & Exhibition.
10. Kjaer L, Thomsen C, Iversen P, & Henriksen O (1987) In vivo estimation of relaxation processes in benign hyperplasia and carcinoma of the prostate gland by magnetic resonance imaging. Magn Reson Imaging5(1):23-30.
11. Johnston E, et al. (2016) INNOVATE: A prospective cohort study combining serum and urinary biomarkers with novel diffusion-weighted magnetic resonance imaging for the prediction and characterization of prostate cancer. BMC Cancer 16(1):816.
12. Barentsz JO, et al. (2012) ESUR prostate MR guidelines 2012. Eur Radiol 22(4):746-757.
13. Veraart J, Fieremans E, & Novikov DS (2016) Diffusion MRI noise mapping using random matrix theory. Magn Reson Med 76(5):1582-1593.
14. Tournier JD, et al. (2019) MRtrix3: A fast, flexible and open software framework for medical image processing and visualisation. Neuroimage 202:116137.
15. Kellner E, Dhital B, Kiselev VG, & Reisert M (2016) Gibbs-ringing artifact removal based on local subvoxel-shifts. Magn Reson Med 76(5):1574-1581.
16. Nedjati-Gilani GL, et al. (2017) Machine learning based compartment models with permeability for white matter microstructure imaging. Neuroimage 150:119-135.
17. Hill I, et al. (2019) Machine learning based white matter models with permeability: An experimental study in cuprizone treated in-vivo mouse model of axonal demyelination. arXiv preprint.
18. Palombo M, et al. (2019) SANDI: a compartment-based model for non-invasive apparent soma and neurite imaging by diffusion MRI. arXiv preprint.
Figures