0708
Improved characterization of prostate tumors through multi-compartmental analysis of restriction spectrum imaging data1Department of Radiology, UC San Diego School of Medicine, La Jolla, CA, United States, 2Department of Radiation Medicine and Applied Science, UC San Diego School of Medicine, La Jolla, CA, United States, 3Department of Neurosciences, UC San Diego School of Medicine, La Jolla, CA, United States
Synopsis
Restriction spectrum imaging (RSI) is an advanced multi-shell diffusion technique that models the diffusion-weighted signal as a linear combination of exponential decays. While RSI shows promise for assessing prostate cancer, an optimal RSI model that effectively characterizes the diffusion properties of both normal and cancerous prostate tissue is essential to ensuring an accurate evaluation of prostate cancer lesions. In this study, we determined optimal ADC values for several RSI models of the prostate and assessed the number of tissue compartments required to best describe diffusion in both normal and cancerous prostate tissue.
Motivation
Diffusion-weighted imaging (DWI) is commonly used to assess prostate tumors,1 but its utility is limited by conventional analysis techniques that attempt to measure changes in the apparent diffusion coefficient (ADC) of prostate tissue. Expected changes in ADC that accompany cancer are often confounded by edema or necrosis,2 and may not be detectable from ADC maps alone.3Restriction spectrum imaging (RSI) is an advanced multi-shell diffusion technique that acquires data at higher b-values than for standard-of-care DWI. RSI models the diffusion-weighted signal as a linear combination of exponential decays.4 The individual decay-curves correspond to different tissue compartments, each with a fixed ADC. Variation in diffusion signal between voxels is therefore interpreted as a variation in the proportion of each tissue compartment comprising the total diffusion signal. While RSI shows promise for assessing prostate cancer,5,6 an optimal RSI model that effectively characterizes the diffusion properties of both normal and cancerous prostate tissue is essential to ensuring an accurate evaluation of prostate cancer lesions.
In this study, we determined optimal ADC values for several RSI models of the prostate and assessed the number of tissue compartments required to best describe diffusion in both normal and cancerous prostate tissue. The clinical utility of RSI analysis was then examined by comparing the conspicuity of prostate-cancer lesions on optimized RSI images versus their conspicuity on conventional ADC and kurtosis7 images.
Methods
This retrospective study included 36 patients who underwent MRI examination for suspected prostate cancer. Standard-of-care evaluation determined that 13 of these patients had cancerous lesions in the prostate, while the remaining 23 had no detectable cancer.MRI data acquisition
All MR imaging was performed on a 3T scanner (Discovery MR750, GE Healthcare). A multi-shell DWI volume was acquired for each subject that sampled 5 b-values (0, 200, 1000, 2000, and 3000 s/mm2) at 6 unique diffusion-encoding gradient directions (TR: 5000ms, TE: 80ms, resolution: 1.7×1.7mm, matrix: 128×128, slice thickness: 3mm). For anatomical reference, high resolution T2-weighted volumes were acquired with scan-coverage identical to that of the multi-shell DWI volume (TE: 100ms, TR: 6225ms, resolution: 0.43×0.43mm, matrix: 512×512, slice thickness: 3mm).
MRI data post-processing
Post-processing and analysis of MRI data were performed using custom programs written in MATLAB (MathWorks, Inc). The multi-shell DWI volumes were first corrected for distortions due to B0-inhomogeneity, gradient nonlinearity, and eddy currents.8 ADC and kurtosis maps were computed for each patient by fitting the signal-vs-b-value curve from each voxel with the appropriate exponential decay formula.7 For patients without cancer, ROIs were defined over the entire prostate. For patients with prostate cancer, ROIs were defined over the tumor in agreement with standard-of-care clinical contouring.
RSI modeling
The RSI model is defined by the following formula:
$$S(b)=\sum_{i}^{N}C_{i}e^{-bD_i}$$
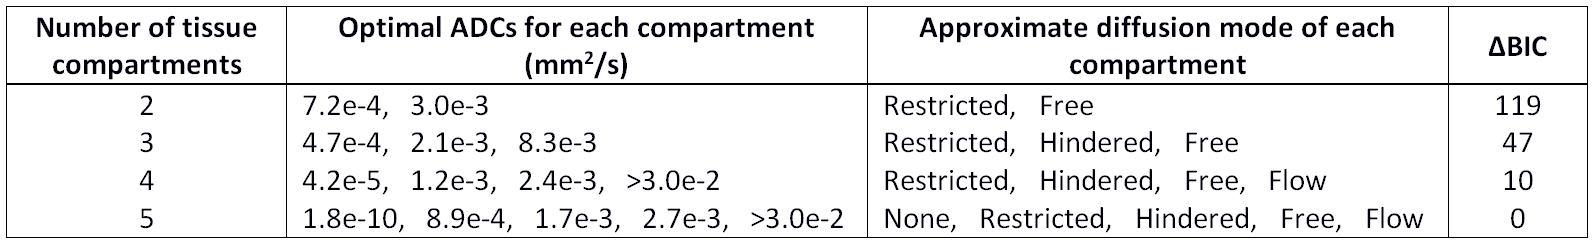
where S(b) denotes the DWI signal at a particular b value, N is the number of tissue compartments, Ci is a unit-less weighting factor describing the contribution of a particular compartment to the overall signal, and Di is the compartmental ADC. This model was fit to the multi-shell DWI data from all voxels within all ROIs (normal+cancer tissue), with the number of compartments ranging from 2 to 5. Model fitting was performed using a simplex search method9 with non-negativity constraints and returned the optimal Di values for each compartment of the model. The relative Bayesian Information Criterion10 (ΔBIC) of each model was used to evaluate how well it described the prostate DWI data.
Once optimal Di values were determined for the multi-compartmental RSI models, tissue-contribution (Ci) maps were computed for each patient via least-squares fitting of the RSI model to the signal-vs-b-value curve from each voxel.
Prostate-cancer lesion conspicuity
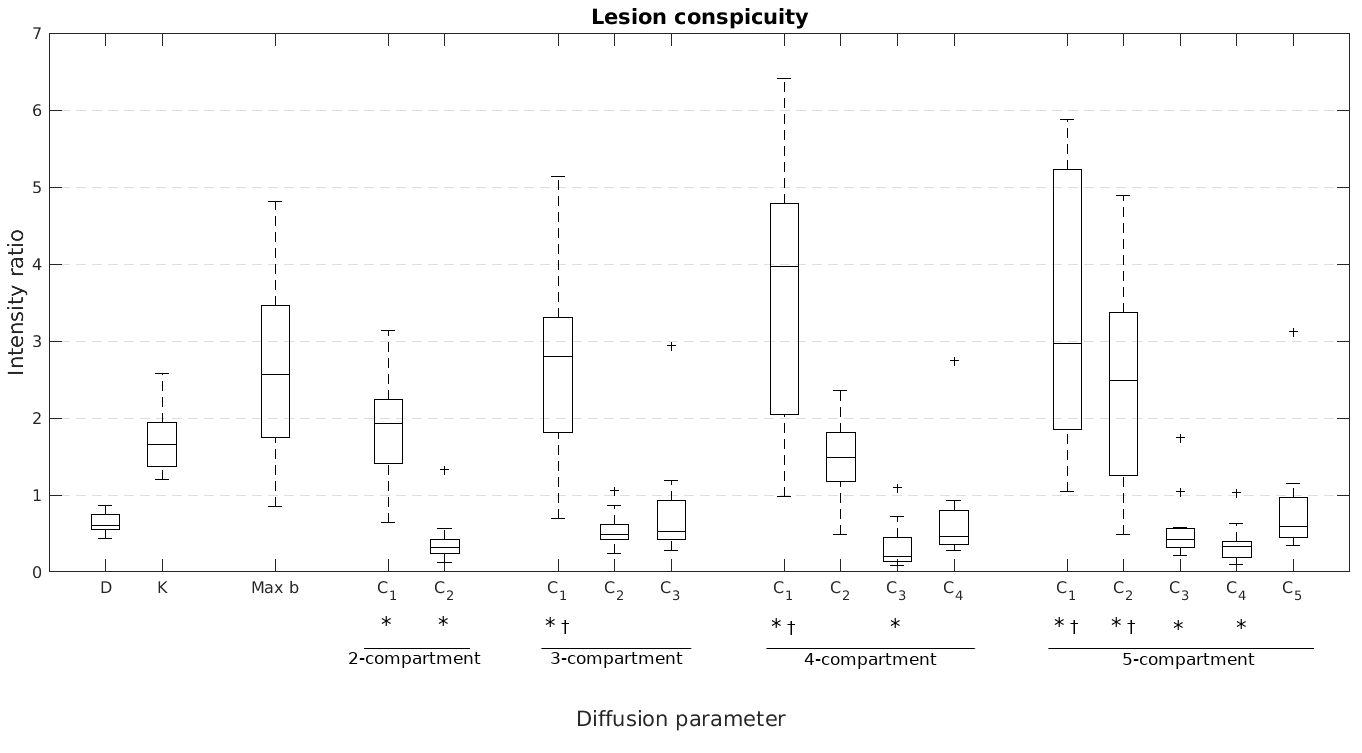
Lesion conspicuity was defined as the mean signal intensity within the tumor ROI divided by the mean signal intensity within the entire prostate. It was calculated for each patient using the ADC, kurtosis, and RSI Ci maps. Paired t-tests (α=0.01) were used to determine if lesion conspicuity was significantly better on RSI Ci maps compared to ADC or kurtosis maps.
Results
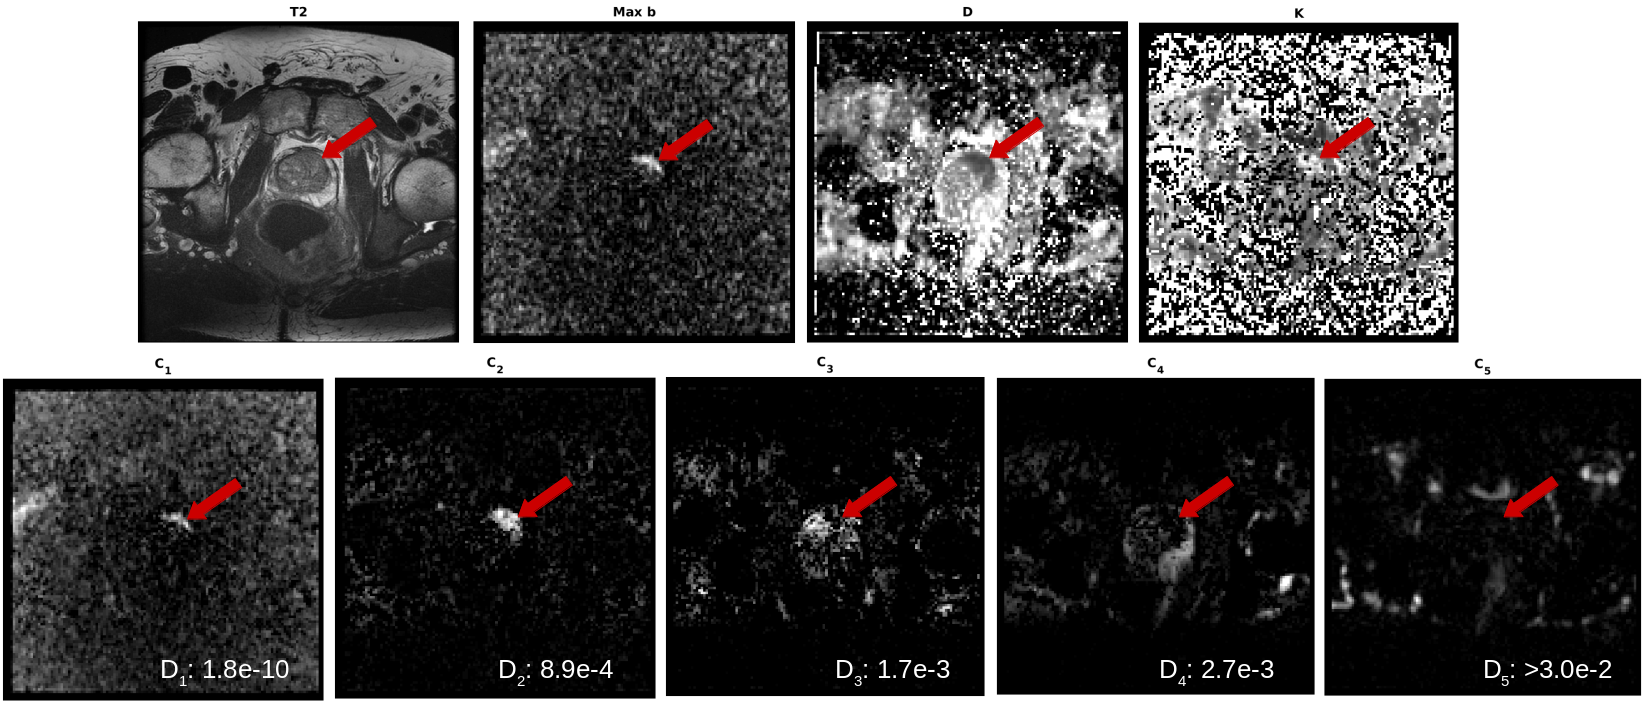
Optimal ADC values for the different RSI models are listed in Table 1. The lowest ΔBIC was observed from the 5-compartment model, with ADCs corresponding roughly to negligible, restricted, hindered, free, and fast/pseudo (IVIM11) diffusion. Ci maps from the 5-compartment model are shown in Figure 1 for a prostate-cancer lesion alongside conventional prostate images. Figure 2 illustrates the significant (p<0.01) improvement in lesion conspicuity afforded by RSI modeling compared to conventional ADC or kurtosis methods.Discussion
Prevailing methods for assessing prostate cancer with DWI assume that the diffusion properties of the prostate can be adequately modeled using no more than two compartments.12 However, this study suggests that higher-order models are necessary for comprehensive characterization of diffusion in the prostate. Analyzing DWI data with such a higher-order model, like the 5-compartment RSI approach described here, leads to improved tumor conspicuity compared to conventional ADC or kurtosis models.Acknowledgements
This research was supported by funding from the following sources:
USAMR DoD W81XWH-17-1-0618
NIH K08 NIBIB EB026503
Prostate Cancer Foundation
References
1. J. C. Weinreb et al., “PI-RADS Prostate Imaging – Reporting and Data System: 2015, Version 2,” Eur. Urol., vol. 69, no. 1, pp. 16–40, Jan. 2016.
2. N. S. White, C. R. McDonald, N. Farid, J. M. Kuperman, S. Kesari, and A. M. Dale, “Improved Conspicuity and Delineation of High-Grade Primary and Metastatic Brain Tumors Using ‘Restriction Spectrum Imaging’: Quantitative Comparison with High B-Value DWI and ADC,” Am. J. Neuroradiol., vol. 34, no. 5, pp. 958–964, May 2013.
3. C. M. A. Hoeks et al., “Prostate Cancer: Multiparametric MR Imaging for Detection, Localization, and Staging,” Radiology, vol. 261, no. 1, pp. 46–66, Oct. 2011.
4. N. White, “Diffusion-weighted imaging in cancer: Physical foundations and applications of Restriction Spectrum Imaging.”
5. R. A. Rakow-Penner et al., “Novel technique for characterizing prostate cancer utilizing MRI restriction spectrum imaging: proof of principle and initial clinical experience with extraprostatic extension,” Prostate Cancer Prostatic Dis., vol. 18, no. 1, pp. 81–85, Mar. 2015.
6. K. C. McCammack et al., “Restriction spectrum imaging improves MRI-based prostate cancer detection,” Abdom. Radiol., vol. 41, no. 5, pp. 946–953, May 2016.
7. J. H. Jensen and J. A. Helpern, “MRI quantification of non-Gaussian water diffusion by kurtosis analysis,” NMR Biomed., vol. 23, no. 7, pp. 698–710, 2010.
8. D. Holland, J. M. Kuperman, and A. M. Dale, “Efficient correction of inhomogeneous static magnetic field-induced distortion in Echo Planar Imaging,” NeuroImage, vol. 50, no. 1, pp. 175–183, Mar. 2010.
9. J. C. Lagarias, J. A. Reeds, M. H. Wright, and P. E. Wright, “Convergence Properties of the Nelder--Mead Simplex Method in Low Dimensions,” SIAM J. Optim., vol. 9, no. 1, pp. 112–147, Jan. 1998.
10. G. Schwarz, “Estimating the Dimension of a Model,” Ann. Stat., vol. 6, no. 2, pp. 461–464, Mar. 1978.
11. D. Le Bihan, “What can we see with IVIM MRI?,” NeuroImage, vol. 187, pp. 56–67, Feb. 2019.
12. R. A. Karunamuni et al., “Relationship between kurtosis and bi-exponential characterization of high b-value diffusion-weighted imaging: application to prostate cancer,” Acta Radiol., vol. 59, no. 12, pp. 1523–1529, Dec. 2018.
Figures