0702
Detection of renal PEP-CK activity with hyperpolarized 13C-aspartate1Laboratory for Functional and Metabolic Imaging, Swiss Federal Institute of Technology (EPFL), Lausanne, Switzerland, 2Division of Cardiology, Lausanne University Hospital (CHUV), Lausanne, Switzerland, 3Cardiac MR Center, Lausanne University Hospital (CHUV) and University of Lausanne (UNIL), Lausanne, Switzerland
Synopsis
Renal gluconeogenesis contributes to glucose homeostasis and is elevated in diabetes. Aspartate is an efficient gluconeogenic substrate in the kidney, and its conversion to glucose proceeds via phosphoenolpyruvate carboxykinase (PEP-CK), which is a rate-limiting enzyme. Scanning the kidney of rats infused with hyperpolarized [1-13C]aspartate, the metabolites detected include [1-13C]malate and [4-13C]malate, 3-phospho[1-13C]glycerate, and a trace of bicarbonate. Using [1,4-13C2]aspartate resulted in higher bicarbonate signal, consistent with PEP-CK activity, and bicarbonate was undetectable after inhibiting PEP-CK. Compared to fed rats, the bicarbonate-to-malate ratio was 3-fold higher in fasted rats, indicating the potential of hyperpolarized aspartate to probe renal gluconeogenesis.
Introduction
Gluconeogenesis is a critical metabolic pathway for maintaining normal glucose homeostasis, and its regulation plays an important role in diabetes and the metabolic syndrome. The liver and kidney are the main gluconeogenic organs, and the contribution from the kidney can be as high as 50% under some conditions.1 Phosphoenolpyruvate carboxykinase (PEP-CK) is considered one of the rate-limiting enzymes of gluconeogenesis, and the conversion of hyperpolarized [1-13C]pyruvate to [13C]bicarbonate in the liver has been attributed to PEP-CK activity.2-4 However, pyruvate-to-bicarbonate conversion is not always specific to hepatic PEP-CK activity, which limits its utility in measuring gluconeogenic flux. The amino acid aspartate is a gluconeogenic substrate that is particularly efficient in the kidney,5 and this study tested hyperpolarized [1-13C]aspartate6 and [1,4-13C2]aspartate as specific probes of renal PEP-CK activity.Methods
Dissolution DNP – [1-13C]Aspartic acid and [1,4-13C2]aspartic acid were formulated as the tris salt in water/glycerol with OX063 trityl radical and frozen into 8 µl beads. Samples were polarized in a custom-built 7 T polarizer operating at 1.0 K and polarized by microwave irradiation (50 mW, 196.58 GHz), then dissolved with superheated phosphate-buffered D2O and transferred directly into a phase separator / infusion pump in the horizontal scanner bore.Animals – Wistar rats were anaesthetized with isoflurane and catheters were installed in the femoral arteries for invasive blood pressure measurements and blood sampling and in a femoral vein for infusing the hyperpolarized aspartate. Body temperature was maintained between 37.5 and 38.5 ºC. 1.4 ml of the hyperpolarized aspartate solution was infused as an intravenous bolus, with a dose of ~0.08 mmol/kg. When used, the PEP-CK inhibitor 3-mercaptopicolinic acid (3-MPA) was administered intraperitoneally as a neutralized solution in PBS 1 hour prior to scanning with a dose of 100 mg/kg body weight in 0.5 ml. Fasted rats had their food removed the evening before the experiment for a 12-hour fasting period.
Data acquisition – Rats were scanned in a 9.4T horizontal bore magnet (Magnex) with a VNMRS console (Varian) using a surface coil with two 13C-tuned loops in quadrature and one 1H-tuned loop. The coil was placed over the left kidney and its position verified by 1H imaging. Following the aspartate infusion, a series of 13C pulse-acquire spectra was acquired with a BIR4-30 adiabatic excitation, 8258 points, 20161.3 Hz spectral width, ~3 s repetition time, gated by respiratory motion and pulse.
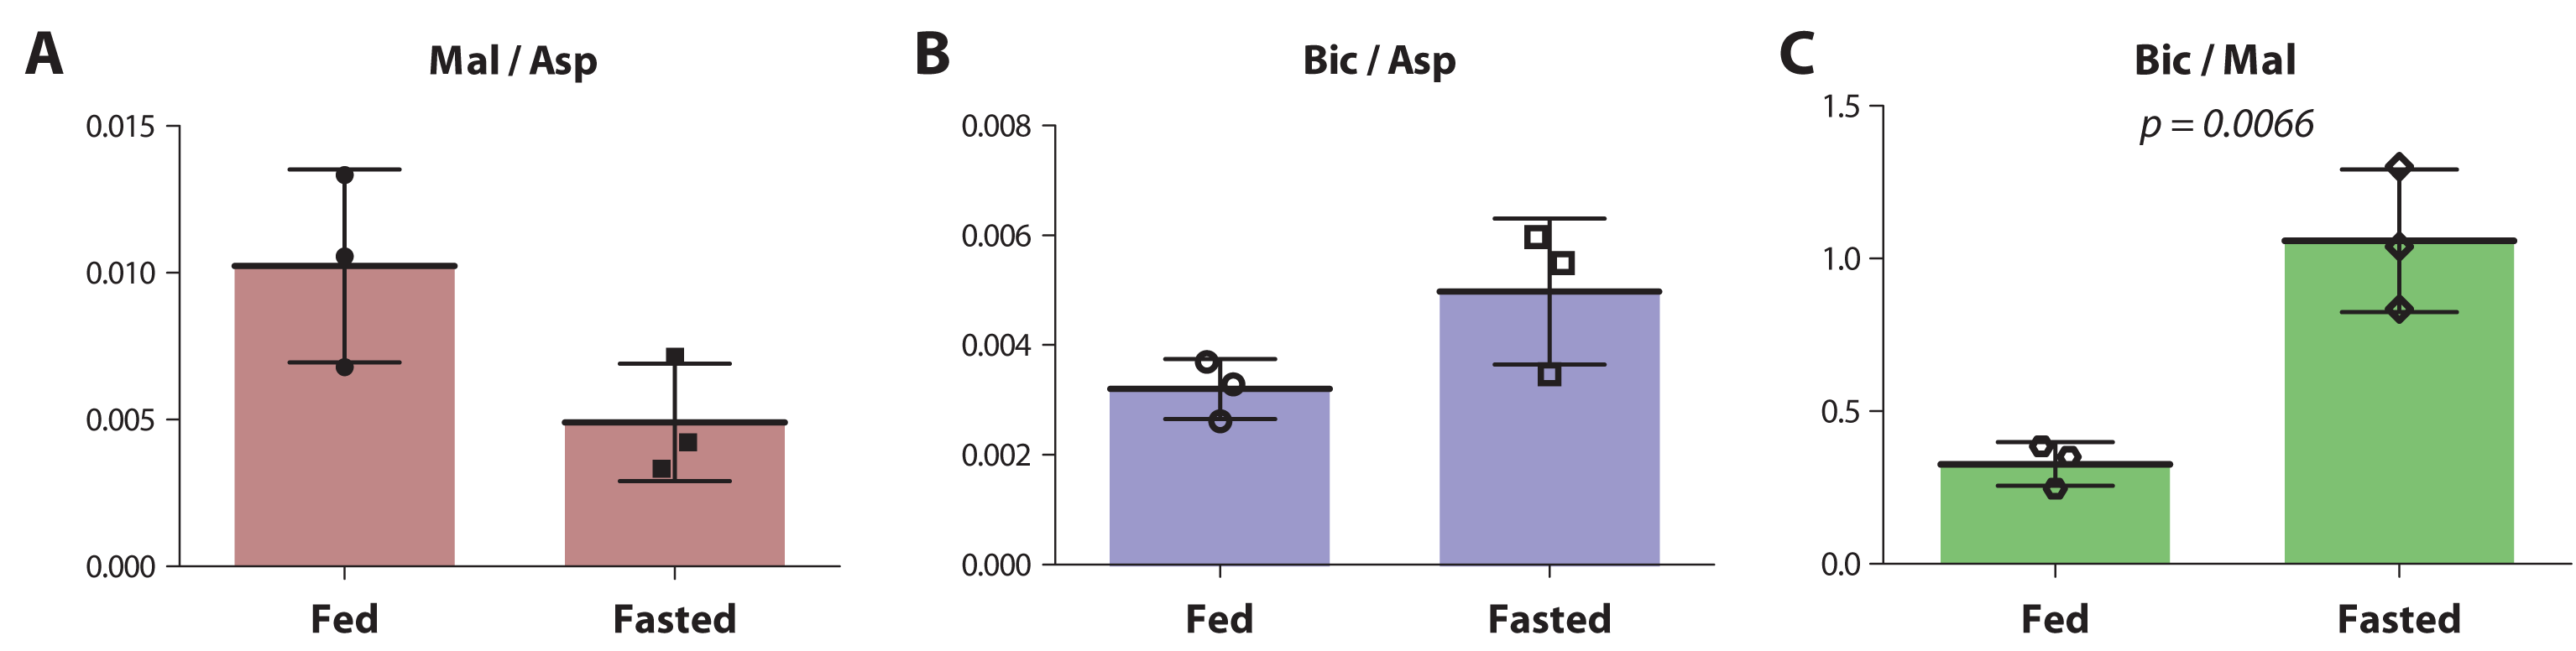
Data analysis – Spectra in the series that contained hyperpolarized signal were summed and the signal amplitudes were fitted using Bayes (Washington University, St. Louis). Chemical shift was referenced to the 1-carbon of aspartate (176.91 ppm, www.hmdb.ca). The malate/aspartate, bicarbonate/aspartate and bicarbonate/malate ratios were calculated using the sum of both the 1- and 4-carbon signals of [1,4-13C2]malate and [1,4-13C2]aspartate. Data are expressed as mean ± standard deviation. Statistical significance was assessed by 2-tailed Student’s t tests. With Bonferroni correction for multiple comparisons, a p value below 0.017 was considered statistically significant.
Results
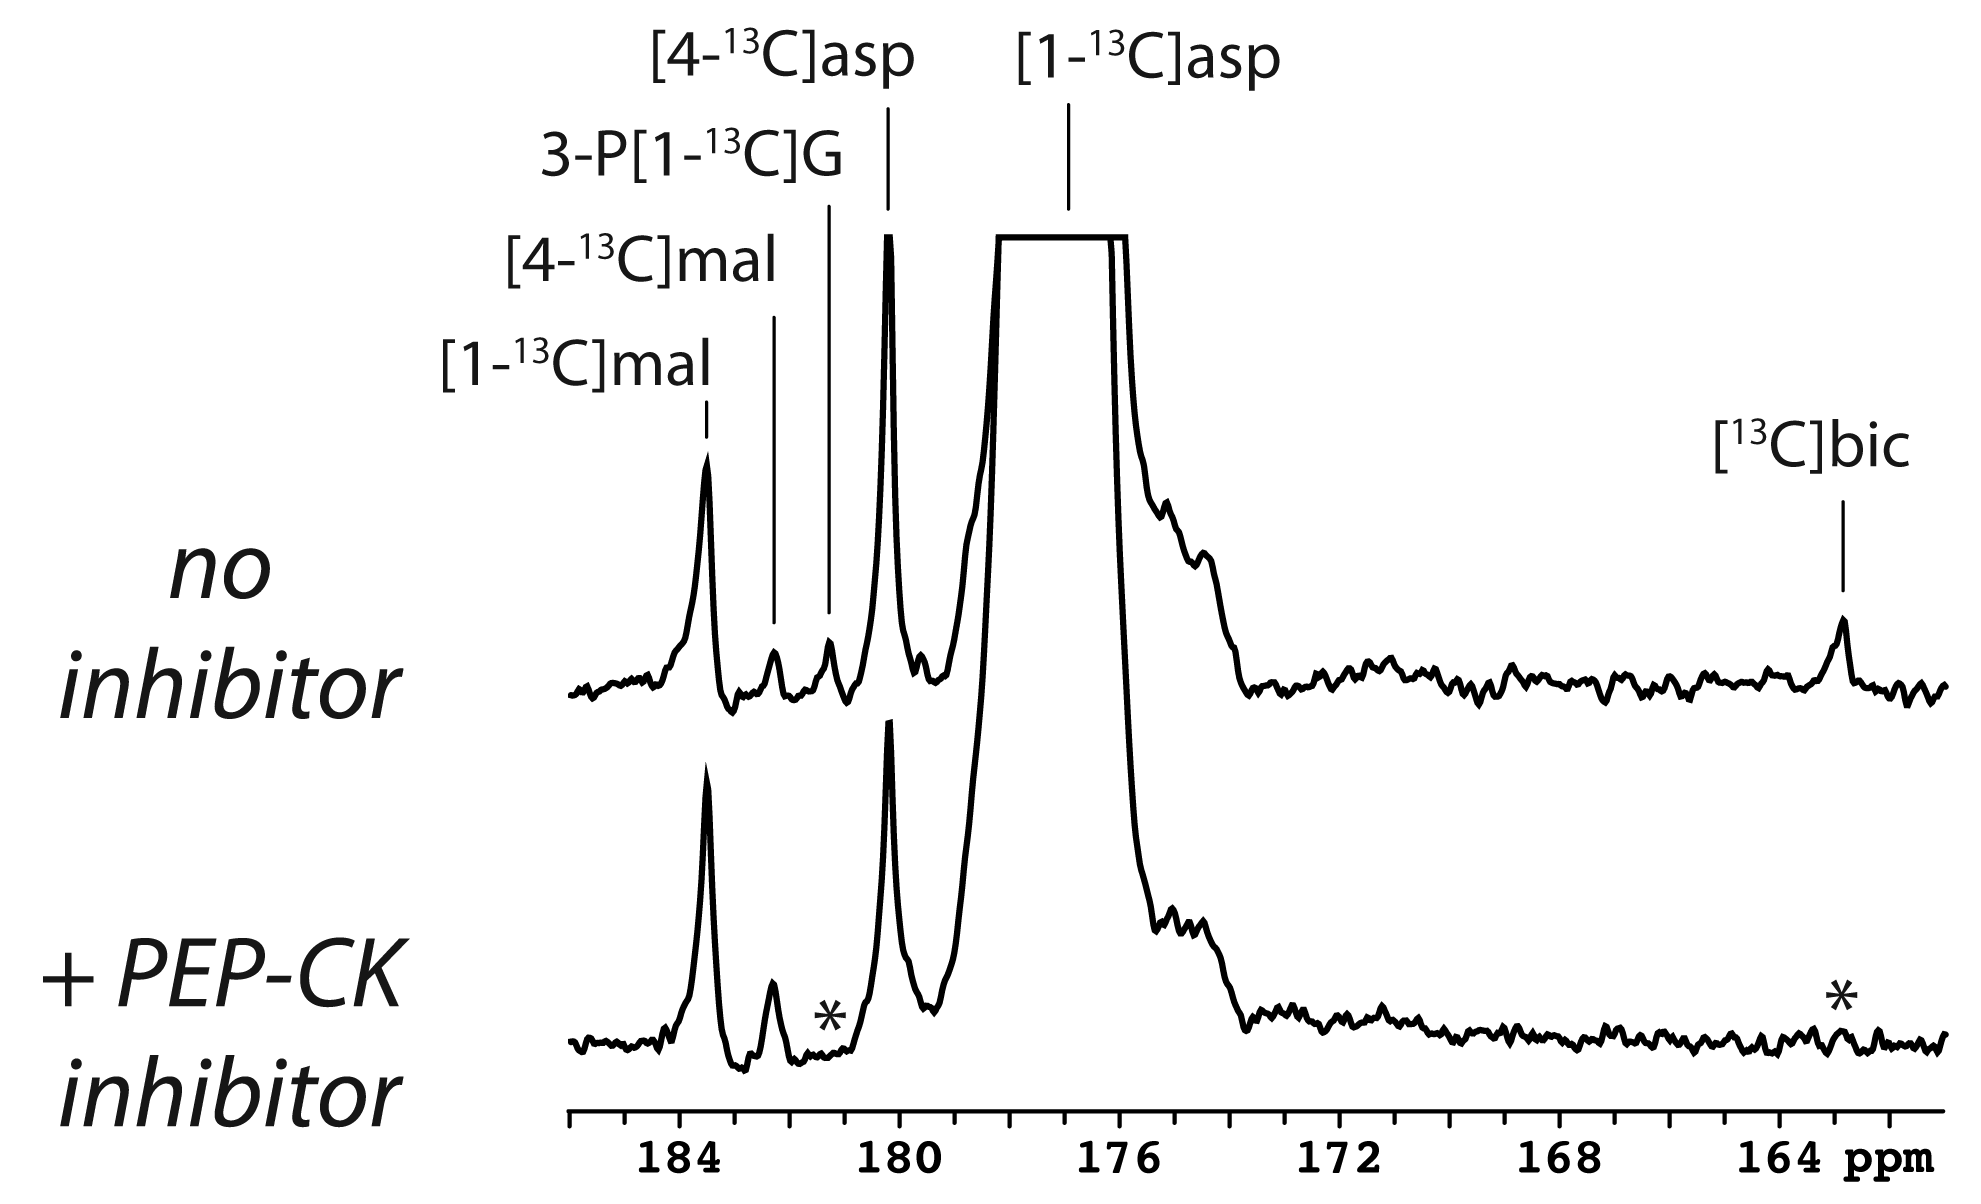
The main metabolite of [1-13C]aspartate was [1-13C]malate at 183.50 ppm (Figure 1). Other smaller metabolite signals at 182.27 ppm, 181.26 ppm and 162.9 ppm were also resolved in some experiments and correspond to [4-13C]malate, via label scrambling through fumarate, N-acetyl[1-13C]aspartate or 3-phospho[1-13C]glycerate, and [13C]bicarbonate, respectively. At pH 7.0 and 37 ºC, natural-abundance N-acetylaspartate 1-carbon was measured at 181.35 ppm, whereas it was 181.30 ppm for 3-phosphoglycerate. While N-acetylaspartate was not appreciably sensitive to pH in this range, the 3-phosphoglycerate chemical shift decreased with pH, making the assignment consistent with 3-phospho[1-13C]glycerate at pH ~6.9. Following treatment with 3-MPA, both the bicarbonate and 3-phosphoglycerate signals were absent, though the malate signals remained (Figure 1, lower spectrum).A much stronger hyperpolarized bicarbonate signal was observed in experiments with [1,4-13C2]aspartate, and it was consistently absent following PEP-CK inhibition with 3-MPA in both fed and 12-hour fasted rats (Figure 2). Comparing fed (n = 3) and fasted (n = 3) groups, the malate/aspartate ratio tended lower and the bicarbonate/aspartate ratio tended higher in fasted rats, but these differences did not reach statistical significance. The bicarbonate/malate ratio, however, was 3.2-fold higher in fasted rats (p = 0.0066, Figure 3). Experiments scanning the heart and liver showed no clear myocardial aspartate metabolism and much lower conversion in the liver compared to the kidney (Figure 4).
Discussion
Collectively, these results provide strong evidence that PEP-CK activity is required for the conversion of hyperpolarized [1-13C]aspartate and [1,4-13C2]aspartate to [13C]bicarbonate in the kidney. In addition to bicarbonate, the detection of 3-phosphoglycerate provides further support to the gluconeogenic fate of the hyperpolarized aspartate. To our knowledge, these results show for the first time the specific detection of PEP-CK flux with a hyperpolarized 13C-labeled substrate and demonstrate the potential of hyperpolarized aspartate to measure renal gluconeogenesis.Although substantial rates of “futile” cycling of pyruvate via oxaloacetate and phosphoenolpyruvate have been noted in the glucose metabolism of rabbit kidney tubules,7 neither pyruvate nor lactate was detected in the current study. These results underscore the ability of some substrates to selectively probe different metabolically distinct compartments in the kidney.8
Conclusion
Hyperpolarized 13C-aspartate can probe the early steps of gluconeogenesis in the kidney, and its conversion to [13C]bicarbonate is due to PEP-CK activity.Acknowledgements
The authors thank Analina da Silva, Mario Lepore and Stefan Mitrea for expert assistance with the animal experiments. This work was supported by the Swiss National Science Foundation (grant 310030_163050).References
1. Soty M, Gautier-Stein A, Rajas F, Mithieux G. Gut-Brain Glucose Signaling in Energy Homeostasis. Cell Metabolism. 2017;25(6):1231-1242. doi:10.1016/j.cmet.2017.04.032.
2. Merritt ME, Harrison C, Sherry AD, Malloy CR, Burgess SC. Flux through hepatic pyruvate carboxylase and phosphoenolpyruvate carboxykinase detected by hyperpolarized 13C magnetic resonance. Proceedings of the National Academy of Sciences. 2011;108(47):19084-19089. doi:10.1073/pnas.1111247108.
3. Moreno KX, Moore CL, Burgess SC, Sherry AD, Malloy CR, Merritt ME. Production of hyperpolarized (13)CO2 from [1-(13)C]pyruvate in perfused liver does reflect total anaplerosis but is not a reliable biomarker of glucose production. Metabolomics. 2015;11(5):1144-1156. doi:10.1007/s11306-014-0768-1.
4. Can E, Yoshihara HAI, Bastiaansen JAM, Gruetter R, Comment A. Effects of 3-MPA on in vivo hepatic metabolism of hyperpolarized [1-13C] pyruvate. Proc. Intl. Soc. Mag. Reson. Med; 2017:0166. https://cds.ismrm.org/protected/17MPresentations/abstracts/0166.html.
5. Nishiitsutsuji-Uwo JM, Ross BD, Krebs HA. Metabolic activities of the isolated perfused rat kidney. Biochem J. 1967;103(3):852-862.
6. Karlsson M, Jensen PR, Duus JØ, Meier S, Lerche MH. Development of dissolution DNP-MR substrates for metabolic research. Appl Magn Reson. 2012;43(1-2):223-236.
7. Chauvin MF, Mégnin-Chanet F, Martin G, Lhoste JM, Baverel G. The rabbit kidney tubule utilizes glucose for glutamine synthesis. A 13C NMR study. J Biol Chem. 1994;269(42):26025-26033.
8. Guder WG, Ross BD. Enzyme Distribution Along the Nephron. Kidney Int. 1984;26(2):101-111. doi:10.1038/ki.1984.143.
Figures