0700
Investigation of Dormant and Metastatic Breast Cancer Metabolism via Hyperpolarized 13C-MRS and Fluorescence Lifetime Imaging Microscopy1Medical Physics, University of Wisconsin-Madison, Madison, WI, United States, 2Morgridge Institute for Research, Madison, WI, United States, 3Laboratory for Optical and Computational Instrumentation, University of Wisconsin-Madison, Madison, WI, United States, 4Cell and Regenerative Biology, University of Wisconsin-Madison, Madison, WI, United States, 5Radiology, University of Wisconsin-Madison, Madison, WI, United States, 6Biomedical Engineering, University of Wisconsin-Madison, Madison, WI, United States
Synopsis
Hyperpolarized 13C-Magnetic resonance spectroscopy (13C-MRS) and NADH fluorescence lifetime imaging (FLIM) have evolved as methods to detect metabolic shifts in aerobic glycolysis and oxidative phosphorylation which are associated with metastatic potential in cancer metabolism. This study set out to investigate the differences in cancer metabolism between murine non-metastatic, metastatic-dormant, and highly metastatic breast cancer cell lines. FLIM analysis revealed no differences in free and bound NADH between cell lines, indicative of uniform ATP production through oxidative phosphorylation; however, hyperpolarized 13C-MRS measurements detected an increase in lactate production, or aerobic glycolysis, which was associated with greater breast cancer metastatic potential.
Introduction
Altered cellular metabolism has rapidly become a hallmark of cancer research as cancer cells are known to reprogram their metabolic pathways in order to support growth and proliferation [1]. In this regard, fluorescence lifetime imaging microscopy (FLIM) of the intrinsically fluorescent coenzyme NADH [2-3] has evolved as a method to detect cellular levels of ATP produced through oxidative phosphorylation. Additionally, hyperpolarized 13C-Magnetic resonance spectroscopy (13C-MRS) has proven to be an accurate method to detect the increase in aerobic glycolysis, or “Warburg effect [4]” which is associated with cancer metastasis [5]. Therefore, this study set out to investigate the metabolic shifts associated with cancer dormancy and metastasis in a series of murine non-metastatic, metastatic-dormant, and highly metastatic breast cancer cell lines.Methods
Murine breast cancer cell lines (N=3/line) derived from a spontaneous mouse mammary tumor were separated based on metastatic potential: 67NR (nonmetastatic), 4T07 (metastatic-dormant), 4T1 (highly metastatic) , and individual 3D matrix gels with 8-million cells and collagen density of 2 mg/ml were prepared [6] in a dual (FLIM/MRS) bioreactor with temperature control [2]. NADH FLIM and hyperpolarized 13C-MRS were performed on each 3D cell culture in a single day. The 2D FLIM was conducted with a 20×air objective (NA = 0.75) (Nikon) on a custom multiphoton laser scanning system built around an inverted Nikon TE300 microscope (3). NADH was ex-cited with a wavelength of 740 nm and collected with a 450/70 bandpass filter (Semrock, Rochester, NY, USA). Collection times for each field of view (N=3) were 150 seconds, and data was analyzed using SPC Image (Becker and Hickl, Berlin, Germany). Hyperpolarized 13C-MRS measurements were conducted on a 4.7T preclinical magnetic resonance imaging system (Agilent Technologies, Santa Clara, CA) with a dual tuned 1H/13C quadrature radio-frequency volume coil (Doty Scientific, Columbia, SC). Temperature of the cell culture inside the bioreactor was maintained at 36±1°C, and proton line widths were shimmed to ≤30Hz prior to pyruvate injection. [1-13C] Pyruvate (30 μl) (Cambridge Isotope Laboratories Inc., Tewksbury, MA) doped with 15 mM trityl radical (Ox063, GE Healthcare, Waukesha, WI) was hyperpolarized at 3.35T (HyperSense, Oxford Instruments, UK). Following solid-state polarization, the sample was rapidly heated with a 4 mL solvent containing 1.2 mL of 426 mM NaOH, 1.4 mL of 400 mM Tris base, and 1.4 mL of 250 mg/L EDTA. Liquid-state polarization values of 18-25% were achieved, and 150 μl was rapidly injected into the bioreactor via a cannula. Global 13C-MRS pulse-acquire spectra (FA/10°, TR/3000 ms, number of acquisitions = 90). Ratios of lactate to pyruvate (Lac/Pyr) were calculated from the Gaussian fit of the respective peak areas via prior knowledge and the AMARES algorithm within the jMRUI v5.2 software package [7-8], after zero-filling (4096) and the summation of the entire time course of 13C-MRS spectra. Results were represented as mean±SD, and differences between groups were assessed using Wilcoxon-Mann-Whitney-tests, with p≤0.05 considered to be significant.Results
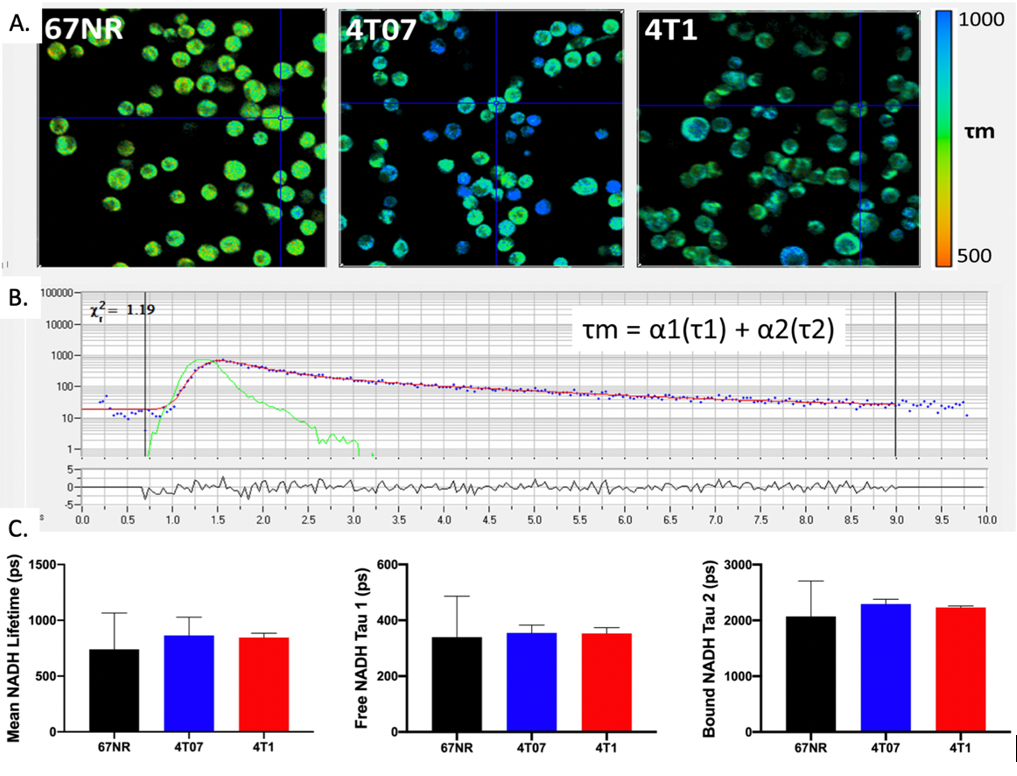
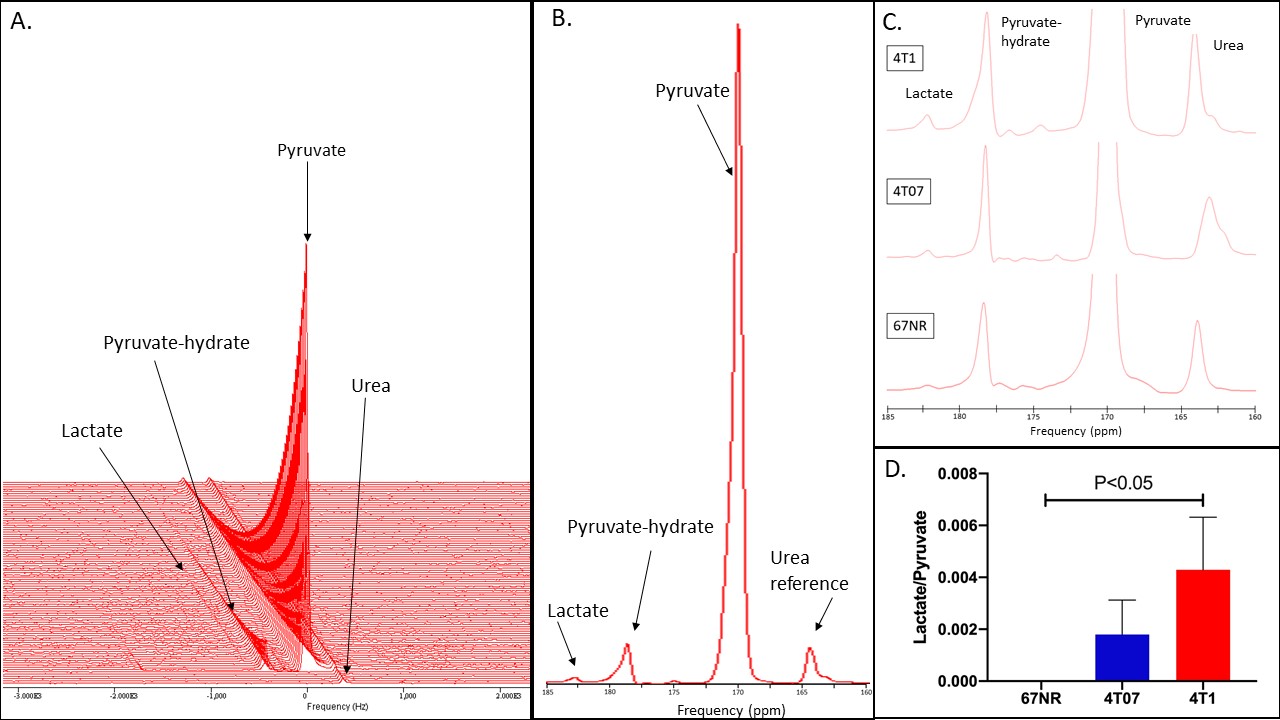
Cellular level FLIM measurements of NADH lifetime revealed no differences between mean, free, or bound NADH, which was indicative of constant oxidative phosphorylation across the non-metastatic, metastatic-dormant, and highly metastatic cell lines (Figure 1). Hyperpolarized 13C-MRS revealed that slow growing non-metastatic 67NR cell lines did not produce any quantifiable levels of lactate via aerobic glycolysis (Figure 2). However, differences in lactate peaks were clearly observed and quantified using hyperpolarized 13C-MRS (Figure 2) in all metastatic-dormant 4T07 cell cultures (Lac/Pyr: 1.8*10-3±1.3*10-3), and levels of lactate production were further increased (P<0.5) within highly metastatic 4T1 cells (Lac/Pyr: 4.3*10-3±2.0*10-3).Conclusion
The combination of FLIM imaging of NADH and hyperpolarized 13C-MRS detected the real-time rates of oxidative phosphorylation and aerobic glycolysis across murine cell lines of variable metastatic potential. Initial FLIM analysis revealed no differences in free and bound NADH between cell lines, indicative of uniform ATP production through oxidative phosphorylation. However, hyperpolarized 13C-MRS measurements clearly detected a metabolic shift to aerobic glycolysis, through the detection of lactate production, which increased with greater breast cancer metastatic potential.Acknowledgements
No acknowledgement found.References
1. Hsu, PP., et al., Cancer cell metabolism: Warburg and beyond. Cell 2008; 134:703 707.
2. Cox, B. L. et al. A novel bioreactor for combined magnetic resonance spectroscopy and optical imaging of metabolism in 3D cell cultures. Magn. Reson. Med. 81, 3379–3391 (2019).
3. Yan L, Rueden CT, White JG, Eliceiri KW. Applications of combined spectral lifetime microscopy for biology. Biotechniques. 2006;41:249, 251:253.
4.Warburg, O., Uber den Soffwechsel der Carcinomzelle. Klin Wochenschr Berl 1925, 4:534-536.
5. Kurhanewicz, J. et al. Analysis of Cancer Metabolism by Imaging Hyperpolarized Nuclei: Prospects for Translation to Clinical Research. 13, 81 (2011).
6. Burkel B, Morris BA, Ponik SM, Riching KM, Eliceiri KW, Keely PJ. Preparation of 3D collagen gels and microchannels for the study of 3D interactions in vivo. J Vis Exp JoVE. 2016;111:27213771.
7. Vanhamme, L., Van Den Boogaart, A. & Huffel, S. Van. Improved Method for Accurate and Efficient Quantification of MRS Data with Use of Prior Knowledge. JOURNAL OF MAGNETIC RESONANCE 129, (1997).
8. Naressi, A. et al. Java-based graphical user interface for the MRUI quantitation package. Magma Magn. Reson. Mater. Physics, Biol. Med. 12, 141–152 (2001).
Figures