0698
Is [1-13C]Lactate Converted to 13C-Bicarbonate in the Human Brain?1Medical Biophysics, University of Toronto, Toronto, ON, Canada, 2Physical Sciences, Sunnybrook Research Institute, Toronto, ON, Canada, 3Radiation Oncology, Sunnybrook Health Sciences Centre, Toronto, ON, Canada, 4GE Healthcare Technologies, Toronto, ON, Canada, 5Pharmacy, Sunnybrook Health Sciences Centre, Toronto, ON, Canada, 6Radiology, Sunnybrook Health Sciences Centre, Toronto, ON, Canada, 7Department of Medicine (Neurology) and Hurvitz Brain Sciences Research Program, Sunnybrook Health Sciences Centre, Toronto, ON, Canada
Synopsis
Hyperpolarized [1-13C]lactate and 13C-bicarbonate images were acquired with and without spectral-spatial lactate saturation in the brains of control participants. A previously published atlas-based analysis was used to convert [1-13C]lactate and 13C-bicarbonate signals into z-scores to quantify the effect of [1-13C]lactate saturation. The analysis showed that lactate z-scores were changed in the saturation regions, as expected. The saturation of [1-13C]lactate signals did not significantly affect 13C-bicarbonate signals.
Introduction
Hyperpolarized 13C MRI is a metabolic imaging approach that can form images of contrast agent (i.e. [1-13C]pyruvate) and its downstream metabolites, [1-13C]lactate and 13C-bicarbonate1. Signals of [1-13C]lactate or 13C-bicarbonate have been generally considered as a marker for glycolytic or oxidative activities, respectively. However, the astrocyte-neuron lactate shuttle model proposes that lactate can be transferred and used as a fuel to supplement oxidative phosphorylation in neurons -- and generate bicarbonate in the process2. The fraction of [1-13C]lactate that contributes to the 13C-bicarbonate signal has not been investigated.In this study, [1-13C]lactate signal was selectively saturated in brain regions with 2 different slab thicknesses and positions and compared to the condition without [1-13C]lactate saturation to measure the effect of [1-13C]lactate saturation on 13C-bicarbonate signals in human brains. Acquired [1-13C]lactate and 13C-bicarbonate images were analyzed by converting the 13C-signals into z-scores via an atlas-based approach previously described3, which segments the brains into the 56 structural regions included in the LPBA40 atlas.
Methods
Image Acquisition Written informed consent was obtained from 2 control subjects. Following the protocol described in Lee et al.3, 1H multi-echo reference data and 13C-signals were acquired following the injection of HP [1-13C]pyruvate (0.1mmol/kg dose at 4mL/s followed by a 25mL normal saline flush at 5mL/s) in a GE MR750 3.0T MRI scanner (GE Healthcare, Waukesha, WI). For this study, 2 subjects were scanned on different days using one of the 13C-data acquisition protocols described below.Non-saturation: Using the single-tuned home-built 13C birdcage, 13C-signal was acquired with the same sequence and protocol previously described3 using spectral-spatial excitation4 of lactate/bicarbonate/pyruvate resonances (sequentially) followed by a 3D dual-echo EPI (DE-EPI) readout5 (5s TR; axial; 1.5cm isotropic resolution with FOV 24x24x36cm3, total of 60s acquisition).
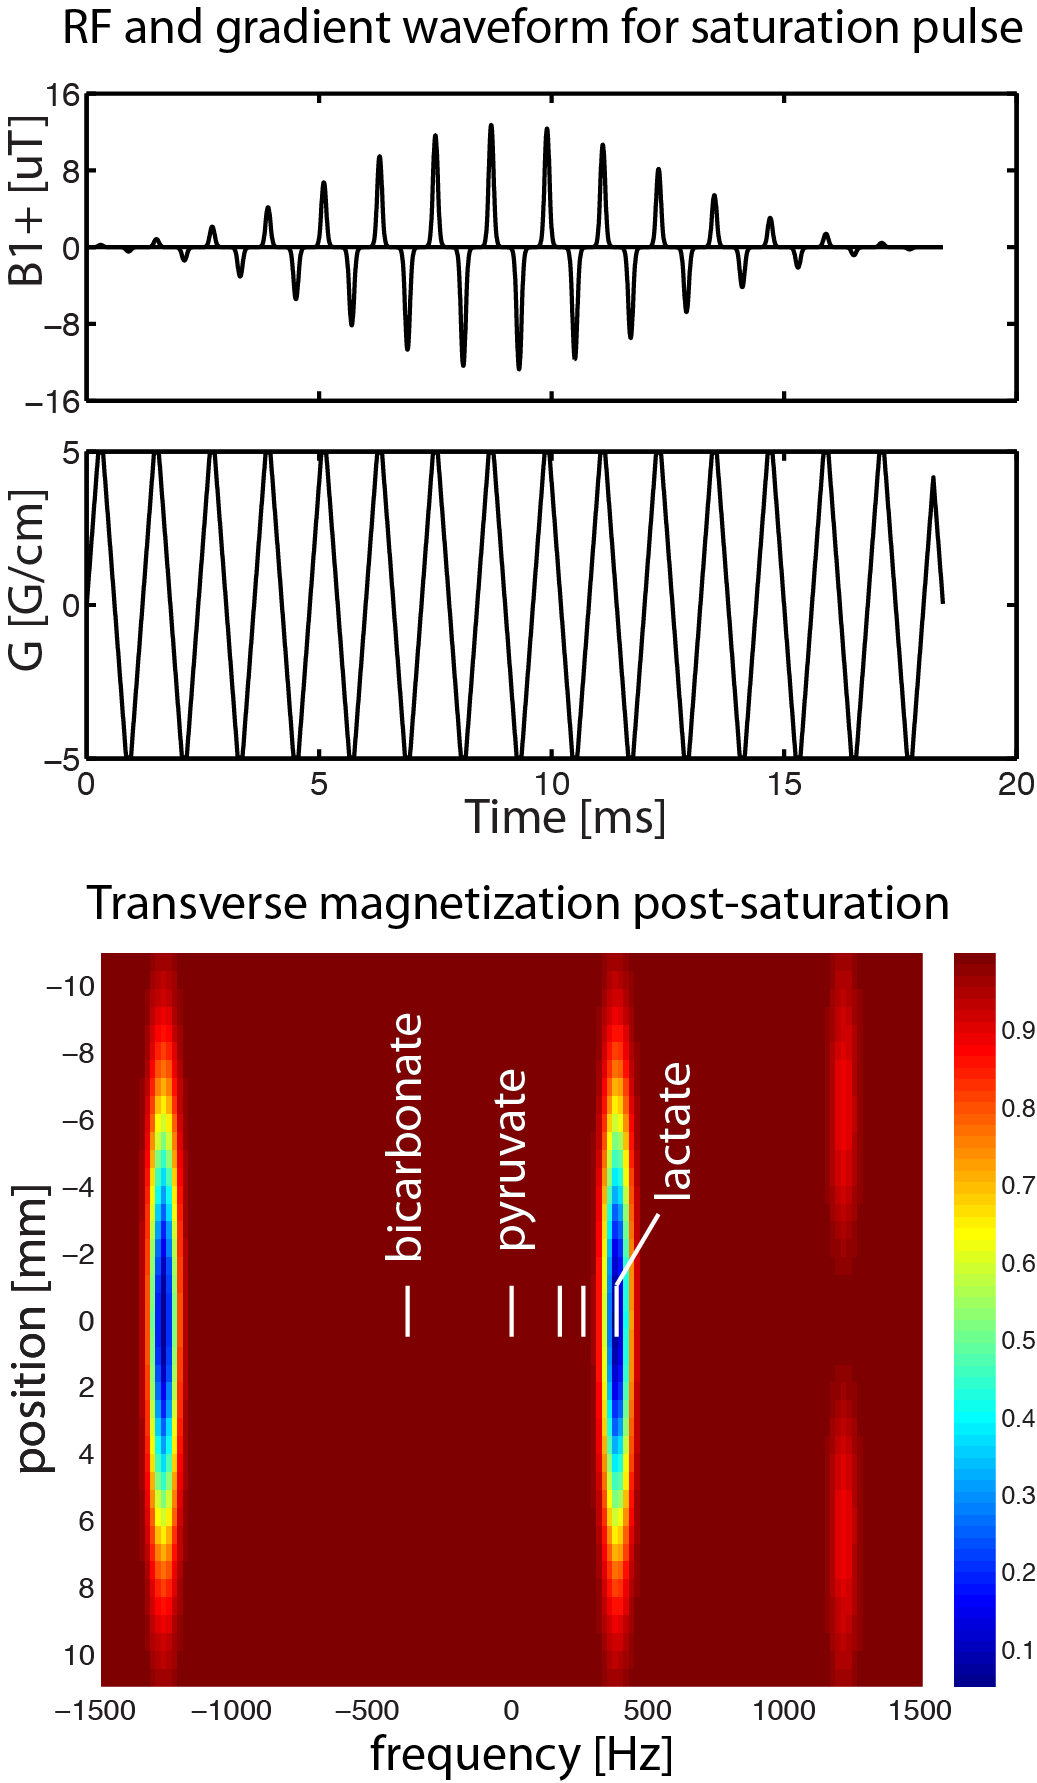
[1-13C]lactate saturation: A modified version of the sequence (Fig. 1) was applied to selectively saturate [1-13C]lactate signals prior to each volume acquisition (applied once every 1.25 seconds). An axial saturation slab was used with thickness 9 cm for subject 1 and 4 cm for subject 2.
Following the 13C-data acquisition, a standard 8-channel 1H neurovascular array (Invivo Inc.) was used to acquire fast spoiled GRE (FOV 25.6×25.6 cm2, 1 mm-isotropic resolution, TR 7.6 ms, TE 2.9 ms, flip angle 11°) images.
Image Reconstruction 13C images were reconstructed offline using MATLAB R2013a (The MathWorks Inc., MA, Natick, Massachusetts). Geometric distortion artefacts were corrected via data-driven approach5. The final 13C images were generated by summing odd/even echoes and summing individual time-resolved images over full 60s acquisition window to improve SNR, which then were resampled to match the coordinates and matrix size of T1-weighted images (Fig. 2).
Image Analysis Regional segmentation of 13C-signals were conducted in the LONI pipeline processing environment3,6. To compare saturation to the non-saturated condition in the same participant, the average 13C-signals from each of 56 structural regions embedded in the LPBA40 atlas were converted into z-scores3 (the number of standard deviations from the mean of all regions within a single subject).
Results and Discussion
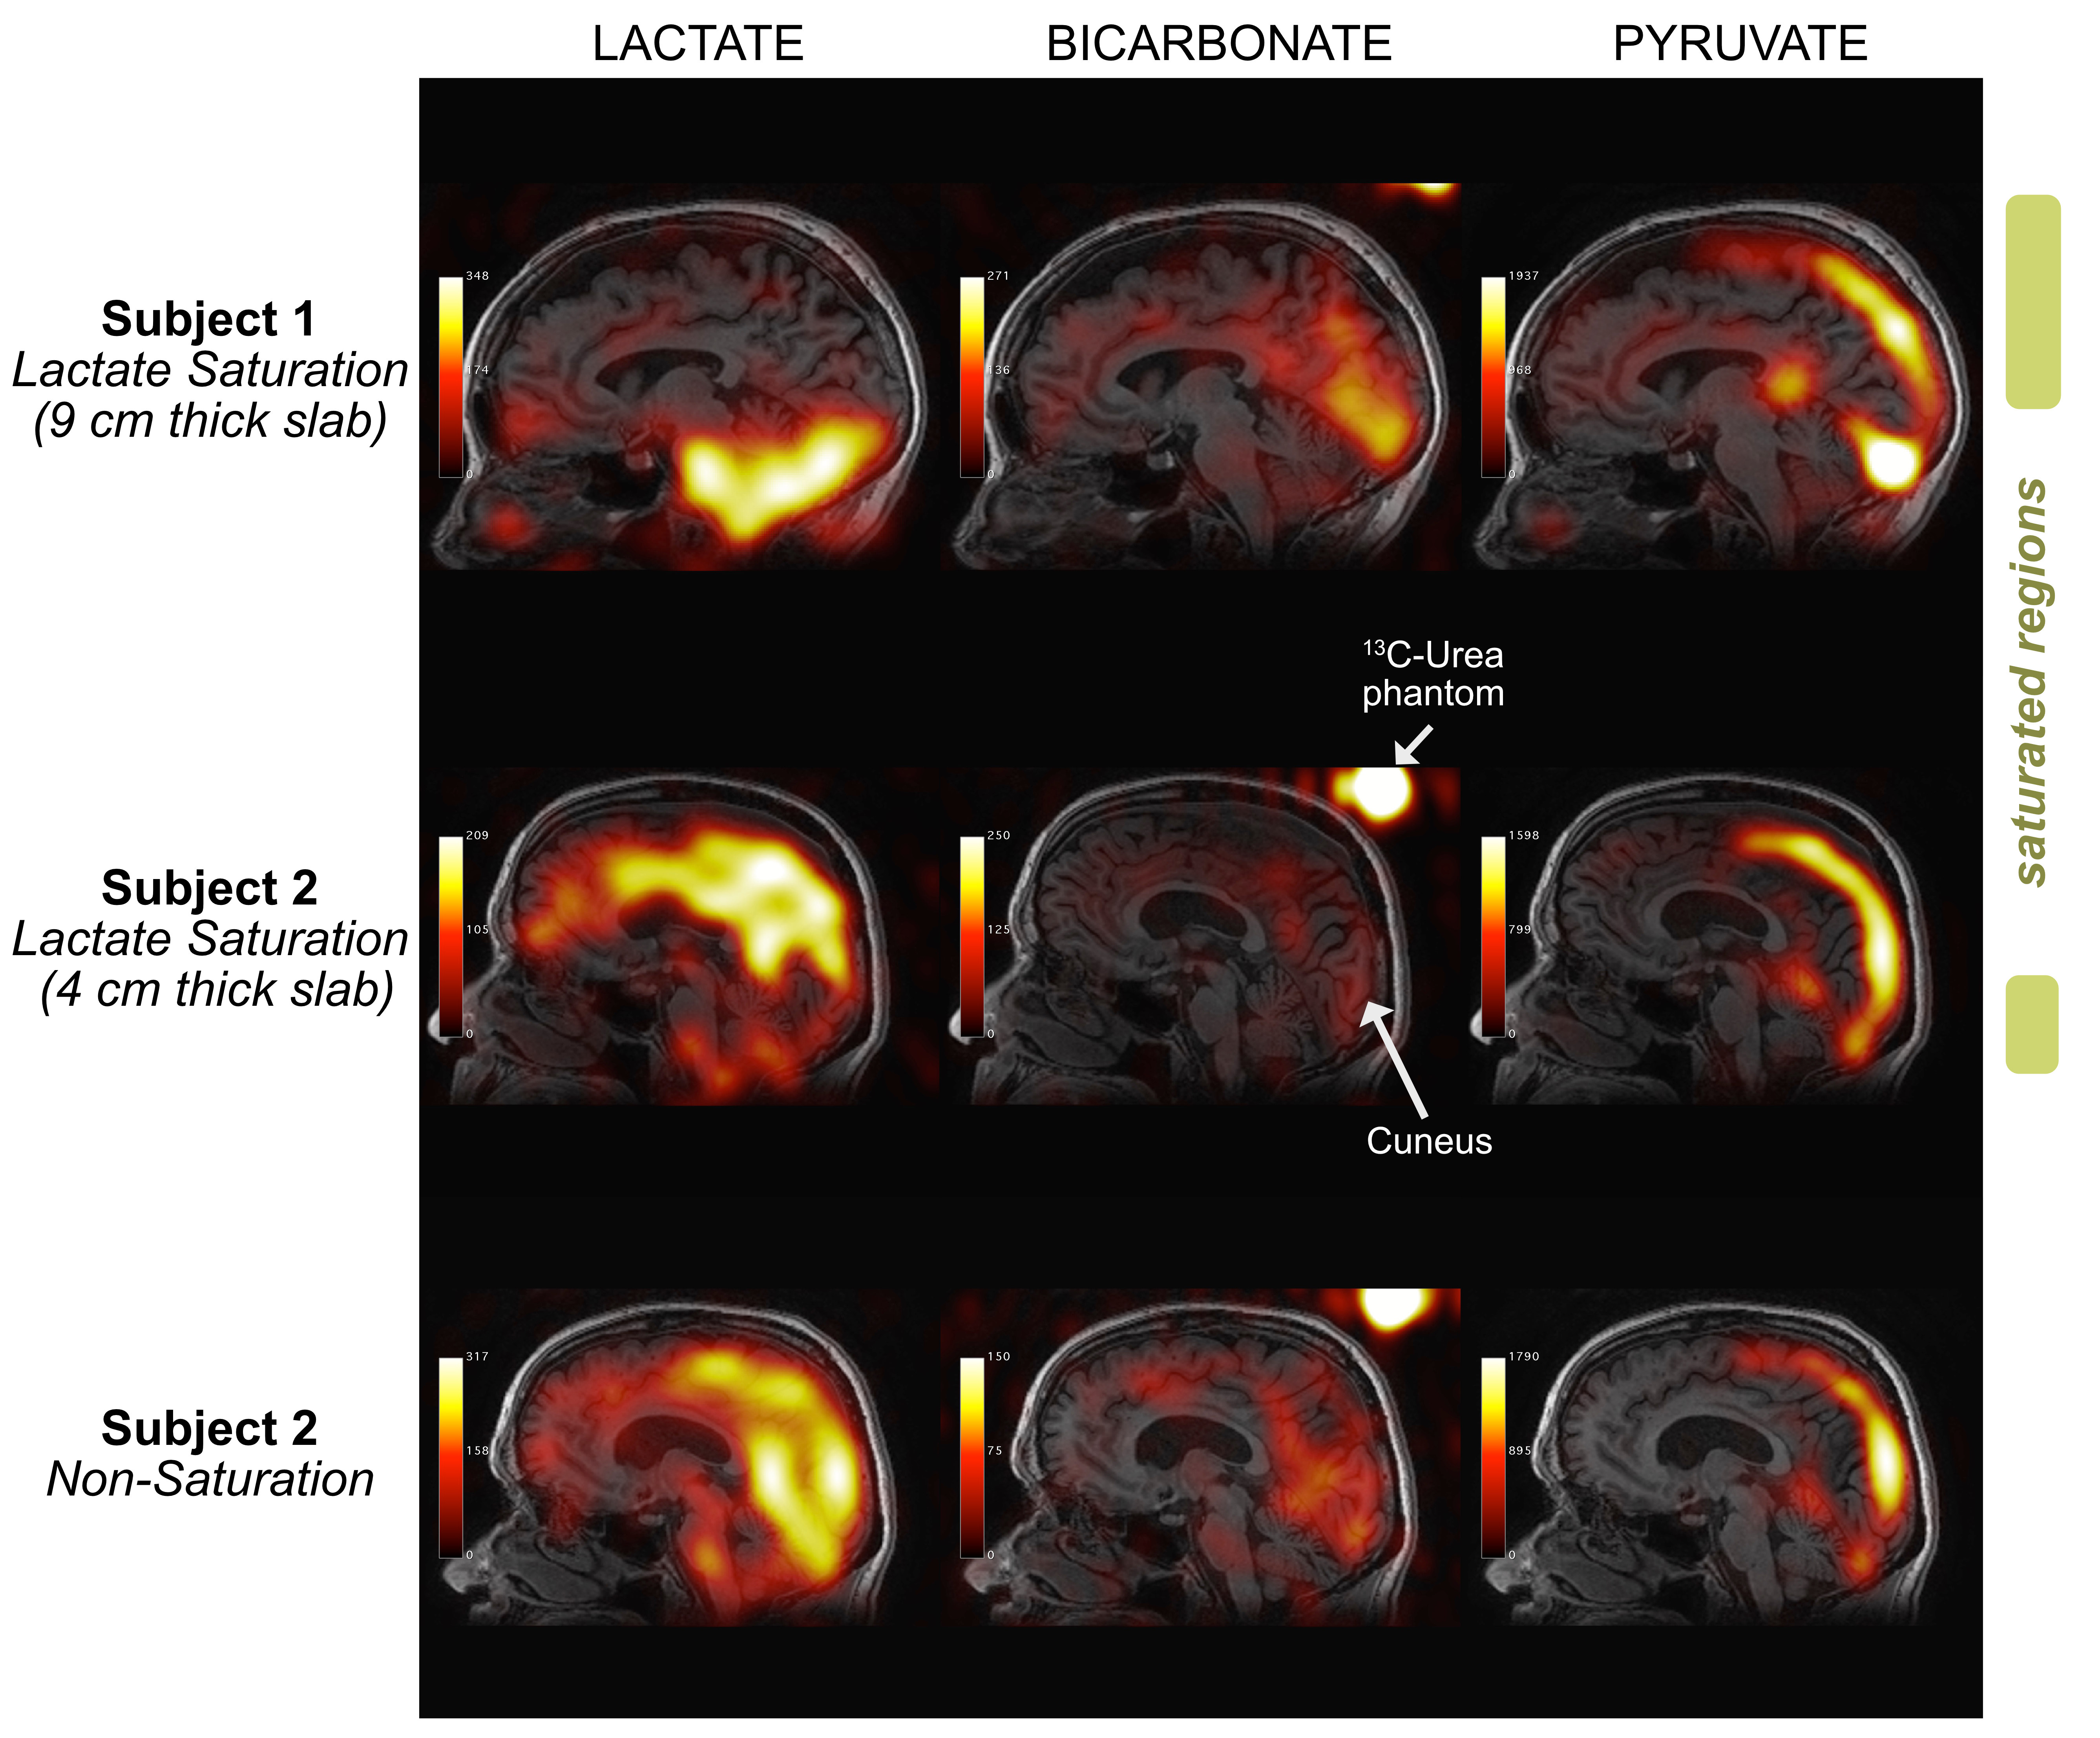
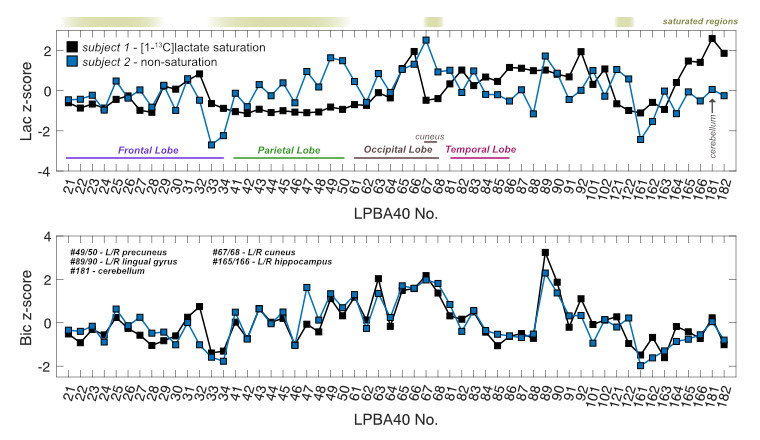
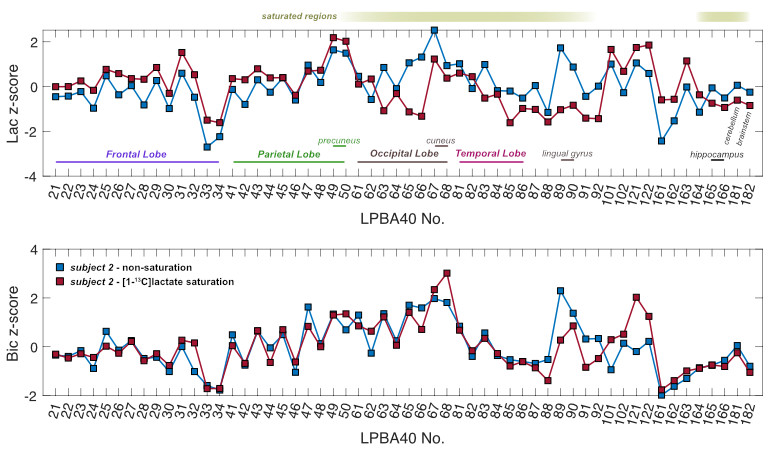
Sagittal images of lactate, bicarbonate, and pyruvate from non-saturation and both saturation subjects are shown in Fig. 2. Regions that lie partially or fully within the [1-13C]lactate saturation band (i.e. regions above cerebellum for subject 1 and occipital or temporal lobe regions for subject 2) showed lower regional z-scores compared to the z-scores from the same region in the non-saturation subject (Fig. 3 & 4).As expected, lactate z-scores showed poor agreement to non-saturation subject (Kendall’s coefficient of concordance (W) = 0.56 and 0.70 for subject 1 and 2, respectively), as expected. On the contrary, bicarbonate z-scores with saturation were in good agreement to non-saturation subject (W = 0.90 for both), showing that the saturation of [1-13C]lactate does not significantly affect 13C-bicarbonate signal. This suggests that the infused [1-13C]pyruvate is directly converted to 13C-bicarbonate in the brain, and not shuttled through the [1-13C]lactate pool that is visible in this experiment.
Conclusion
Hyperpolarized [1-13C]lactate and 13C-bicarbonate images were acquired with and without spectral-spatial lactate saturation in human brains. Lactate z-scores were changed in the saturation regions, as expected. The saturation of [1-13C]lactate signals did not significantly affect 13C-bicarbonate signals, suggesting that infused [1-13C]pyruvate is directly converted to 13C-bicarbonate in the brain.Acknowledgements
The authors thank Julie Green and Sumeet Sachdeva for coordinating the study, and Ruby Endre and Garry Detzler for MR technical support. Funding support from the Brain Canada and Canadian Institutes for Health Research.References
1. Ardenkjær-Larsen, Jan H., et al. "Increase in signal-to-noise ratio of> 10,000 times in liquid-state NMR." Proceedings of the National Academy of Sciences 100.18 (2003): 10158-10163.
2. Pellerin, Luc, and Pierre J. Magistretti. "Glutamate uptake into astrocytes stimulates aerobic glycolysis: a mechanism coupling neuronal activity to glucose utilization." Proceedings of the National Academy of Sciences 91.22 (1994): 10625-10629.
3. Lee, Casey Y., et al. "Lactate topography of the human brain using hyperpolarized 13C-MRI." NeuroImage 204 (2020): 116202.
4. Cunningham, Charles H., et al. "Pulse sequence for dynamic volumetric imaging of hyperpolarized metabolic products." Journal of magnetic resonance 193.1 (2008): 139-146.
5. Geraghty, Benjamin J., et al. "Dual‐Echo EPI sequence for integrated distortion correction in 3D time‐resolved hyperpolarized 13C MRI." Magnetic resonance in medicine 79.2 (2018): 643-653.
6. Rex, David E., Jeffrey Q. Ma, and Arthur W. Toga. "The LONI pipeline processing environment." Neuroimage 19.3 (2003): 1033-1048.
Figures