0695
A Metabolite Specific 3D Stack-of-Spiral bSSFP Sequence for Improved Lactate Imaging in Hyperpolarized [1-13C]Pyruvate Studies on a 3T Scanner1University of California, San Francisco, San Francisco, CA, United States, 2HeartVista, Los Altos, CA, United States
Synopsis
This work describes a novel 3D bSSFP sequence that integrates a lactate specific excitation pulse and stack-of-spiral readouts for improved lactate dynamic imaging in hyperpolarized [1-13C]pyruvate studies on a clinical 3T scanner. Compared with metabolite specific GRE sequences, the MS-3DSSFP sequence showed an overall 2.5X SNR improvement for lactate imaging in rat kidneys, tumors of TRAMP mice and human kidneys.
Introduction
Magnetic resonance imaging with hyperpolarized 13C-labeled compounds via dynamic nuclear polarization (DNP) has been used to non-invasively study metabolic processes in vivo.1,2 The MR signals of the hyperpolarized [1-13C]pyruvate and its downstream metabolites are typically acquired using gradient echo ("GRE") sequences (CSI, 2,3 multi-echo IDEAL,4,5 metabolite specific EPI6,7 or spiral8 acquisition). Compared to GRE acquisitions, the balanced steady state free precession ("bSSFP")9–15 sequence can acquire the nonrenewable hyperpolarized magnetization more efficiently by repetitively refocusing transverse spins. This article presents a novel metabolite specific 3D bSSFP sequence ("MS-3DSSFP") with stack-of-spiral readouts for improved dynamic lactate imaging in hyperpolarized [1-13C]pyruvate studies on a clinical 3T scanner.Methods
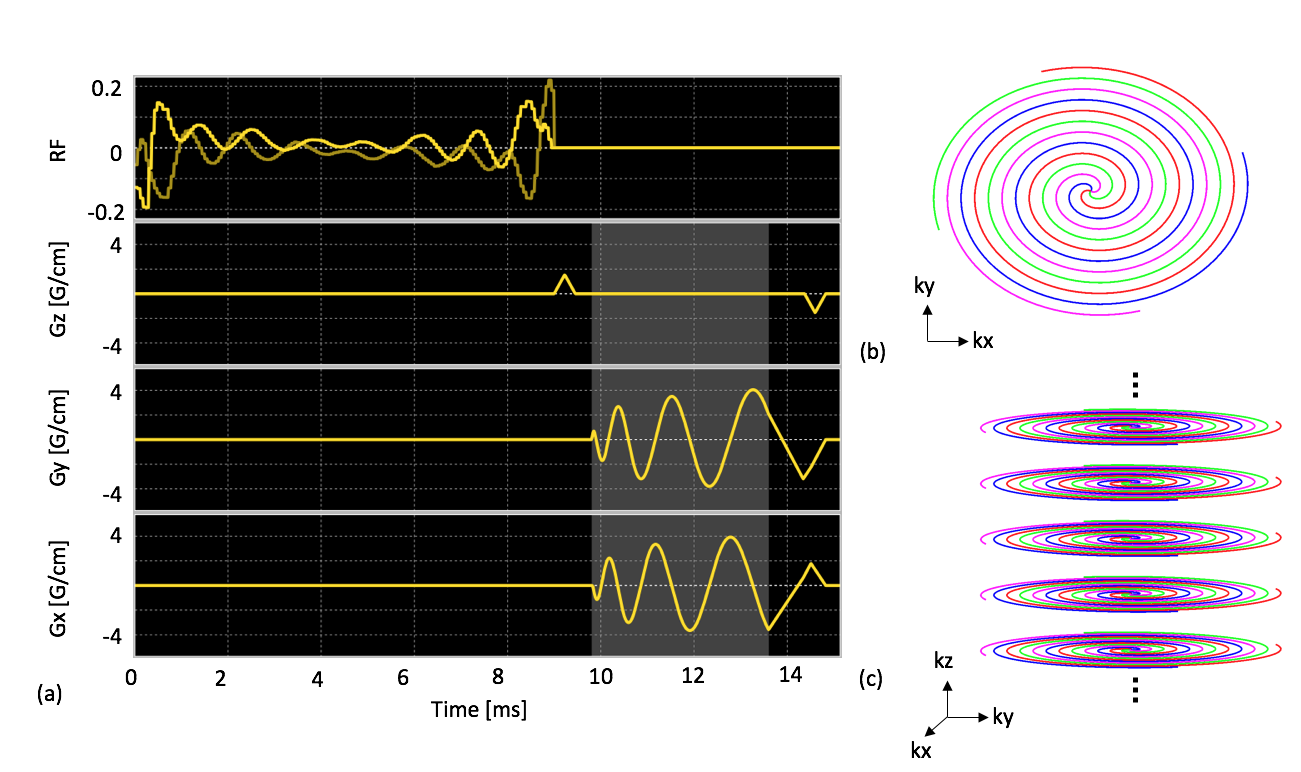
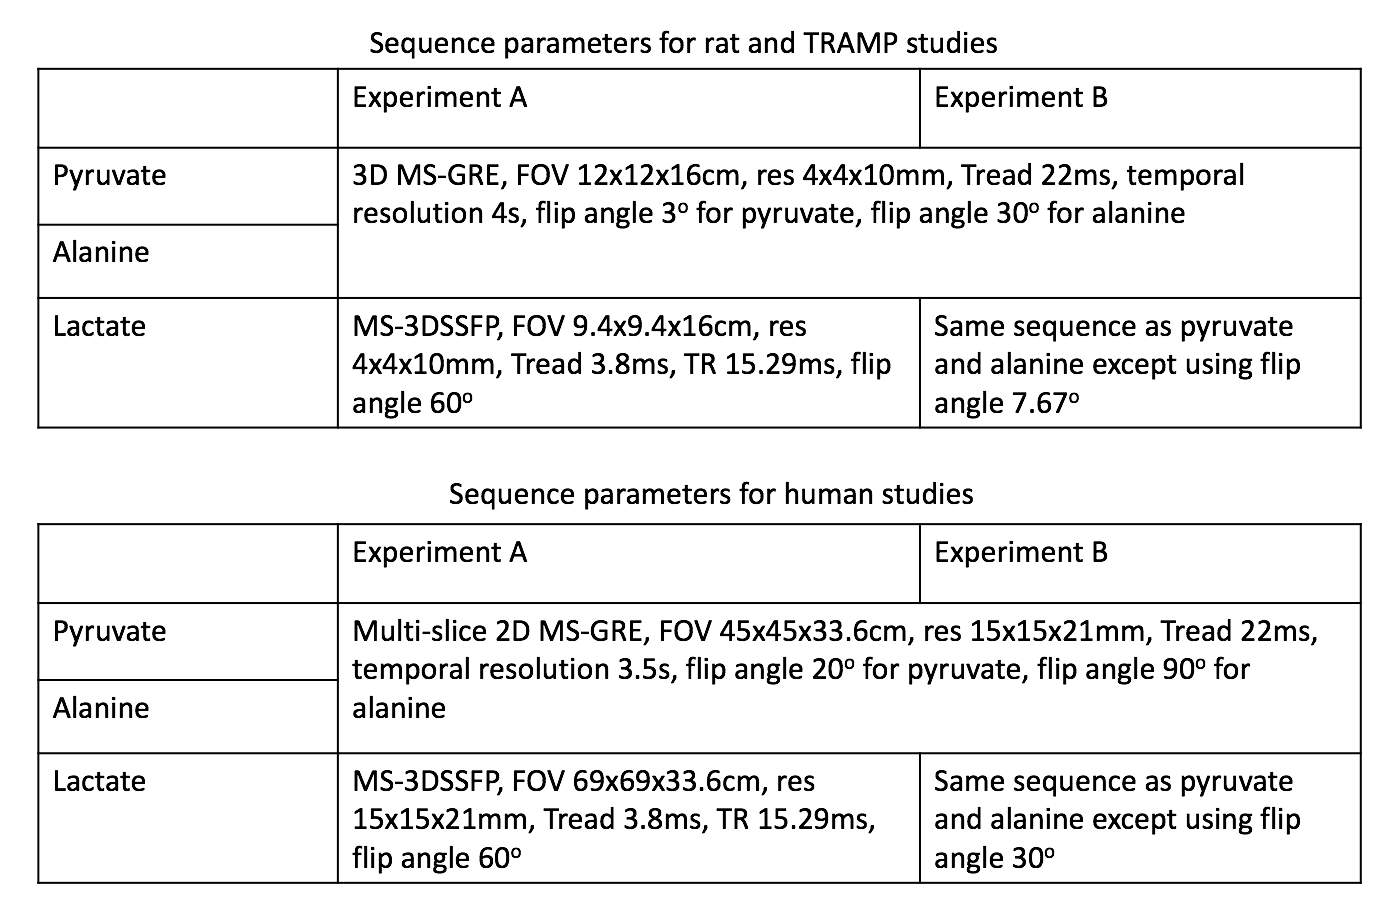
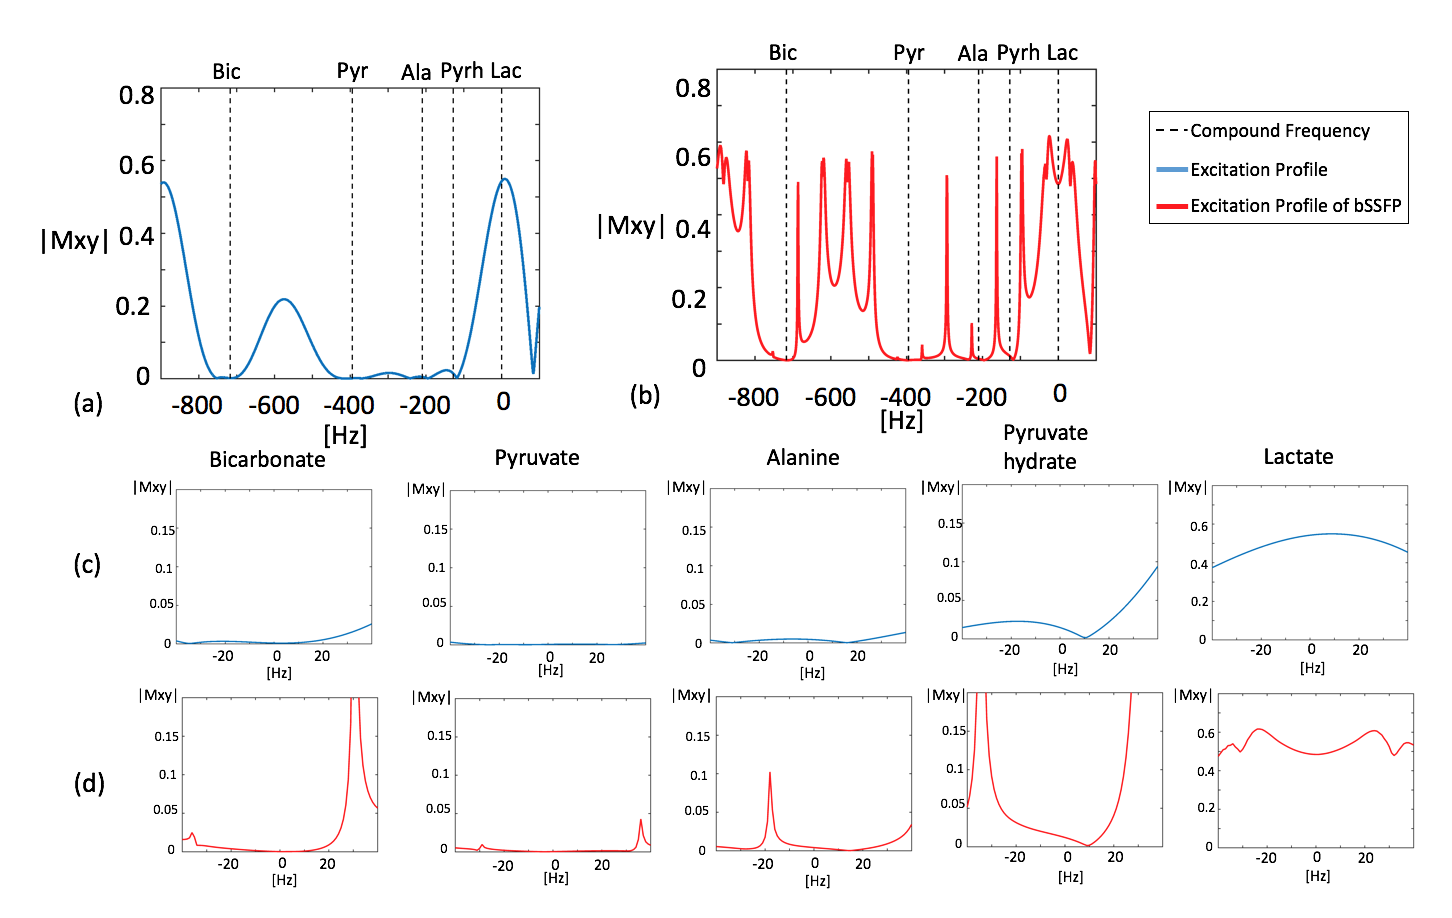
The proposed MS-3DSSFP sequence (Figure 1) consists of a multiband RF pulse and a center-out 3D uniform-density stack-of-spiral readout. The RF pulse was designed using a prior approach16 to minimize the pulse duration. This pulse had a duration of 9ms, a maximum B1 of 0.2195G, a 40Hz passband on lactate (0Hz), a 40Hz stopband with 5% ripples on pyruvate hydrate (-128Hz) and 40Hz stopbands with 0.5% ripples on bicarbonate (-717Hz), pyruvate (-395Hz) and alanine (-210Hz). The 3D stack-of-spiral trajectory consists of 16 stacks and each stack consists of four 3.8ms interleaves. All gradients have zero net area over the course of one repetition. The MS-3DSSFP sequence was implemented on a GE Signa MR 3T scanner (GE Healthcare, Waukesha, WI) using a commercial software (RTHawk, HeartVista, Los Altos, CA).The excitation profiles of the RF pulse and its averaged transverse magnetization over all echoes of bSSFP acquisitions were simulated. Simulation parameters are: number of RF pulses = 50, TR = 15.3ms, T1 = 30s, T2 = 1s, 6 non-linear ramp preparation pulses, flip angle = 60o. To test our MS-3DSSFP sequence in vivo, hyperpolarized [1-13C]pyruvate experiments were performed on three healthy Sprague-Dawley rats, three transgenic adenocarcinoma of mouse prostate (TRAMP) mice and two patients with renal tumors that required surgical removal. 13C sequence parameters of all experiments are presented in Figure 2. Each subject received two identical injections of hyperpolarized [1-13C]pyruvate (SpinLab, GE healthcare) to compare the MS-3DSSFP with metabolite-specific gradient echo sequences “MS-GRE”. In animal studies, the MS-GRE sequence was a 3D sequence consisting of a single-band spectral-spatial excitation and stack-of-spiral readouts. In human studies, the MS-GRE sequence was a 2D multi-slice sequence with the same excitation pulse and the same single-shot spiral readout.
Results & Discussion
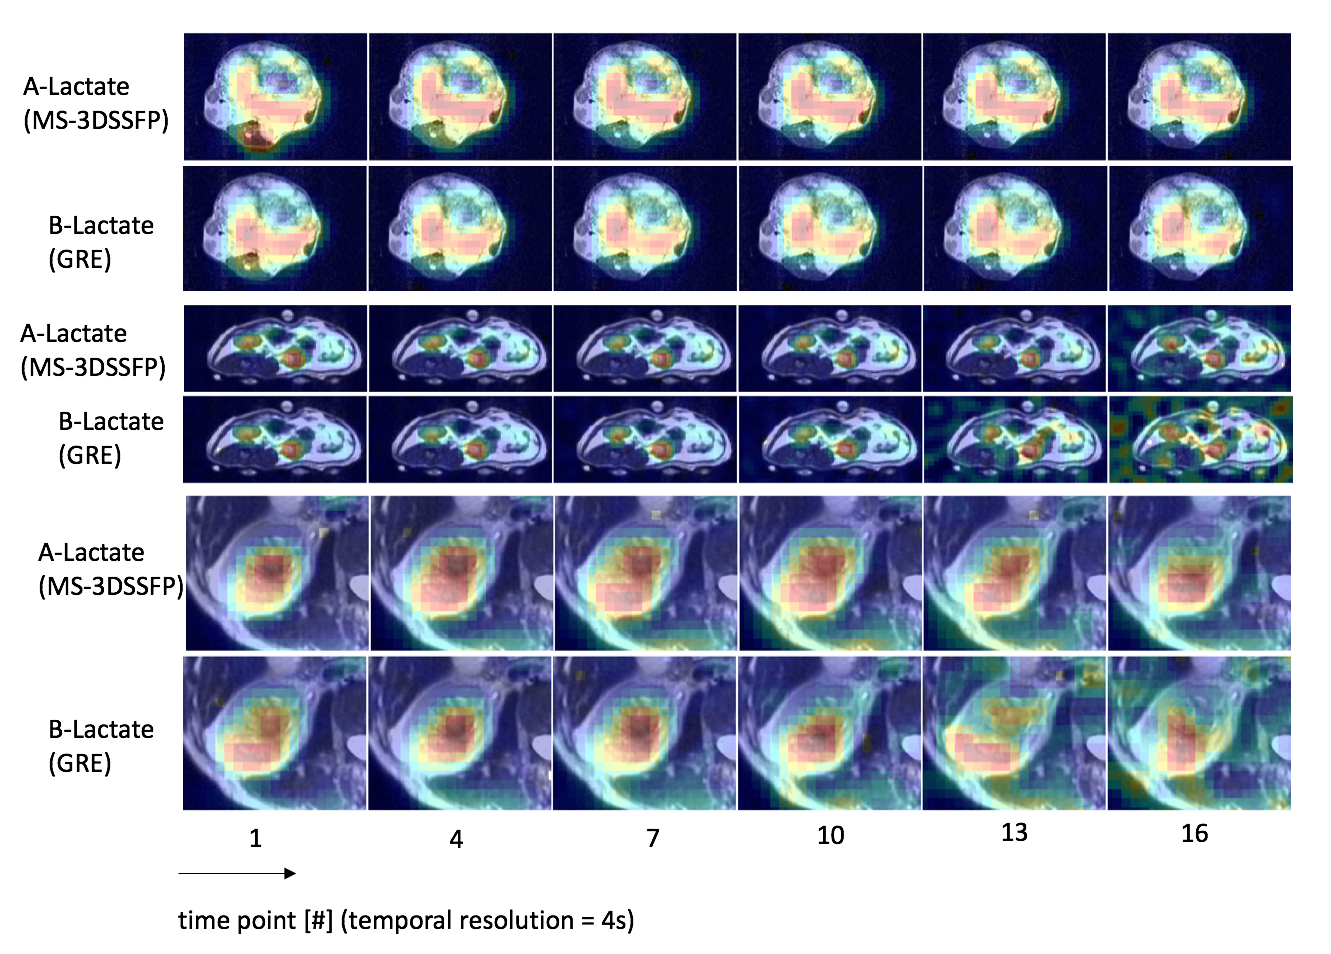
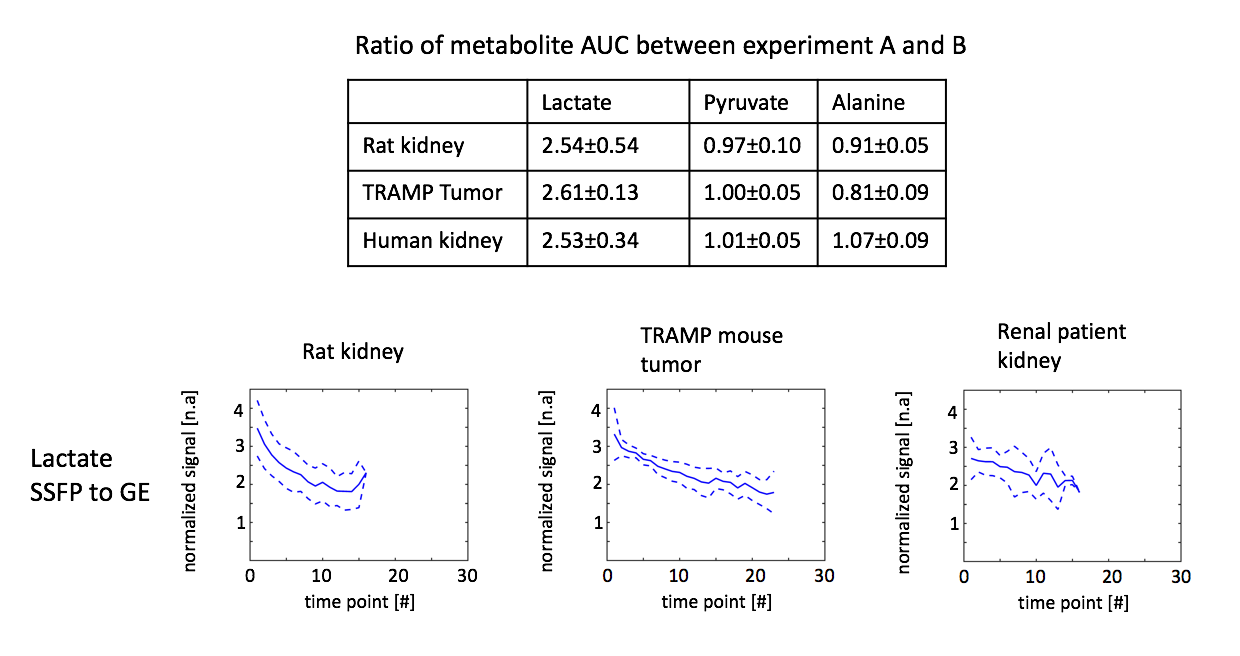
Simulated excitation profiles of the MS-3DSSFP sequence and its averaged transverse magnetization over all bSSFP echoes are shown in Figure 3. Frequency bands and stopband ripples of the excitation profiles were as desired. Most banding artifacts fell outside of the desired frequency bands except one banding artifact which was observed 18Hz upfield from the alanine frequency. Figure 4 shows representative dynamic lactate images in hyperpolarized [1-13C]pyruvate studies of TRAMP mice, healthy rats and a renal patient. Metabolites signal ratios between the two experiments are presented in Figure 5. Compared with MS-GRE sequences, the MS-3DSSFP sequence shows an overall approximately 2.5X SNR improvement and demonstrates higher SNR performance at every time point for lactate imaging in rat kidneys, tumors of TRAMP mice and human kidneys. Comparing AUC between the two experiments, there is almost no difference in pyruvate and a 5% to 20% difference in alanine AUC, which demonstrates the lactate spectral selectivity of the MS-3DSSFP sequence.Conclusion
This work describes a novel 3D bSSFP sequence that integrates a lactate specific excitation pulse and stack-of-spiral readouts for improved lactate dynamic imaging in hyperpolarized [1-13C]pyruvate studies on a clinical 3T scanner. Compared with MS-GRE sequences, the MS-3DSSFP sequence showed an overall 2.5X SNR improvement for lactate imaging in rat kidneys, tumors of TRAMP mice and human kidneys. Future work will include extending the applications of the proposed sequence for imaging other regions with acceptable B0 homogeneity such as human brain, as well as imaging other metabolites (e.g. pyruvate, bicarbonate) in hyperpolarized [1-13C]pyruvate studies.Acknowledgements
The authors thank Lucas Carvajal, Jennifer Chow, Hsin-yu Chen, Justin Delos Santos, James Slater, Namasvi Jariwala, Mary Mcpolin, Kimberly Okamoto for their help on the project. This work was supported by the National Institute of Biomedical Imaging and Bioengineering (P41EB013598, R01EB016741, U01EB026412), the American Cancer Society (RSG-18-005- 01-CCE), and a UCSF Research Evaluation and Allocation Committee Shared Instrument Award.References
1. ArdenkjærLarsen JH, Golman K, Gram A, et al. Increase of signal-to-noise of more than 10,000 times in liquid state NMR. Discov Med 2003;3:37–9.
2. Golman K, in ’t Zandt R, Thaning M. Real-time metabolic imaging. Proc Natl Acad Sci U S A 2006;103:11270–5.
3. Mayer D, Yen YF, Levin YS, et al. In vivo application of sub-second spiral chemical shift imaging (CSI) to hyperpolarized 13C metabolic imaging: comparison with phase-encoded CSI. J Magn Reson 2010;204:340– 5.
4. Reeder SB, Brittain JH, Grist TM, et al. Least-squares chemical shift separation for 13C metabolic imaging. J Magn Reson Imaging 2007;26:1145–52.
5. Wiesinger F, Weidl E, Menzel MI, et al. IDEAL spiral CSI for dynamic metabolic MR imaging of hyperpolarized [1-13C]pyruvate. Magn Reson Med 2012;68:8–16.
6. Cunningham CH, Chen AP, Lustig M, et al. Pulse sequence for dynamic volumetric imaging of hyperpolarized metabolic products. J Magn Reson 2008;193:139–46.
7. Gordon JW, Vigneron DB, Larson PEZ. Development of a symmetric echo planar imaging framework for clinical translation of rapid dynamic hyperpolarized 13C imaging. Magn Reson Med 2017;77:826–832.
8. Lau AZ, Chen AP, Hurd RE, et al. Spectral-spatial excitation for rapid imaging of DNP compounds. NMR Biomed 2011;24:988–96.
9. Svensson J. Hyperpolarized 13C MR angiography using trueFISP. Magn Reson Med 2003;50. 10. Leupold J, Månsson S, Petersson JS, et al. Fast multiecho bal- anced SSFP metabolite mapping of 1H and hyperpolarized 13C compounds. MAGMA 2009;22:251–6. 11. von Morze C, Sukumar S, Reed GD, et al. Frequency-specific SSFP for hyperpolarized 13C metabolic imaging at 14.1 T. Magn Reson Imaging 2013;31:163–70. 12. Reed GD, von Morze C, Bok R, et al. High resolution (13)C MRI with hyperpo- larized urea: in vivo T(2) mapping and (15)N labeling effects. IEEE Trans Med Imaging 2014;33:362–71.
13. Milshteyn E, von Morze C, Reed GD, et al. Development of high resolution 3D hyperpolarized carbon-13 MR molecular imaging techniques. Magn Reson Imaging 2017;38:152–162.
14. Milshteyn E, von Morze C, Gordon JW, et al. High spatiotemporal resolution bSSFP imaging of hyperpolarized [1-13C]pyruvate and [1- 13C]lactate with spectral suppression of alanine and pyruvate-hydrate. Magn Reson Med 2018;80:1048–1060.
15. Shang H, Sukumar S, von Morze C, et al. Spectrally selective three-dimensional dynamic balanced steady-state free precession for hyperpo- larized C-13 metabolic imaging with spectrally selective radiofrequency pulses. Magn Reson Med 2017;78:963–975.
16. Shang H, Larson PEZ, Kerr A, et al. Multiband RF pulses with improved performance via convex optimization. J Magn Reson 2016;262:81–90.
Figures