0692
Hyperpolarized 13C Urea laplacian relaxation processing reveals differences between healthy and ischemic renal T2 relaxation.1University of Birmingham, Birmingham, United Kingdom, 2Aarhus University, Aarhus, Denmark
Synopsis
Hyperpoalrized 13C urea T2 relaxometry has been previously used to assess the diabetic and ischemic kidney. In this study we utilise a novel fitting method (Laplacian) to visualise the extent of damage, through a reduction in bi-exponential relaxation behaviour, in a rodent model of renal ischemia.
This opens up a number of potential pre-clinical and clinical uses of hyperpoalrized 13C urea imaging providing a novel, and useful, readout of renal ischemia.
Introduction
Hyperpolarized MRI is a powerful clinical technique to probe dynamic metabolism(1). Beyond imaging metabolism, other tracers have been developed to map pH and redox status(2). 13C Urea has been previously used to image renal tissue distribution and perfusion, with results showing alterations in the renal system due to renal dysfunction (3).T2 relaxation mapping, have previously been utilized to differentiate between various functional and disease states (4–6). T2 relaxation mapping is commonly performed using either single or bi-exponential fitting processes, however the selection of the most appropriate number of components is often pre-determined before processing begins. In this study we utilize Laplacian fitting to determine the optimal number of relaxation components in the healthy and ischemic kidneys, revealing significant alterations in the relaxation behaviour of 13C,15N2-urea due to ischemic injury.
Methods
Six male Wistar rats (Taconic, Ry, DK) were included in the study. All rats were subjected to unilateral renal ischemia by clamping the left renal artery with a non- traumatic clamp for 40min and a reperfusion period of 24h, similar to a previously reported procedure(7). Immediately after the scan session, the animals were killed under the anaesthesia. Temperature and respiration was monitored during both the surgical procedure and the MRI scan session.Hyperpoalrization
Hyperpolarized 145mM urea samples were prepared by adding 200mL [13C,15N2]urea (Sigma-Aldrich, Broendby,DK), glycerol (Sigma-Aldrich, Broendby, DK) and AH111501 (GE Healthcare, Broendby, DK) (6.4M concentration) mixed ratio (0.30:0.68:0.02, respectively) to a fluidpath (GE Healthcare, Broendby, DK) and placing it in the 5T SPINlab polarizer (GE Healthcare, Broendby, DK). Samples were polarized for 2 hours and then rapidly dissolved and transferred to the rats placed in a 9.4T preclinical MR scanner (Agilent, UK) equipped with a 1H/13C dual-tuned volume coil (Doty scientific, Columbia, SC). Injection volume was approximately 1.0mL.
13C T2 MRI
Hyperpolarized 13C-urea T2 mapping was performed with single shot 2D golden-angle radial fast spin echo (repetition time = 3000 ms, echo time (TE) = 4.6 ms, ∆TE=36.8 ms, field of view = 70x70mm2, matrix = 64x64 flip angle 90/180 degrees for the slice selective excitation/refocusing pulses, 10mm slice thickness(6)). Reconstruction of the radial data was performed in Gadgetron.
Relaxometry processing
Laplacian fitting was performed on experimental data using a regularized least-squares approach in Matlab with no prior assumptions on the initial relaxation distribution, constrained between 1 and 2000ms (8). In vivo fitting was halted when either the Chi2 of the time domain fit was greater than 98%, or an iteration limit was reached. If Chi2 was not above 98% after reaching the iteration limit, data were discarded.
Regions of interest
Regions of interest were drawn in Matlab to segment the whole kidney in the axial plane, to produce IRI and healthy kidney masks.
Statistical analysis
The relaxation pool distribution was determined using an automated Gaussian fit to each relaxation peak, assessing for mono- and bi- exponential behaviour in each voxel. The percentage of voxels in an IRI or healthy mask exhibiting a mono- and bi- exponential decay was calculated over all subjects and averaged. Differences in the % of mono-, and bi- exponential voxels between healthy and IRI kidneys was assessed using a paired t-test, assuming significance at p<0.05.
Results
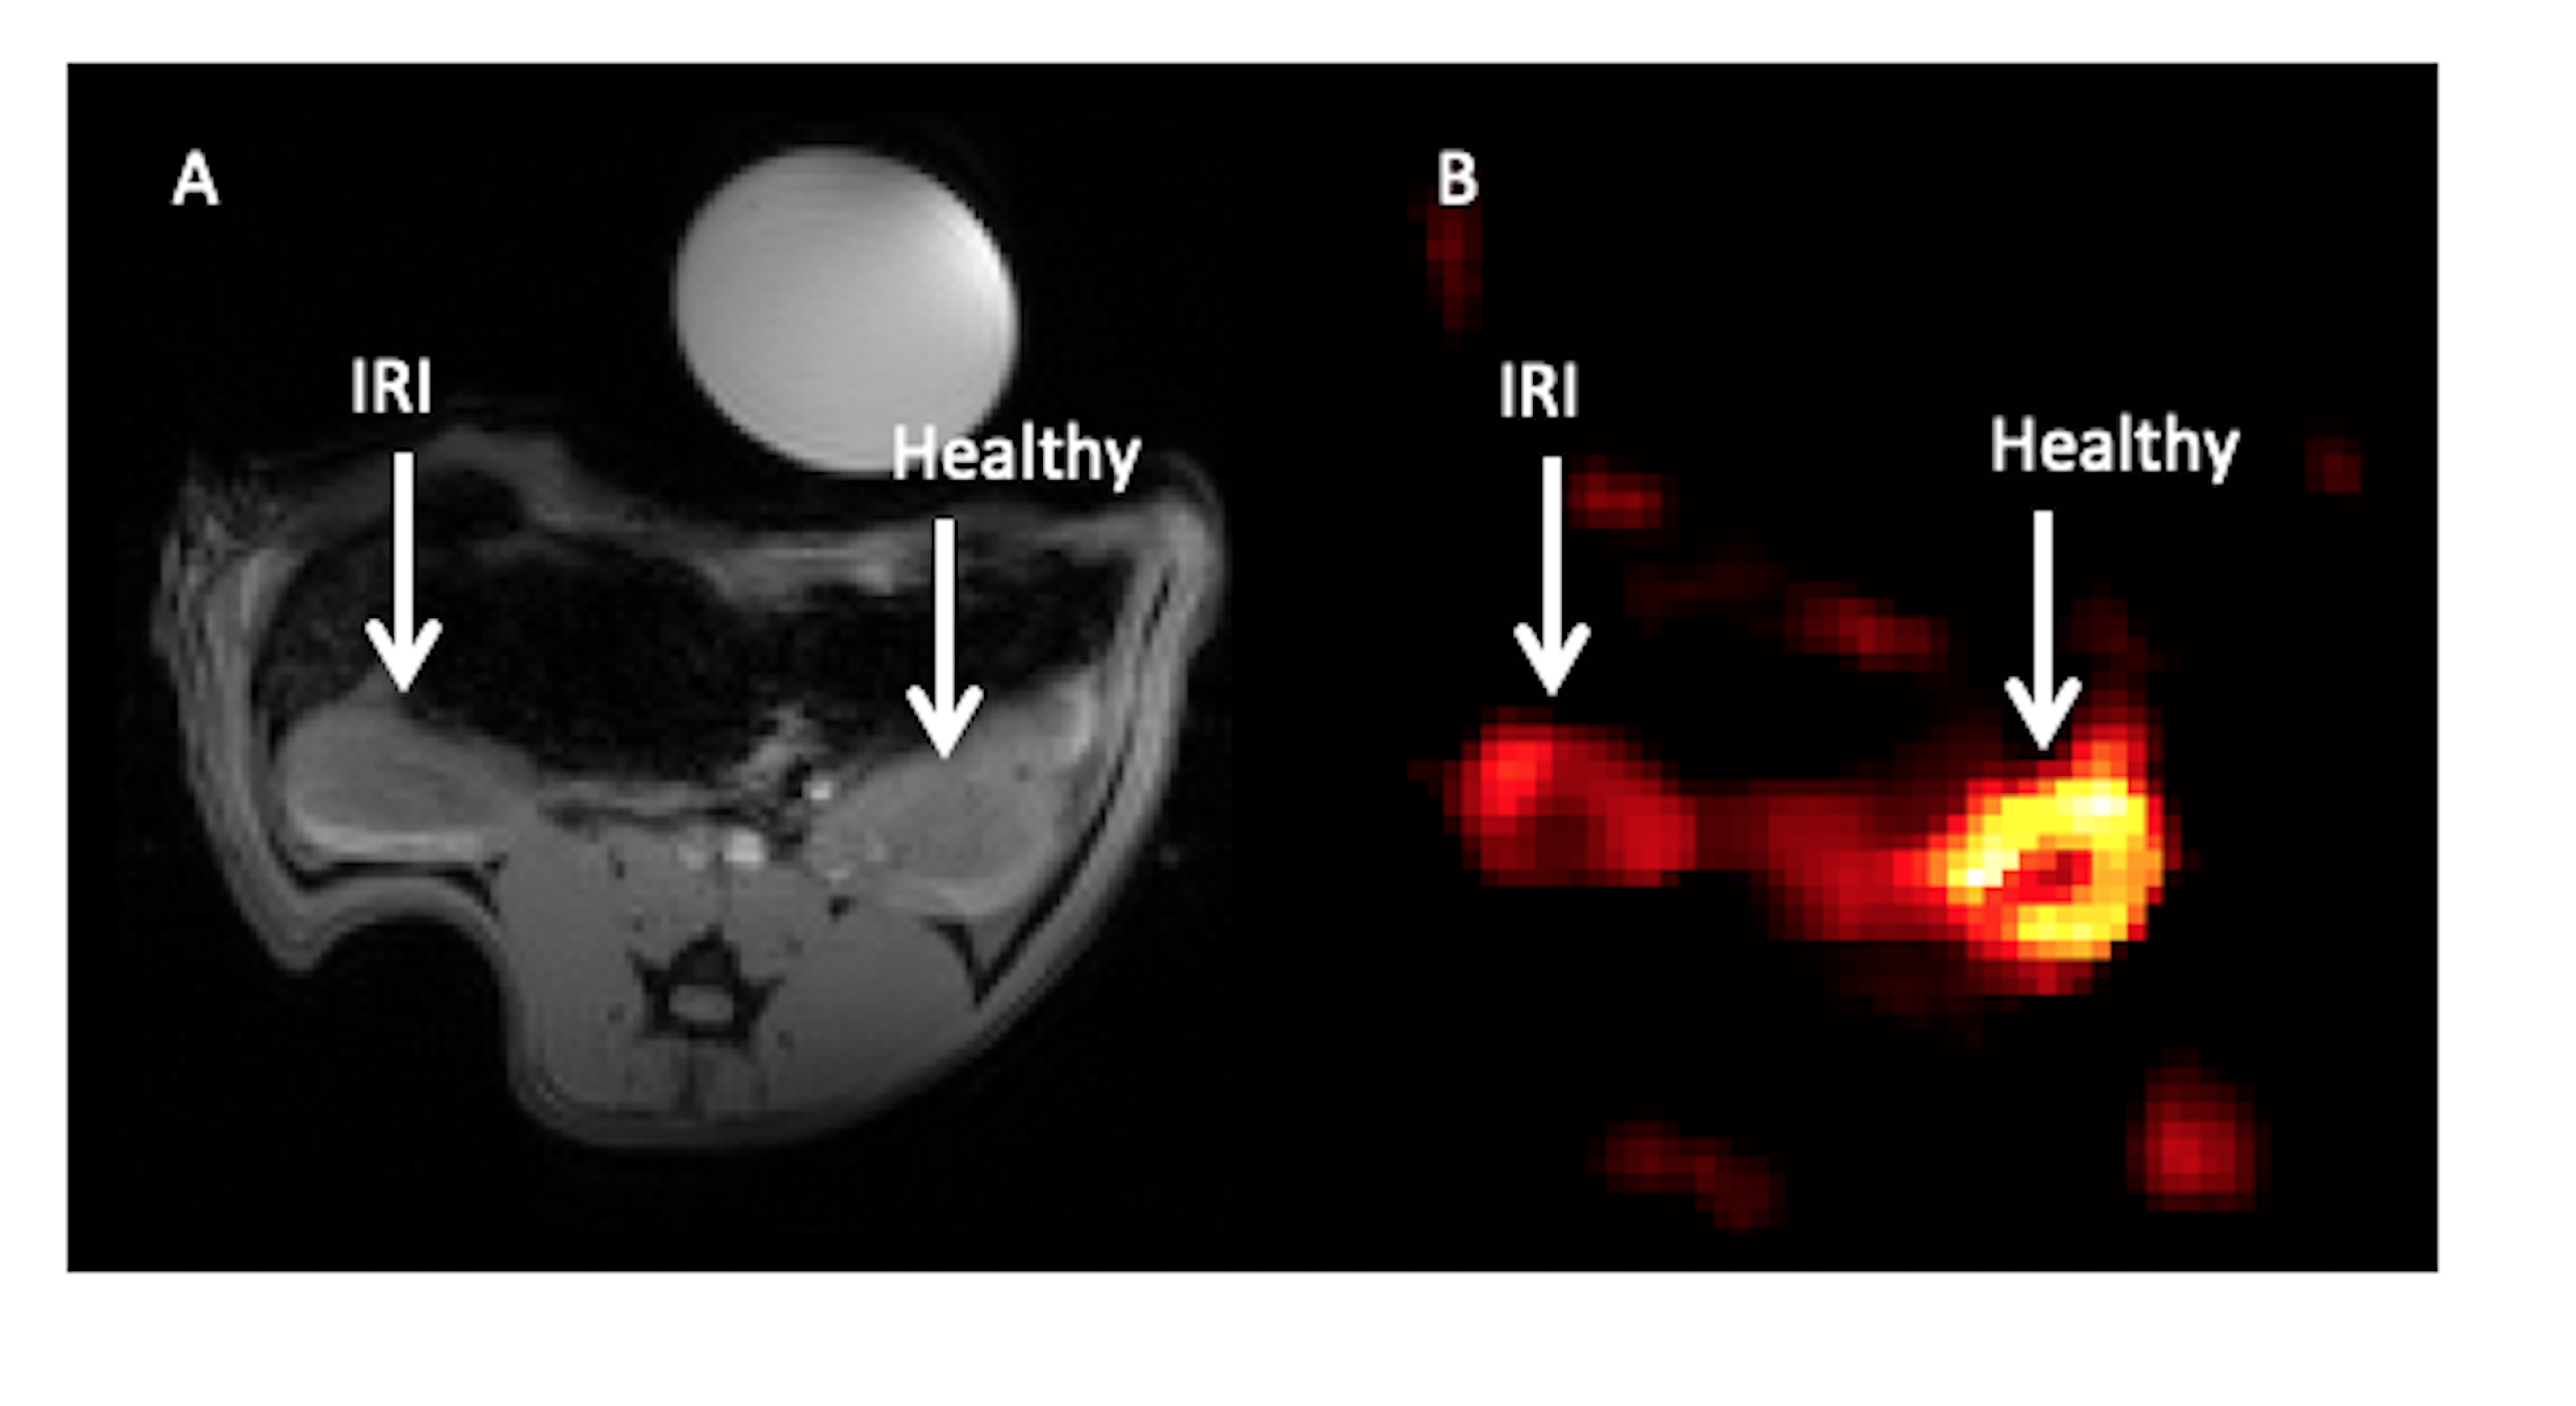
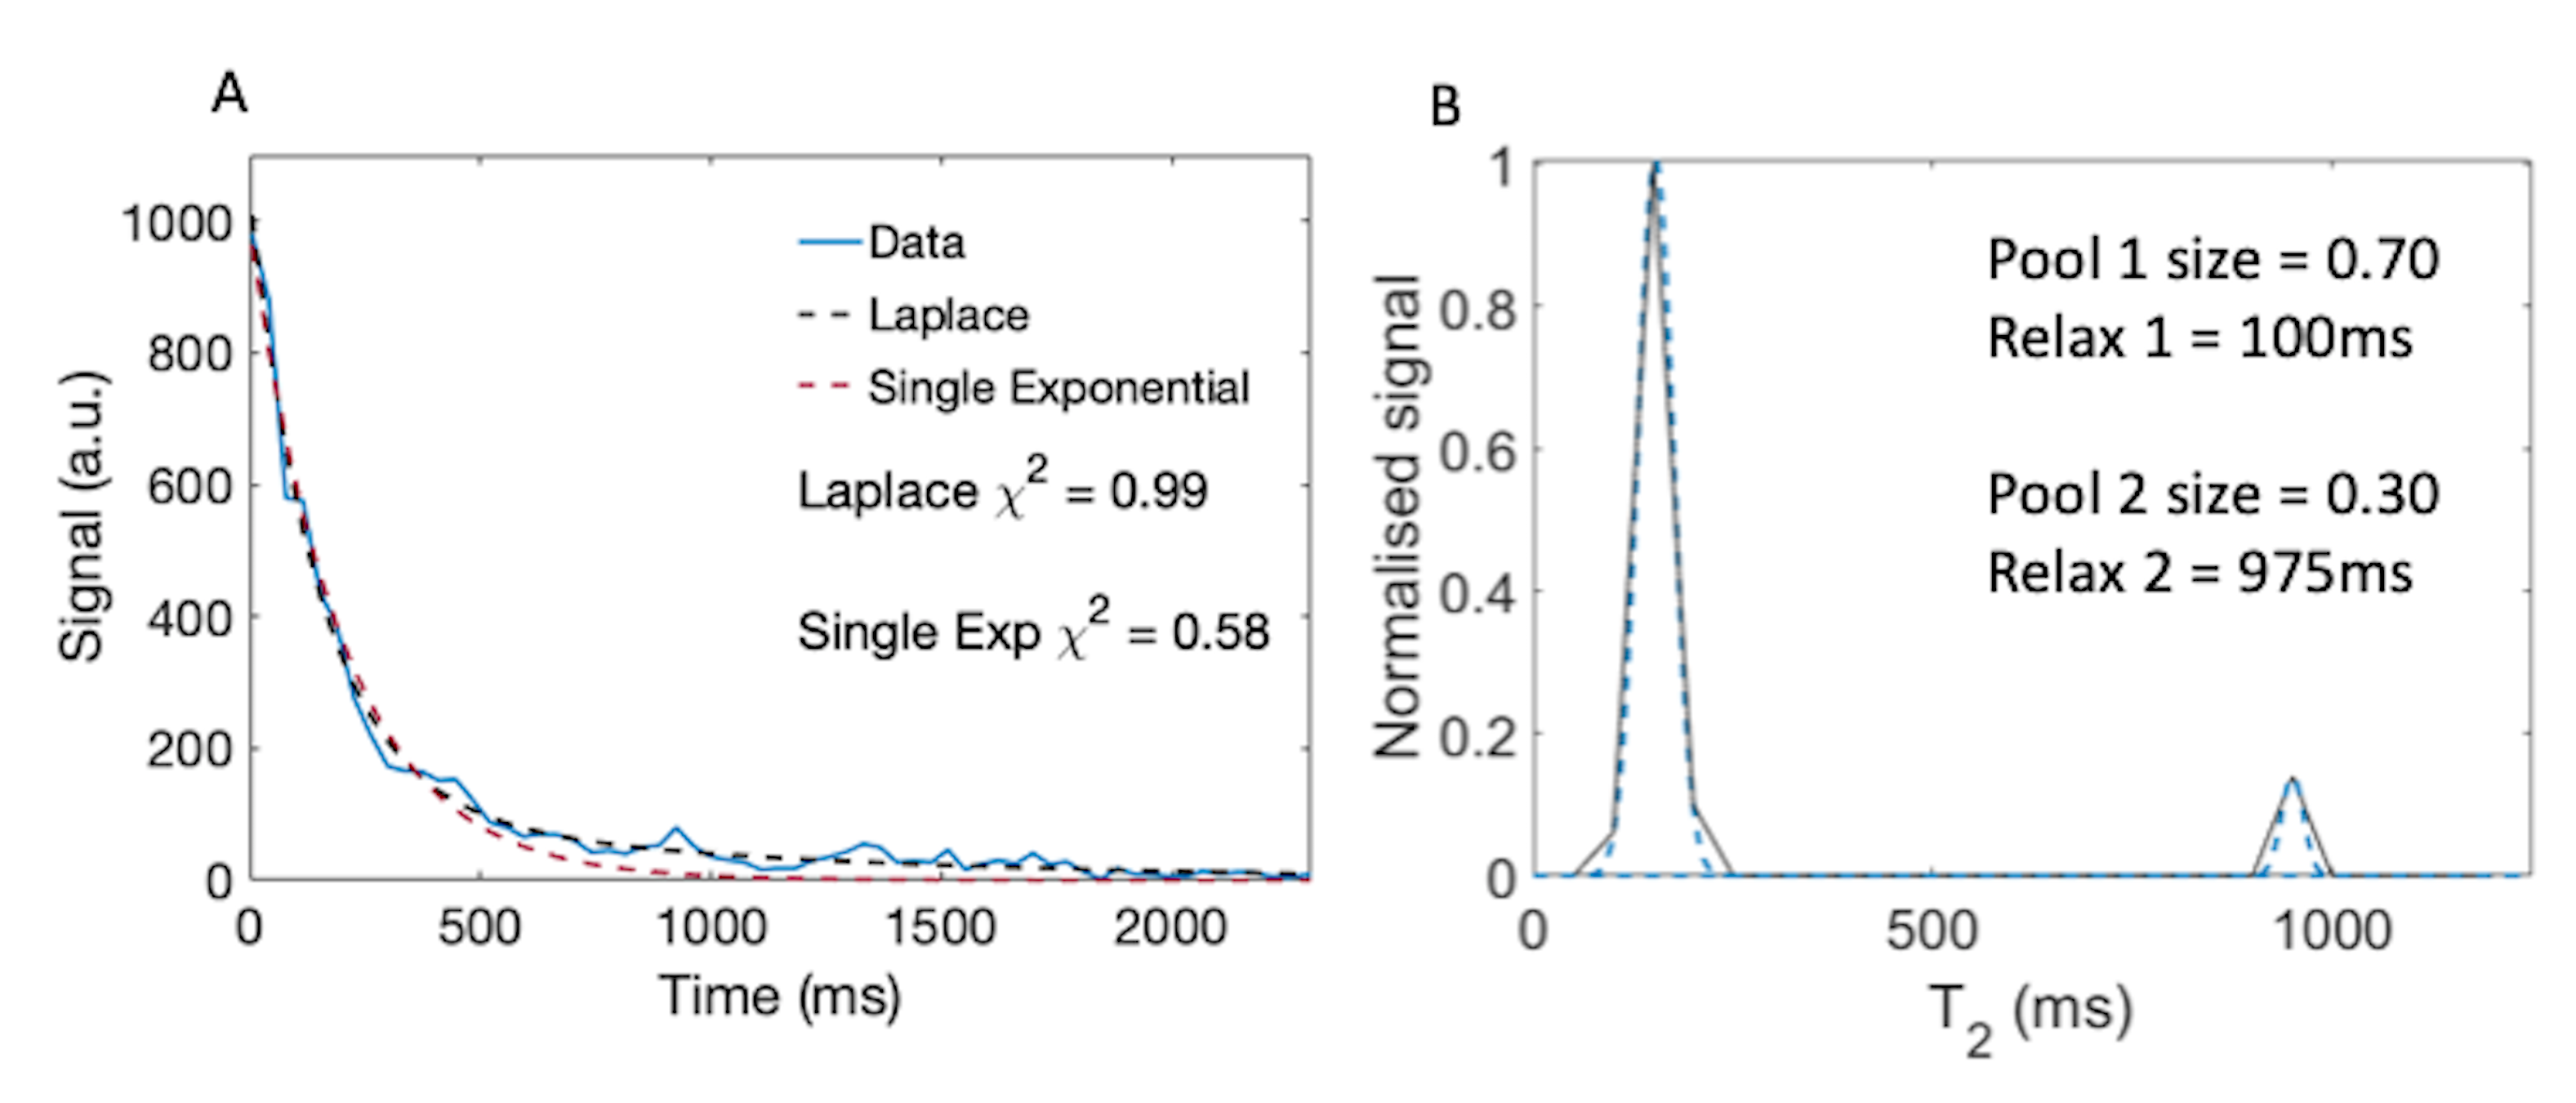
Laplacian fitting reveals multi-exponential relaxation of hyperpolarized urea in the IRI and healthy kidney.Imaging was successful in all rats, with example 1H and 13C imaging data shown in figure 1 A and B, respectively. Fitting results showed a number of relaxation pools in both the healthy and IRI kidney, resulting in multi-exponential behavior. An example fit showing a comparison of single and Laplacian fitting in a healthy kidney voxel is shown in figure 2 with Chi2 for single exponential and Laplacian are 0.58 and 0.99 respectively.
AKI causes a decrease in bi-exponential behavior in the injured renal system.
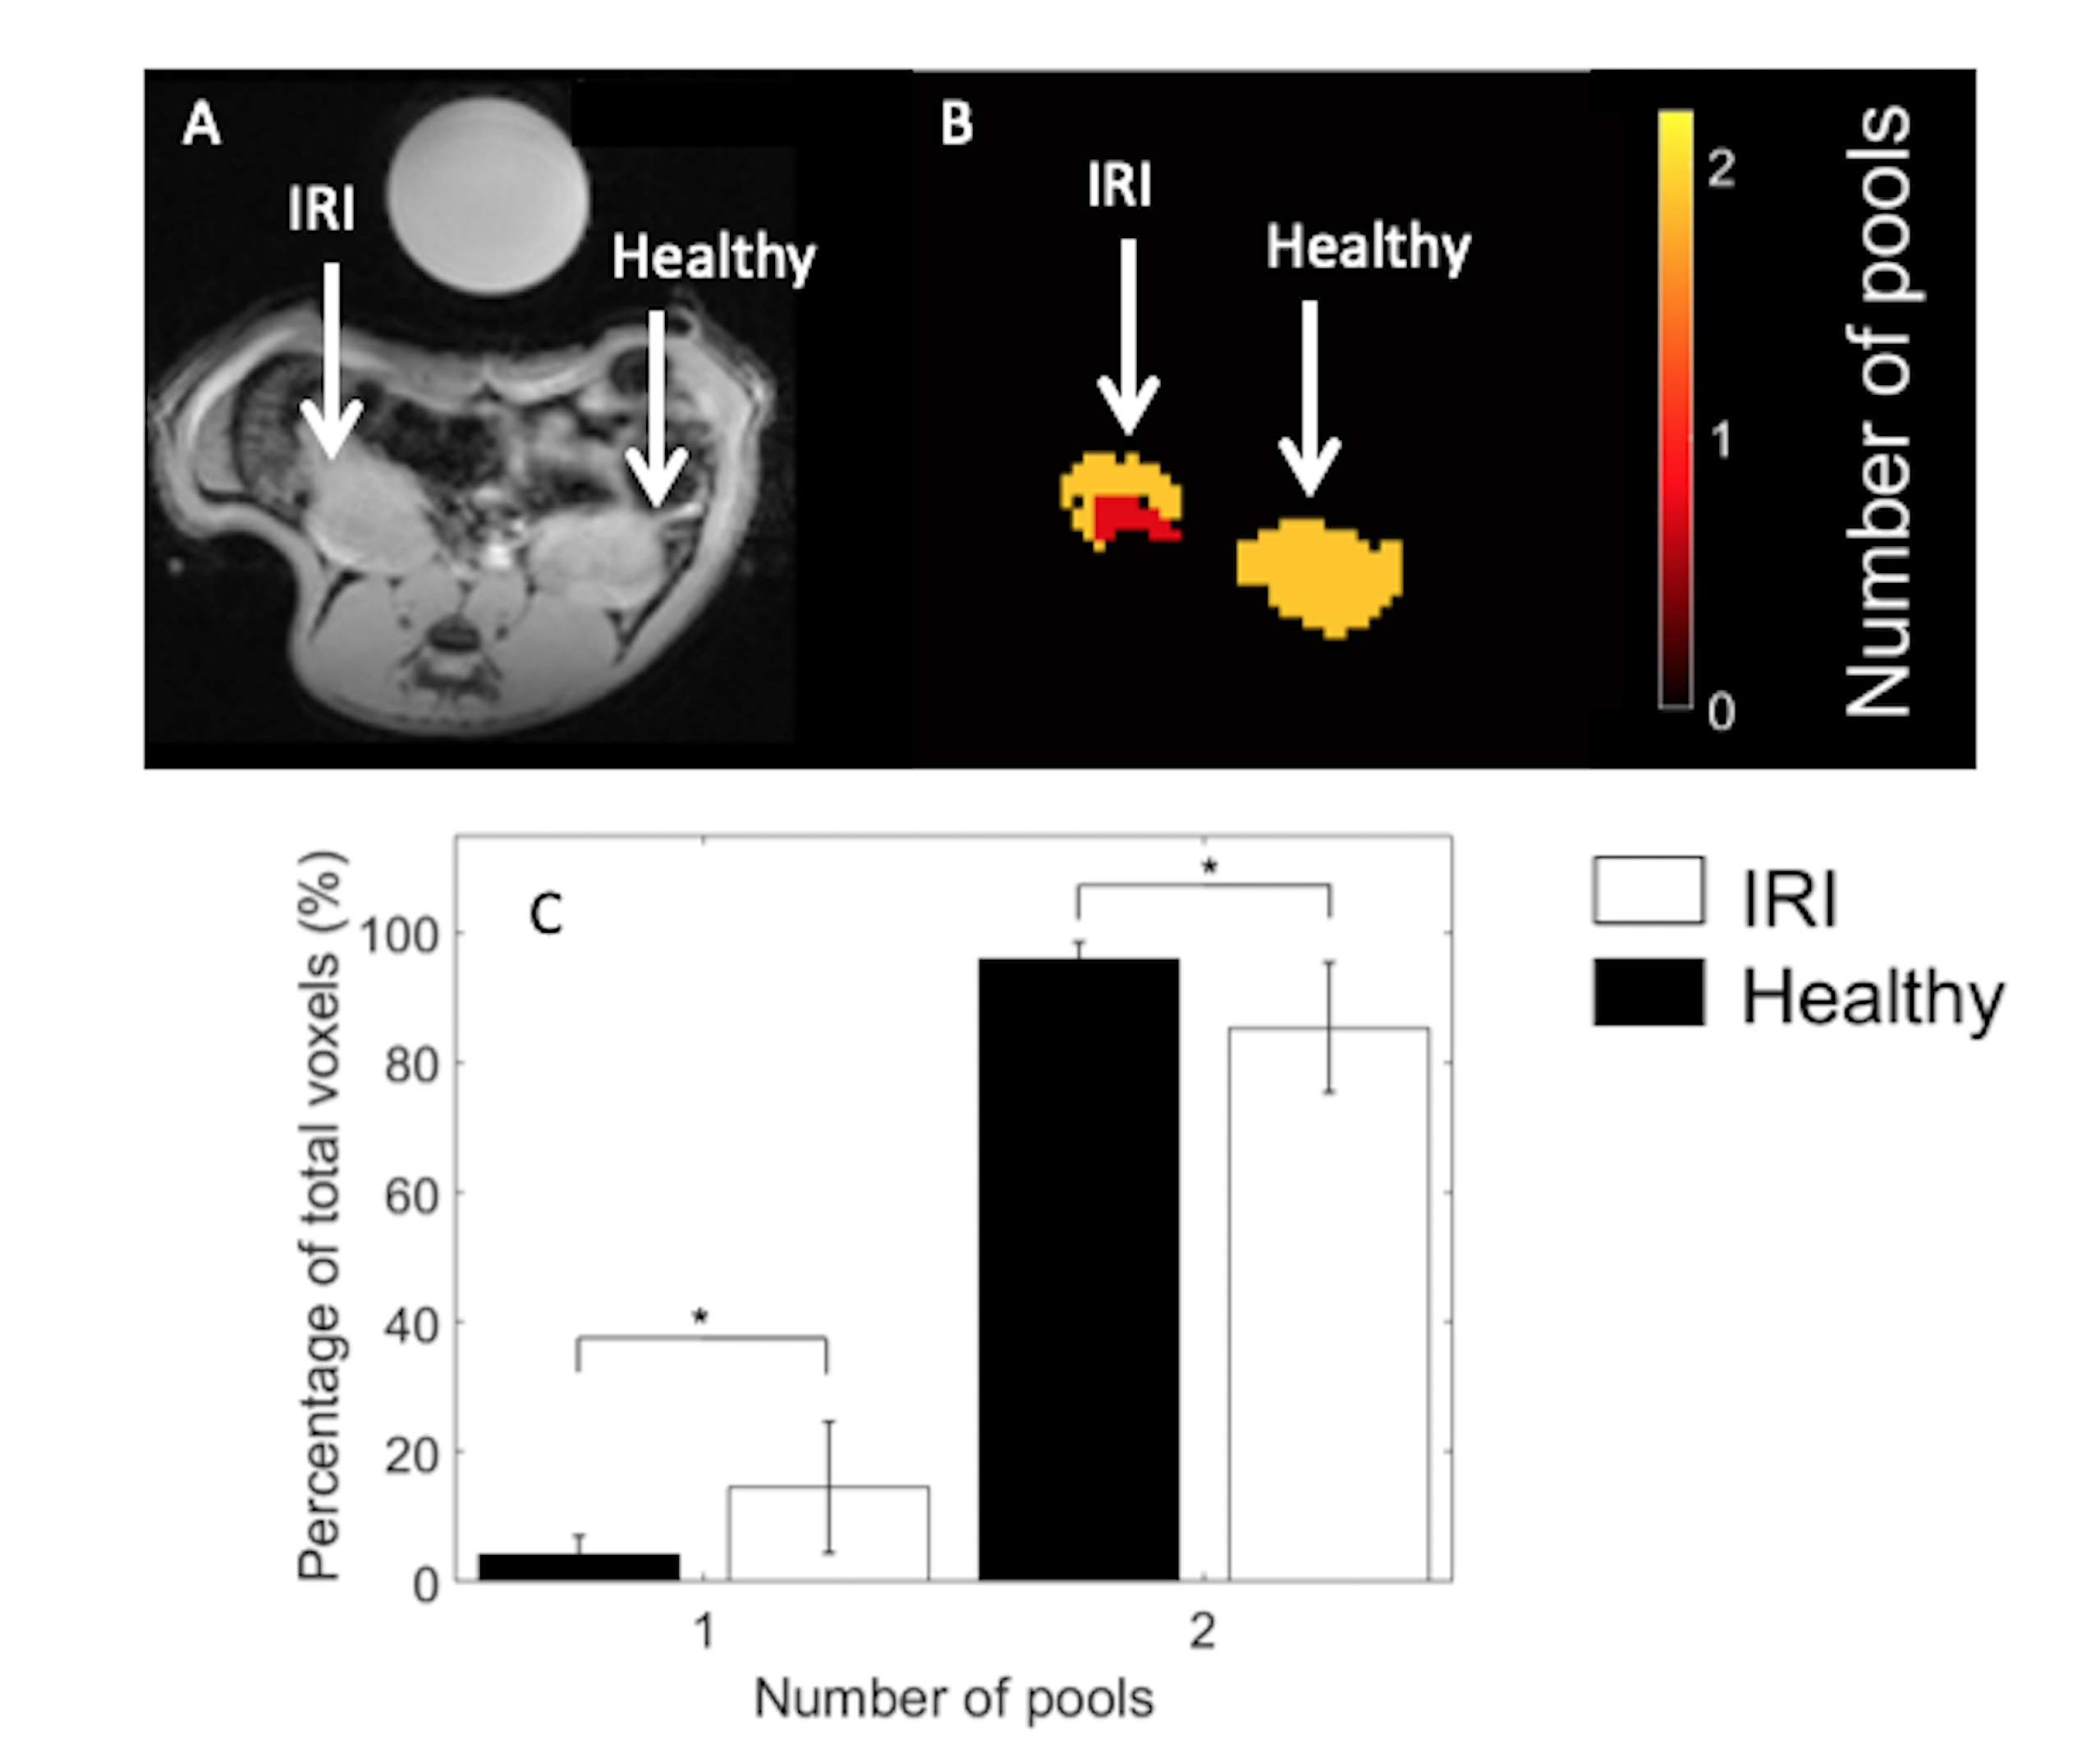
There was a marked difference in the number of mono- and bi-exponential pools between the IRI and healthy kidneys (14 ± 10% vs 4 ± 2%, 85 ± 10% vs 95 ± 3%, respectively, p < 0.05) with a visual injury seen in the IRI kidney pools map (see figure 3 A, B, and C for imaging and D for pool size results). There was a significant difference between the healthy and IRI long relaxation components (664 ± 52 ms vs 303 ± 27 ms, respectively, p < 0.001) but not the short components (139 ± 23 ms vs 101 ± 57 ms, respectively, p > 0.05).
Discussiom
This study has shown the power of hyperpolarized 13C,15N2-urea and multi-exponential fitting in the visualization and quantification in a rodent model of acute kidney injury. Results showed a significant increase in monoexponential relaxation induced by ischemia, with a subsequent decrease in the long relaxation component also observed. These results provide evidence for the use of hyperpolarized relaxation mapping for the diagnosis and further understanding of acute kidney injury.Acknowledgements
The authors would like to thank the Little Princess Trust and the Lundbeck foundation for funding this work.References
1. Zaccagna F, Grist JT, Deen SS, et al. Hyperpolarized carbon-13 magnetic resonance spectroscopic imaging: a clinical tool for studying tumour metabolism. Br. J. Radiol. 2018;91:20170688.
2. Gallagher FA, Sladen H, Kettunen MI, et al. Carbonic Anhydrase Activity Monitored in Vivo by Hyperpolarized13C-Magnetic Resonance Spectroscopy Demonstrates Its Importance for pH Regulation in Tumors. Cancer Res. 2015;75:4109–4118.
3. Mariager CØ, Nielsen PM, Qi H, Ringgaard S, Laustsen C. Hyperpolarized 13 C , 15 N 2 -urea T 2 Relaxation Changes in Acute Kidney Injury. 2018;702:696–702.
4. Reed GD, Morze C von., Bok R, Koelsch. BL, Criekinge MV. High Resolution 13 C MRI With Hyperpolarized Urea: In Vivo T2 Mapping and 15 N Labeling Effects. 2014;33:759–785.
5. von Morze C, Bok R a, Reed GD, Ardenkjaer-Larsen JH, Kurhanewicz J, Vigneron DB. Simultaneous multiagent hyperpolarized (13)C perfusion imaging. Magn. Reson. Med. 2014;72:1599–609.
6. Laustsen C, Stokholm Norlinger T, Christoffer Hansen D, et al. Hyperpolarized 13C urea relaxation mechanism reveals renal changes in diabetic nephropathy. Magn. Reson. Med. 2016;75:515–518.
7. Nielsen PM, Laustsen C, Bertelsen LB, et al. In situ lactate dehydrogenase activity : a novel renal cortical imaging biomarker of tubular injury? Am J Physiol Ren. Physiol 2019;312:465–473.
8. Provencher SW. CONTIN : A general purpose constrained regularization program for inverting noisy linear algebraic and integral equations. Comput. Phys. Commun. 1982;27:229–242.
Figures