0690
Assessment of Intracranial Metastases in Patients using Hyperpolarized 13C MRI1Medical Biophysics, University of Toronto, Toronto, ON, Canada, 2Physical Sciences, Sunnybrook Research Institute, Toronto, ON, Canada, 3Radiation Oncology, Sunnybrook Health Sciences Centre, Toronto, ON, Canada, 4GE Healthcare Technologies, Toronto, ON, Canada, 5Pharmacy, Sunnybrook Health Sciences Centre, Toronto, ON, Canada, 6Diagostic Imaging, Trillium Health Partners, Mississauga, ON, Canada, 7Radiology, Sunnybrook Health Sciences Centre, Toronto, ON, Canada
Synopsis
Hyperpolarized 13C MRI was used to acquire images of [1-13C]lactate and 13C-bicarbonate from the injected [1-13C]pyruvate in 8 patients with brain metastases. Lesions were manually contoured and the mean tumor 13C-lactate signal was converted to a z-score by extending the approach previously described in Lee et al. (2019). As expected, the z-score ranks of the anatomical regions were less concordant in patients compared to controls. A range of lactate z-scores were observed in metastatic lesions, showing metabolic heterogeneity consistent with the known heterogeneity in metastatic features and clinical status. The lesions with the highest and 5th highest lactate z-scores progressed.
Introduction
Brain metastases develop in upwards of 40% of cancer patients1. Radiation therapy is a standard treatment approach, requiring MRI to monitor changes in lesion size in order to assess treatment response. Significant clinical heterogeneity in brain metastases patients makes it difficult to predict treatment response and changes in lesion size can take several months to manifest2. Hyperpolarized (HP) 13C MRI3 is a new imaging approach that has the potential to predict radiation treatment response at an earlier time point by probing the changes in tumour metabolism. In particular, tumour lactate concentration is known to be positively correlated with metastatic potential and radiation resistance4,5.The consistent 13C-lactate signal topography of the human brain following the injection of HP [1-13C]pyruvate has been previously demonstrated6,7. The strong background 13C-lactate signals from brain parenchyma confounds the measurement of 13C-lactate signal from metastatic lesions. In this study, we extended the segmentation-based approach previously6 applied to characterize 13C-lactate signals from control human brains to normalize the lactate signal from metastatic lesions by converting the 13C-lactate signals into z-scores. The tumour lactate z-scores were compared to the primary tumour type, lesion location and the treatment response status.
Methods
Image acquisition Written informed consent was obtained from patients with one or more newly developed brain metastases (n=8). Prior to being positioned head-first in a GE MR750 3.0T MRI scanner (GE Healthcare, Waukesha, WI), a 20-gauge intravenous catheter was inserted into the patient’s forearm. The patient’s head was secured in the support for head-coil base for the standard 8-channel neurovascular receive array (Invivo Inc.). This support can be docked with either the 8-channel 1H array or a home-built single-tuned 13C birdcage without moving the patient’s head.At the start of the exam, 1H localizer data and 1H multi-echo reference data were acquired using the scanner’s body coil. The 13C birdcage was put in place and the dose of HP [1-13C]pyruvate was injected (0.1mmol/kg dose at 4mL/s followed by a 25mL normal saline flush at 5mL/s). Lactate, bicarbonate and pyruvate images were sequentially acquired using spectral-spatial excitation8 and 3D dual-echo EPI readout9 (5s temporal resolution; axial prescription; 1.5cm-isotropic resolution with FOV 24x24x36cm3). For anatomical reference, T1-weighted images were acquired using fast spoiled GRE (axial, FOV 25.6x25.6cm2, 1mm-isotropic resolution, TR 7.6ms, TE 2.9ms, flip angle 11°) with the 1H array.
Image Reconstruction 13C images were reconstructed offline using MATLAB R2013a (The MathWorks Inc., Natick, MA) using a data-driven approach to correct for geometric distortion9. The final 13C images were generated by summing the odd and even echoes and summing the individual timepoints over the full 60s acquisition window to provide maximal SNR.
Structural Segmentation Structural segmentation of the 13C images was performed using the LONI pipeline processing environment6,10. The original 13C images were resampled to match the coordinates and matrix size of the T1-weighted images in MATLAB and segmented into the 56 structural regions contained in the LPBA40 atlas using the LONI pipeline. For each subject, the mean 13C signal from each atlas region was converted to a z-score by subtracting the mean of all regions and dividing by the standard deviation across regions for that subject.
Each metastatic lesion ROI was manually contoured on the T1-weighted images by a radiation oncologist. The mean 13C-lactate signal for each lesion was then converted to a z-score using the mean and standard deviation of the 56 atlas regions.
Results and Discussion
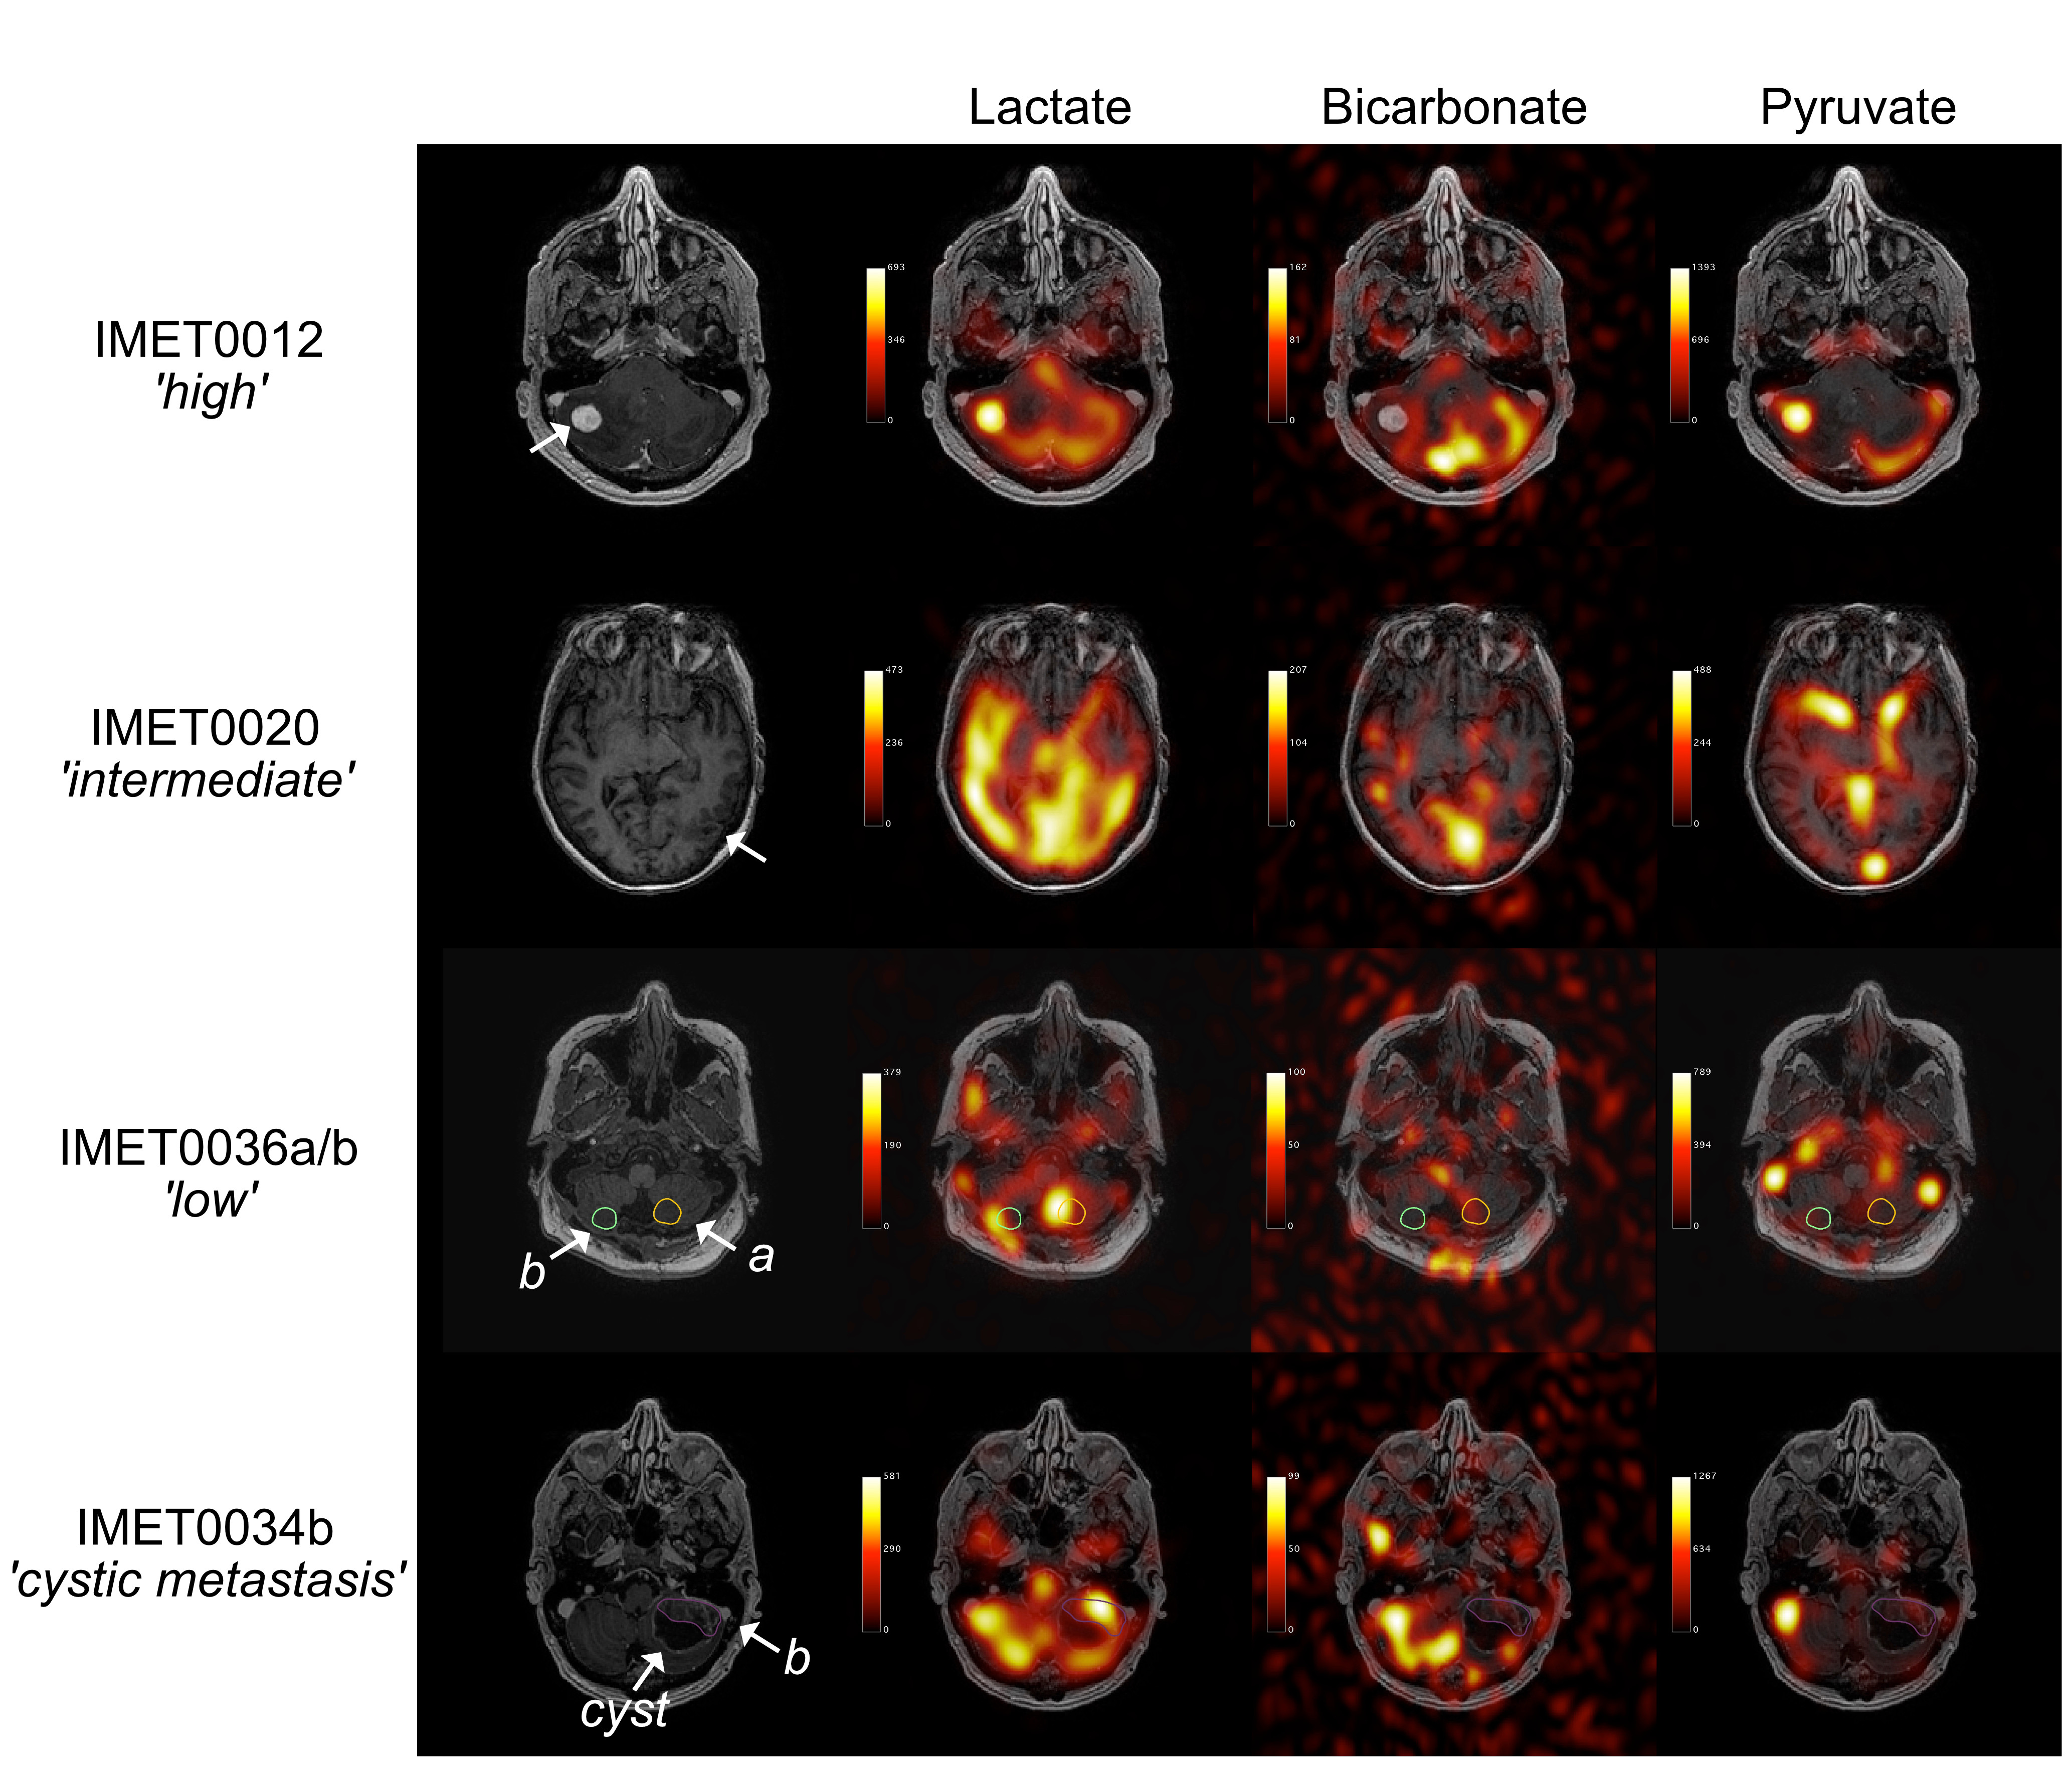
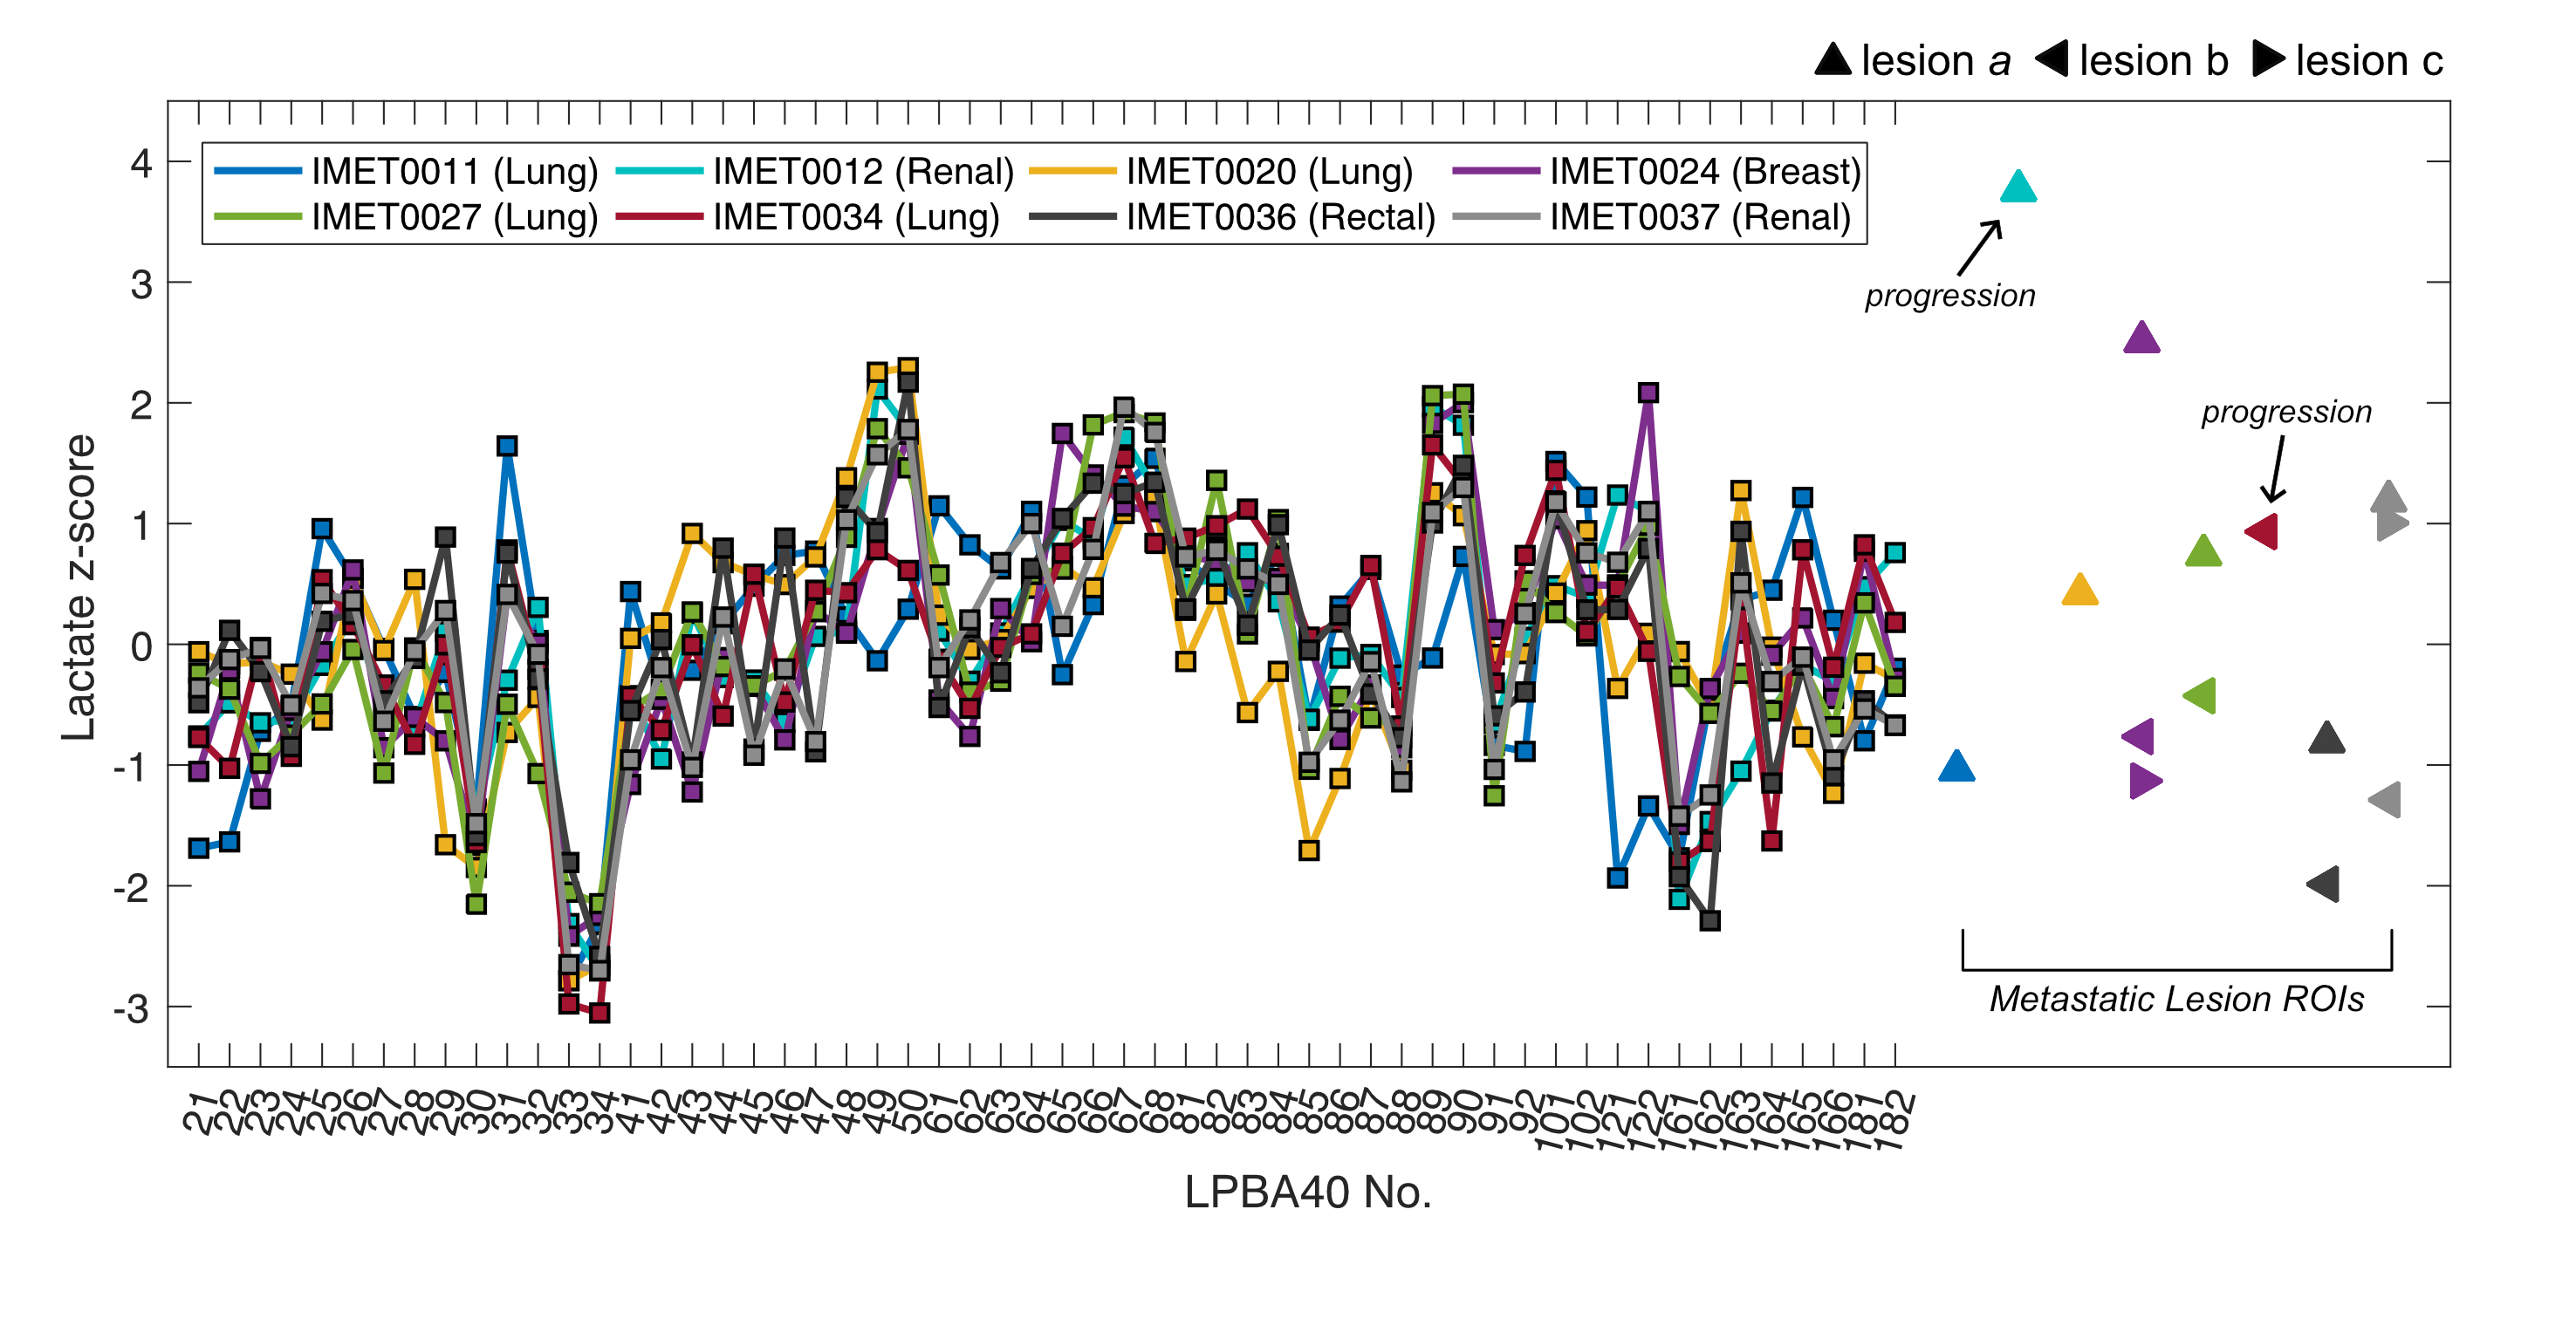
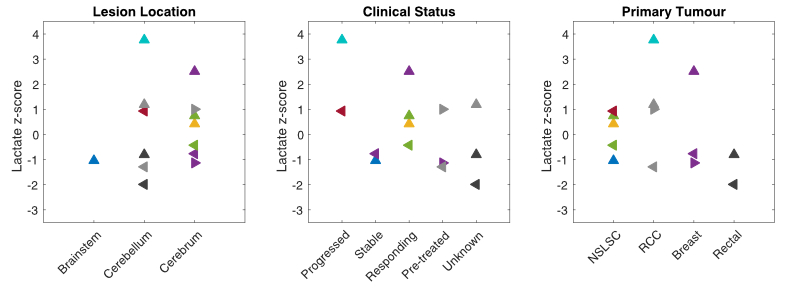
Selected examples of 13C-lactate, 13C-pyruvate, and 13C-bicarbonate images are shown in Fig. 1. For each patient, lactate z-scores from each LPBA40 atlas region and the lesion ROIs are illustrated in Fig. 2 and corresponding information is summarized in a table in Fig. 3. As expected, the ranking of z-scores showed weaker concordance for this patient group compared to the previously reported values from 14 control participants6 (W = 0.66 and 0.83, respectively). A range of lactate z-scores (-1.29 to 3.76) was observed amongst different lesions, as well as between lesions in a single patient.The lesion (IMET0012a) with the highest z-score (3.76) progressed after stereotactic radiosurgery. Lesion IMET0034b had a lactate z-score = 0.93 (5th highest) progressed and was surgically resected at 1 month post-imaging. All of the lesions with lactate z-score below the median were either stable or responsive. The relationship between lactate z-score, lesion location, current clinical status, and primary tumour type are shown in Fig. 4.
In future work, a total of 10 patients with brain metastases will be scanned under the current protocol and these patients’ clinical progression will be monitored up to 6 months post 13C-imaging to evaluate the potential role of lactate z-score in characterizing and predicting treatment outcomes for individual lesions.
Conclusion
A segmentation-based approach was used to calculate lactate z-scores for metastatic lesions in patients with brain metastases. A range of lactate z-scores were observed in metastatic lesions, showing metabolic heterogeneity consistent with the known heterogeneity in metastatic features and clinical status. The lesions with the highest and 5th highest lactate z-score progressed, and all of the lesions with lactate z-score below the median were either stable or responsive.Acknowledgements
The authors thank Julie Green and Sumeet Sachdeva for coordinating the study, and Ruby Endre and Garry Detzler for MR technical support. Funding support from the Brain Canada and Canadian Institutes for Health Research.References
1. DeVita, Vincent T., Theodore S. Lawrence, and Steven A. Rosenberg, eds. DeVita, Hellman, and Rosenberg's cancer: principles & practice of oncology. Vol.
2. Lippincott Williams & Wilkins, 2008.Lin, Xuling, and Lisa M. DeAngelis. "Treatment of brain metastases." Journal of clinical oncology 33.30 (2015): 3475.
3. Ardenkjær-Larsen, Jan H., et al. "Increase in signal-to-noise ratio of> 10,000 times in liquid-state NMR." Proceedings of the National Academy of Sciences 100.18 (2003): 10158-10163.
4. Walenta, Stefan, et al. "High lactate levels predict likelihood of metastases, tumor recurrence, and restricted patient survival in human cervical cancers." Cancer research 60.4 (2000): 916-921.
5. Quennet, Verena, et al. "Tumor lactate content predicts for response to fractionated irradiation of human squamous cell carcinomas in nude mice." Radiotherapy and Oncology 81.2 (2006): 130-135.
6. Lee, Casey Y., et al. "Lactate topography of the human brain using hyperpolarized 13C-MRI." NeuroImage 204 (2020): 116202.
7. Grist, James T., et al. "Quantifying normal human brain metabolism using hyperpolarized [1–13C] pyruvate and magnetic resonance imaging." NeuroImage 189 (2019): 171-179.
8. Cunningham, Charles H., et al. "Pulse sequence for dynamic volumetric imaging of hyperpolarized metabolic products." Journal of magnetic resonance 193.1 (2008): 139-146.
9. Geraghty, Benjamin J., et al. "Dual‐Echo EPI sequence for integrated distortion correction in 3D time‐resolved hyperpolarized 13C MRI." Magnetic resonance in medicine 79.2 (2018): 643-653.
10. Rex, David E., Jeffrey Q. Ma, and Arthur W. Toga. "The LONI pipeline processing environment." Neuroimage 19.3 (2003): 1033-1048.
Figures