0687
Initial Experience of Hyperpolarized 13C Pyruvate MRI in Patients with Renal Tumors1University of California, San Francisco, San Francisco, CA, United States
Synopsis
We present our initial experience of applying HP 13C pyruvate MRI in patients with renal tumors. Distinct tumor metabolic pattern and heterogeneity can be observed on HP 13C pyruvate MRI. Our data from subjects with two injections also suggests that the metabolite measurements are reproducible. This initial experience paves the way for this metabolic imaging technique to be applied for differentiating between benign renal tumors, low grade RCCs and high grade RCCs.
Introduction
The incidence of renal tumors has risen significantly in the last 20 years. Neither conventional imaging nor tumor biopsy can reliably differentiate between benign renal tumors, low grade renal cell carcinomas (RCCs) and high grade RCCs. The diagnostic ambiguity has resulted in many benign tumors and indolent RCCs to be unnecessarily treated by surgery, with surgical risks and risk of chronic kidney disease. Previous studies1,2 have shown that increased glycolysis with lactate production is strongly associated with RCC presence and correlates with high grade tumor and worse prognosis. This metabolic reprogramming can be noninvasively interrogated using magnetic resonance imaging with hyperpolarized (HP) 13C-labeled compounds via dynamic nuclear polarization (DNP).3,4 In this work, we present our initial experience of applying HP 13C pyruvate MRI to patients with renal tumors.Methods
Eight subjects with renal tumors and planned surgical resection were recruited under an institutional review board approved protocol. MRI scans were performed on a GE 3T scanner following injection of [1-13C]pyruvate pre-polarized in a 5T GE SPINlab polarizer. 13C kidney images of [1-13C] pyruvate and [1-13C] lactate were acquired using spectral-spatial excitation and multi-slice 2D spiral gradient-echo readouts,5 with a clamshell transmit coil and an 8-channel paddle receive array.6 Scan parameters were 1.5cm in-plane resolution, 4s temporal resolution, 21mm slice thickness, 20° flip angle for pyruvate and 30° flip angle for lactate. 13C acquisitions were triggered 6s after bolus arrival using an integrated RT-Hawk platform (HeartVista) with real-time frequency and B1 calibration.5 Images were acquired during free-breathing. For several patients, [1-13C]alanine kidney images were also acquired and/or a metabolite-specific bSSFP sequence (described in a separate ISMRM abstract) was used for lactate imaging.Results and Discussion
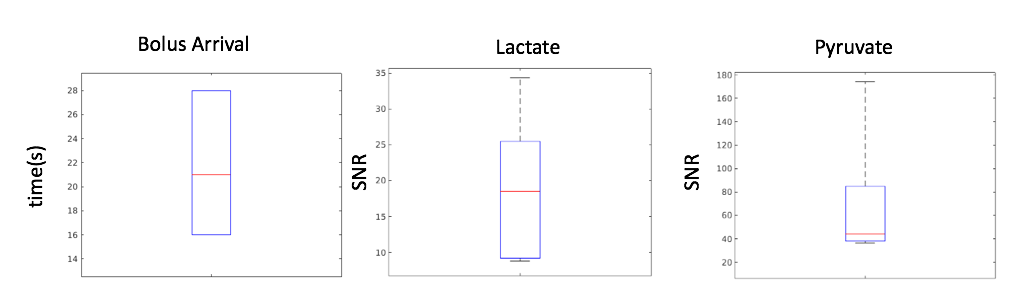
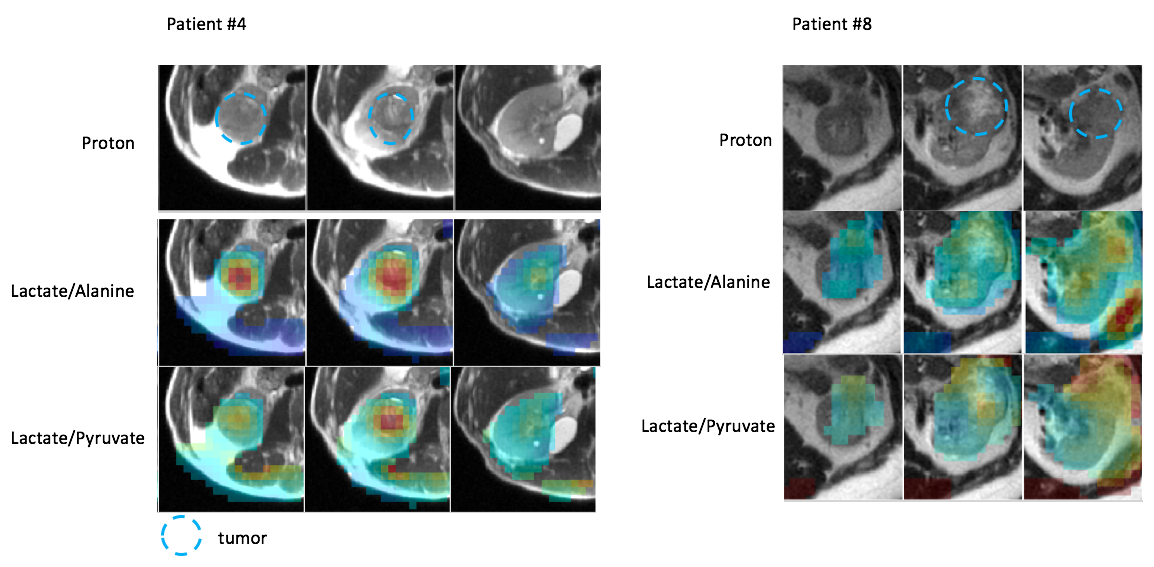
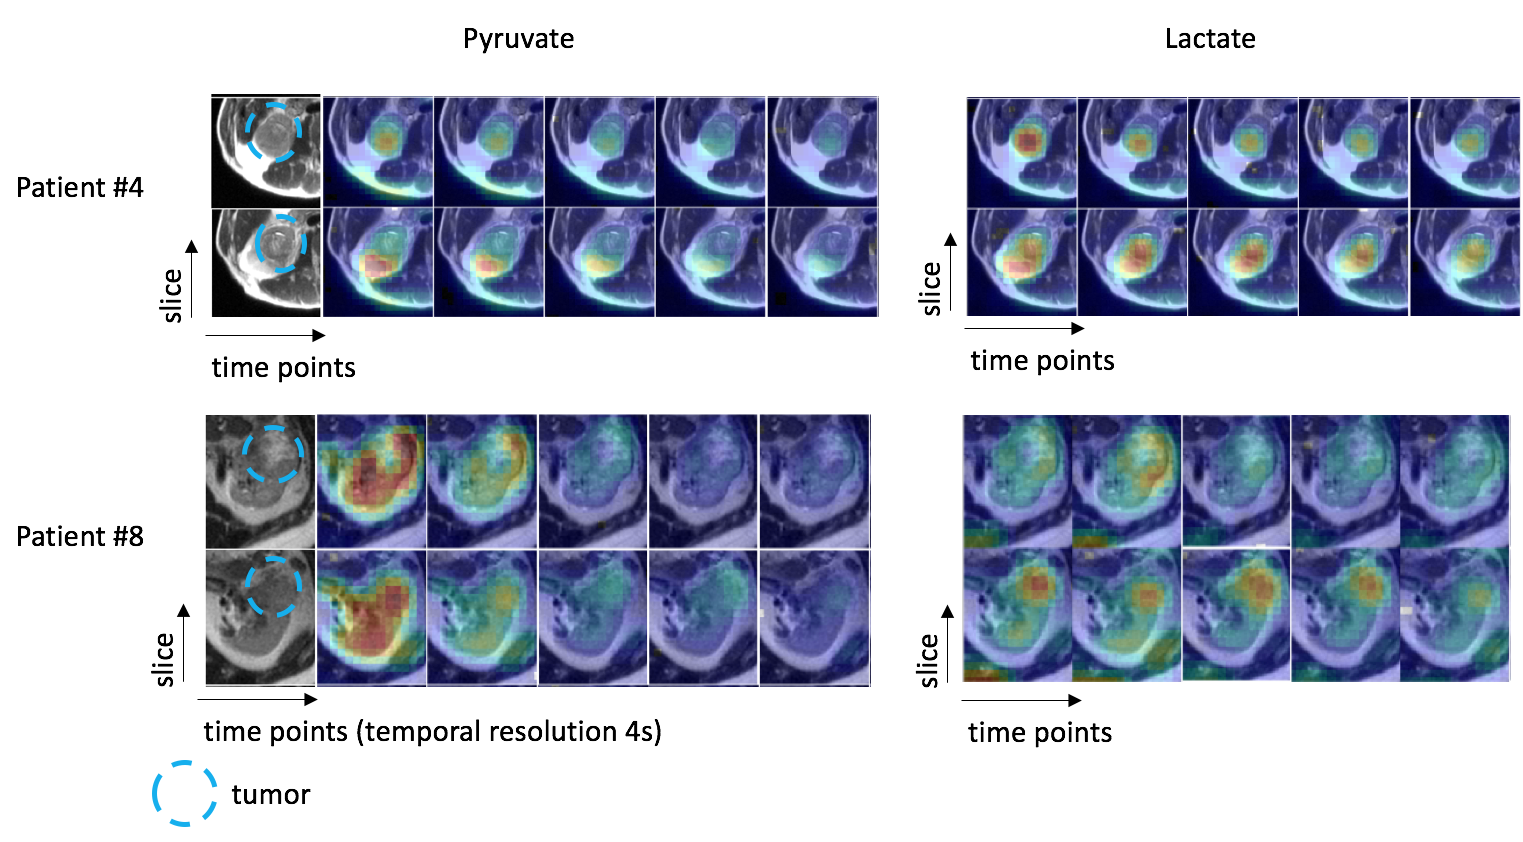
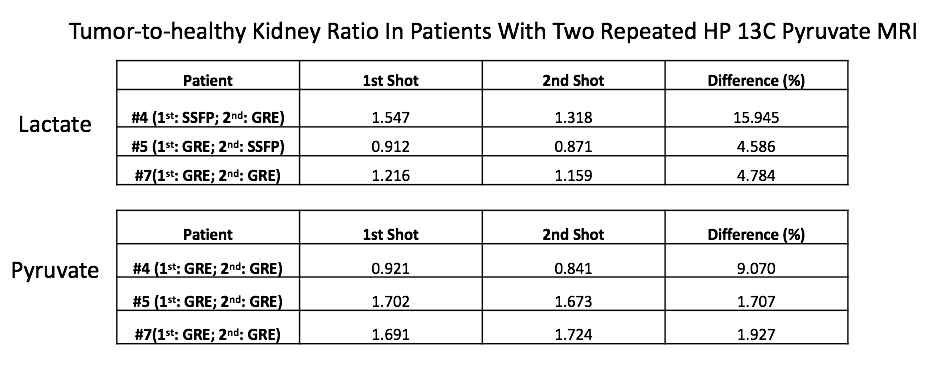
HP 13C pyruvate MRI was successfully acquired in 6 of the 8 subjects; in one subject, there was poor tumor perfusion which was likely related to the largely cystic nature of the tumor, in another subject, the metabolite signal was low due to technical errors. The time from the start of injection to bolus arrival in the kidneys ranged from 16s to 28s (Figure 1). The range of SNR summed over ten time points in the kidneys were 9 to 34 for lactate, and 36 to 174 for pyruvate. Figure 2 shows representative tumor metabolite ratios images in 2 patients with renal tumors, and demonstrates increased tumor lactate/pyruvate ratio and lactate/alanine ratio compared to healthy kidney parenchyma. Figure 3 shows dynamic 13C pyruvate and lactate images in the same two patients. In both patients, dynamic images demonstrated metabolite heterogeneity across time and tumor slices. For example, in patient #4, lactate signals in one tumor slice show high contrast at the first time point and then rapidly decay thereafter, while the lactate signal in another tumor slice delay steadily overtime. Such dynamic patterns and metabolite heterogeneity could be parametrized for further metabolic characterization in future studies. Table 1 shows the metabolite ratio of tumor-to-healthy appearing kidney in subjects who had two injections on the same day. The difference shown was calculated as the absolute difference between two injections divided by the mean of the two injections (acquired with GRE or SSFP sequences). The median of the differences is 4.8% whereas the largest difference is 16%. These relatively small differences between the two acquisitions suggest good reproducibility of HP 13C pyruvate MRI in renal tumors.Conclusion
We present our successful initial experience of applying HP 13C pyruvate MRI in patients with renal tumors. Distinct tumor metabolite patterns with substantial heterogeneity were observed on HP 13C pyruvate MRI. Our data from subjects with two injections also suggests that the metabolite measurements are reproducible. This initial experience paves the way for this metabolic imaging technique to be applied for differentiating between benign renal tumors, low grade RCCs and high grade RCCs.Acknowledgements
This work was supported by the National Institute of Biomedical Imaging and Bioengineering (P41EB013598, U01EB026412) and American Cancer Society Research Scholar Grant (RSG-18-005-01 CCE)References
1. Singer K, Kastenberger M, Gottfried E , et al. Warburg phenotype in renal cell carcinoma: High expression of glucose‐transporter 1 (GLUT‐1) correlates with low CD8+ T‐cell infiltration in the tumor. Int. J. Cancer 2011;128: 2085-2095.
2. Wettersten HI, Hakimi AA, Morin D, et al. Grade-Dependent Metabolic Reprogramming in Kidney Cancer Revealed by Combined Proteomics and Metabolomics Analysis. Cancer Res. 2015;12:2541-2552
3. ArdenkjærLarsen JH, Golman K, Gram A, et al. Increase of signal-to-noise of more than 10,000 times in liquid state NMR. Discov Med 2003;3:37–9.
4. Golman K, in ’t Zandt R, Thaning M. Real-time metabolic imaging. Proc Natl Acad Sci U S A 2006;103:11270–5.
5. Tang S, Milshteyn E, Reed G, et al. A regional bolus tracking and real-time B1 calibration method for hyperpolarized 13C MRI. Magn Reson Med. 2019; 81: 839– 851
6. Tropp J, Lupo JM, Chen A, et al. Multi-channel metabolic imaging, with SENSE reconstruction, of hyperpolarized [1-13C] pyruvate in a live rat at 3.0 tesla on a clinical MR scanner. J Magn Reson 2011;208:171–7.
Figures