0683
Investigating the robustness of convolutional neural network based B1+ prediction from localizer scans for SAR efficient 7T FLAIR imaging1Centre for Advanced Imaging, University of Queensland, Brisbane, Australia, 2Siemens Healthcare Pty Ltd, Brisbane, Australia, 3ARC Centre for Innovation in Biomedical Imaging Technology, University of Queensland, Brisbane, Australia, 4School of Information Technology and Electrical Engineering, University of Queensland, Brisbane, Australia, 5Mark and Mary Stevens Neuroimaging and Informatics Institute, University of Southern California, Los Angeles, CA, United States
Synopsis
In 7T MRI adiabatic pulses enable robust inversion of spins at the cost of increased SAR and longer scan times. A convolutional neural network was used to estimate the B1+ profile from a localizer scan, Bloch equation simulations were used to calculate the required B1+ for adiabaticity, and adiabatic pulse power was scaled accordingly reducing SAR by up to 38%. We investigated the robustness and efficiency of this approach and showed a substantial SAR reduction is possible without an additional B1 map acquisition. This resulted in an up to 27% faster T2-FLAIR acquisition with full brain coverage.
Introduction
T2-FLAIR MRI is a common tool for assessing neurological disorders (1). High SNR offered by 7T MRI allows the visualization of anatomical details in white matter, such as subnuclear structures in the thalamus (2). However, at ultra-high-field B1+ inhomogeneities cause non-uniform inversion which degrades image quality (3). The adiabatic full passage has been proposed for inverting spins (4), as it is robust to B1+ inhomogeneities once the adiabaticity is satisfied leading to a uniform inversion efficiency throughout an image slice (5). In practice, B1+ is unknown and adiabatic pulses are over-driven to ensure inversion, which increases SAR. It has already been proposed that SAR reduction can be achieved by adapting the pulse power in a slice-by-slice manner using B1+ profiles estimated from localizer scans implicitly sensitive to B1+ via a deep convolutional neural network (CNN) (6). Here, we investigated the robustness and efficiency of this approach with respect to different head and slice orientations. In addition, we utilized full Bloch simulations to ensure the adiabaticity condition of the inversion pulse was met.Methods
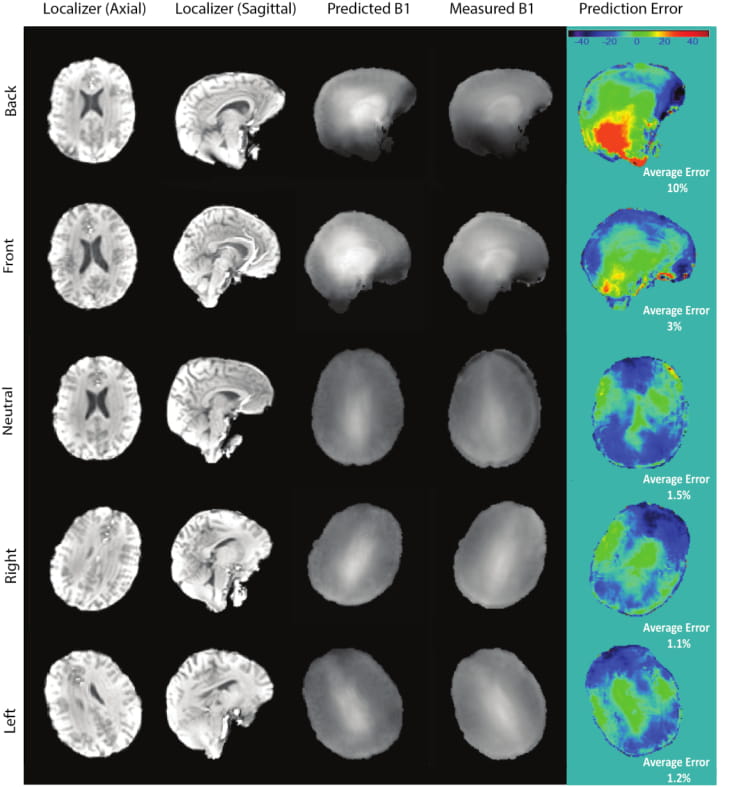
The local human ethics committee approved the project. After giving written informed consent, 27 participants were scanned using a 7T whole-body research scanner (Siemens Healthcare, Erlangen, Germany) with a 32-channel head coil (Nova Medical, USA). The study had three different phases:I) CNN training, testing, and evaluation: 3D localizer and B1+ maps (using a "prototype sequence" SA2RAGE (7)) were acquired from ten participants and the data was used to train (seven) and test (one) a CNN for estimating the B1+ map from the localizer scan. The localizer and B1+ map was acquired from two participants in 5 different head rotations (left, right, neutral, front, and back) to evaluate the robustness of the CNN prediction to different head rotations.
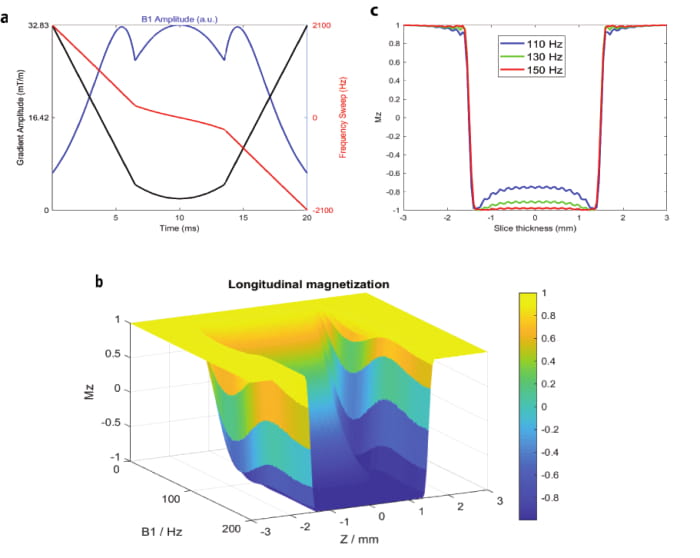
II) Adiabatic pulse scale factor calculation: Scale factors needed for tailoring the inversion pulse power were measured through the following steps in 10 participants (4F/6M): B1 Map prediction/Measurement: a 3D localizer scan was acquired and the B1+ map was both measured (SA2RAGE) and estimated (predicting B1+ using CNN based on the localizer). Absolute B1 Mapping: The absolute B1 map was calculated as: $$B1,inv = B1,ref *(Vop/Vref) $$ with the SA2RAGE B1+ map as the reference scan. The ratio of the voltage amplitude of the inversion pulse (Vop) to the pulse used for SA2RAGE (Vref) yields the factor for converting the relative B1+ map to the absolute one. RF Pulse Simulation: a TR-FOCI (8) pulse was used for inverting the spins in the FLAIR sequence. Bloch equations were used to simulate the inversion pulse profile and calculate the minimum B1 amplitude needed for the adiabatic condition. Slice positioning (for ease of re-slicing): A fast (9 second) GRE sequence with the exact slice positions required for FLAIR was acquired, and the predicted and measured B1+ maps were resliced to these GRE imaging volumes. Scale factor calculation: the brain was segmented using BET in FSL and the areas where B1+ was higher than the B1 value required for adiabaticity were excluded. The scale factor was calculated using the upper bound of the 95% confidence interval around the mean value of B1+ in each slice as:
$$Scale Factor = (Nominal B1 Value)/(Upper Bound B1 Value)$$
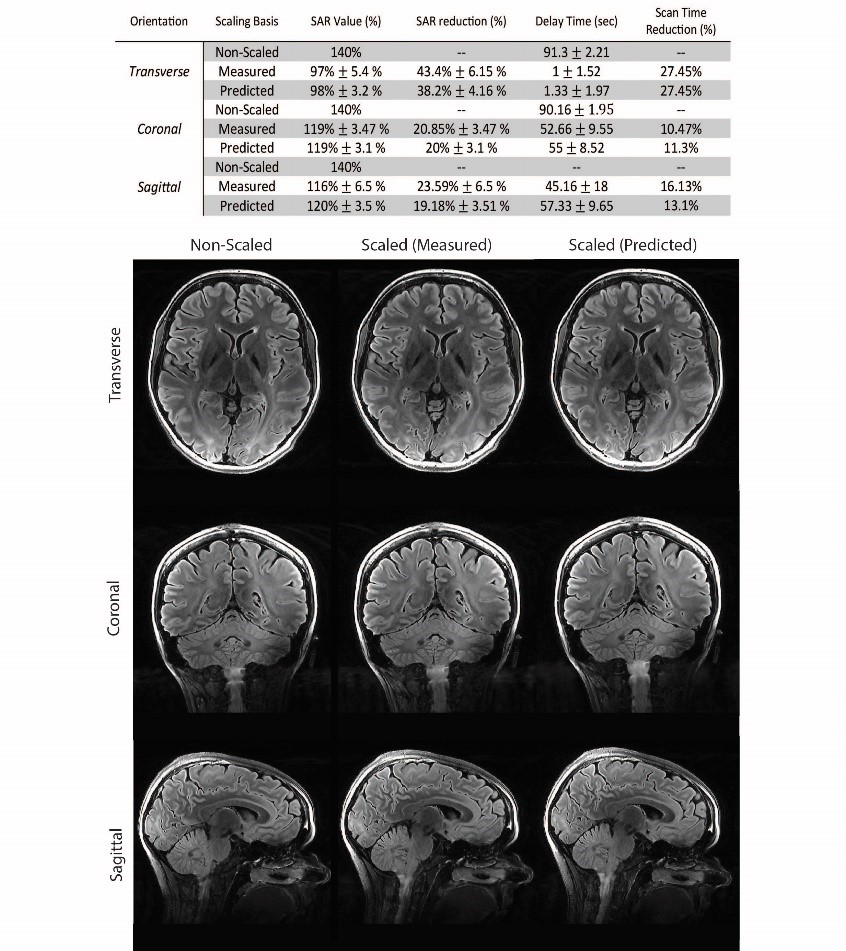
III) SAR reduction experiment: To assess the performance of SAR reduction of FLAIR, images in both standard (non-scaled) and slice-by-slice scaled modes were acquired in six participants (3M/3F). To test robustness to the chosen imaging plane, the experiment was repeated for the axial, sagittal and coronal planes.
Results
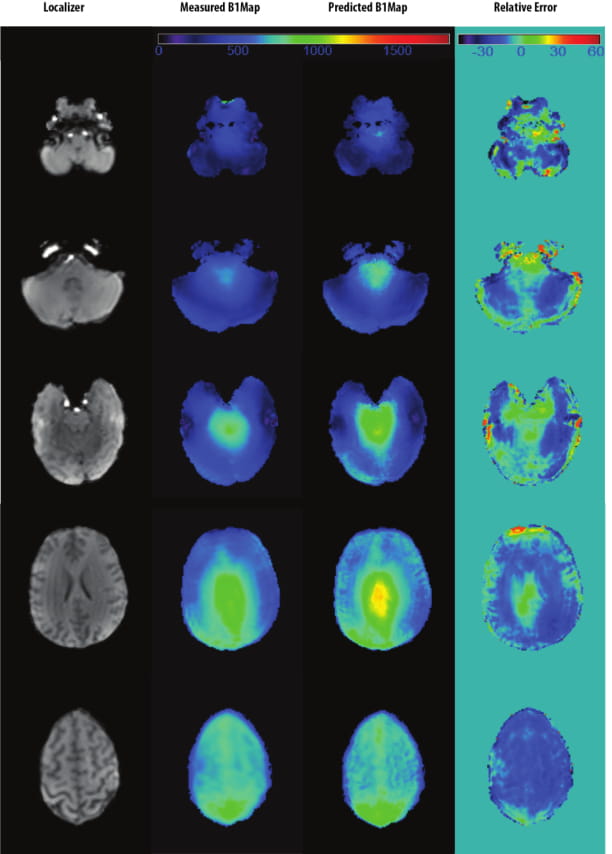
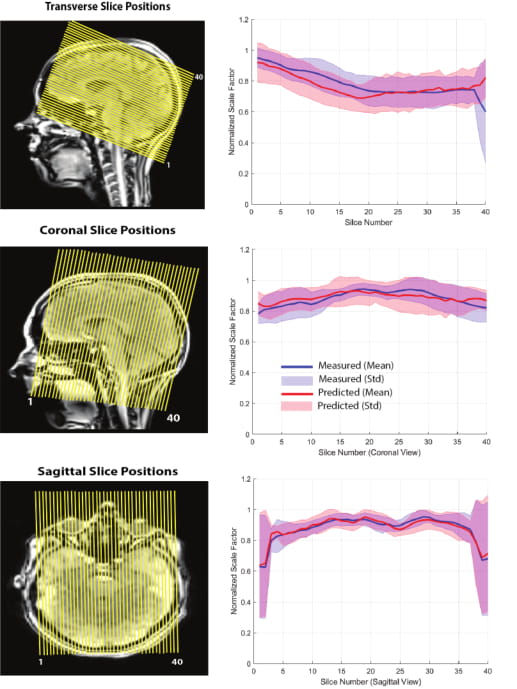
Figure 1 shows the result of the CNN prediction. The mean difference between predicted and measured B1+ maps across all slices is 4.46%. The results of the CNN prediction for one subject in five different head rotations (Figure 2) show that the error increases from 1.5% (neutral) to 10% (back) and 3% (front). For left and right rotations, the error was approximately the same as the neutral position. The mean and standard deviation of the scale factors for 10 participants in three imaging rotations are shown in Figure 3. Bloch simulations suggested that for an inversion efficiency ≥ 97%, a 150Hz amplitude pulse is required (Figure 4) and, therefore, CSF suppression should be achieved where the B1+ value is higher than the simulated nominal value. The scaled and non-scaled FLAIR results for SAR reduction are provided (Figure 5 (top)), showing scaled mode reduces SAR and delay time in all three orientations with respect to the non-scaled mode. Example slices (Figure 5), showed the same image quality with the proposed SAR reduction method.Discussion and Conclusion
We estimated B1+ profile using a CNN from a localizer scan, simulated Bloch equations to calculate the required absolute value for adiabaticity, which was used to compute pulse power in a slice-by-slice fashion. B1+ inhomogeneity mitigation by adiabatic inversion and SAR reduction through pulse power scaling from CNN prediction led to an up to 27% faster 7T T2-FLAIR full brain scan. Compared to alternative strategies like dielectric pads (9), or parallel transmission (PTx) (10, 11), our method does not require additional MR hardware and works on readily available single channel coils and can potentially be implemented on the scanner software.Acknowledgements
No acknowledgement found.References
1. Hajnal JV, Collins AG, White SJ, Pennock JM, Oatridge A, Baudouin CJ, et al. Imaging of human brain activity at 0.15 T using fluid attenuated inversion recovery (FLAIR) pulse sequences. Magnetic resonance in medicine. 1993;30(5):650-3.
2. Zwanenburg JJ, Hendrikse J, Visser F, Takahara T, Luijten PR. Fluid attenuated inversion recovery (FLAIR) MRI at 7.0 Tesla: comparison with 1.5 and 3.0 Tesla. European radiology. 2010;20(4):915-22.
3. Röschmann P. Radiofrequency penetration and absorption in the human body: limitations to high‐field whole‐body nuclear magnetic resonance imaging. Medical physics. 1987;14(6):922-31.
4. Tannús A, Garwood M. Adiabatic pulses. NMR in Biomedicine. 1997;10(8):423-34.
5. Bernstein MA, King KF, Zhou XJ. Handbook of MRI pulse sequences. Journal of Magnetic Resonance Imaging. 2004.
6. Bollmann S, Kelly S, Vegh V, Rodell A, Tesiram Y, Barth M, et al., editors. Improving FLAIR SAR efficiency by predicting B1-maps at 7T from a standard localizer scan using deep convolutional neural networks. ISMRM; 2018.
7. Eggenschwiler F, Kober T, Magill AW, Gruetter R, Marques JP. SA2RAGE: A new sequence for fast B1+‐mapping. Magnetic resonance in medicine. 2012;67(6):1609-19.
8. Hurley AC, Al‐Radaideh A, Bai L, Aickelin U, Coxon R, Glover P, et al. Tailored RF pulse for magnetization inversion at ultrahigh field. Magnetic resonance in medicine. 2010;63(1):51-8.
9. O'brien KR, Magill AW, Delacoste J, Marques JP, Kober T, Fautz HP, et al. Dielectric pads and low‐B1+ adiabatic pulses: Complementary techniques to optimize structural T1w whole‐brain MP2RAGE scans at 7 tesla. Journal of Magnetic Resonance Imaging. 2014;40(4):804-12.
10. Beqiri A, Hoogduin H, Sbrizzi A, Hajnal JV, Malik SJ. Whole-brain 3D FLAIR at 7T using direct signal control. Magn Reson Med. 2018;80(4):1533-45. Epub 2018/02/25. doi: 10.1002/mrm.27149. PubMed PMID: 29476551; PubMed Central PMCID: PMCPMC6120540.
11. Gras V, Pracht ED, Mauconduit F, Le Bihan D, Stöcker T,
Boulant N. Robust nonadiabatic T2 preparation using universal parallel‐transmit
kT‐point pulses for 3D FLAIR imaging at 7 T. Magnetic resonance in medicine.
2019;81(5):3202-8.
Figures