0682
Visualizing and utilizing latent features of MR vessel wall images using weakly supervised deep learning analysis workflow1University of Washington, Seattle, WA, United States, 2Centre for Imaging Sciences, Manchester Academic Health Science Centre, The University of Manchester, Manchester, United Kingdom
Synopsis
Atherosclerotic plaque information can be extracted from MR vessel wall images through transforming the images into a high dimensional feature space. However, a huge amount of human supervision has traditionally been required to achieve a meaningful feature space representation. We demonstrated that by using a weakly supervised deep learning workflow including transfer learning, active learning, and metric learning, a meaningful feature space for vessel wall analysis can be generated, which can help us to visualize the high dimensional representations of normal and diseased vessel walls images, and lead to a plaque classification area under the curve of 0.93.
Introduction
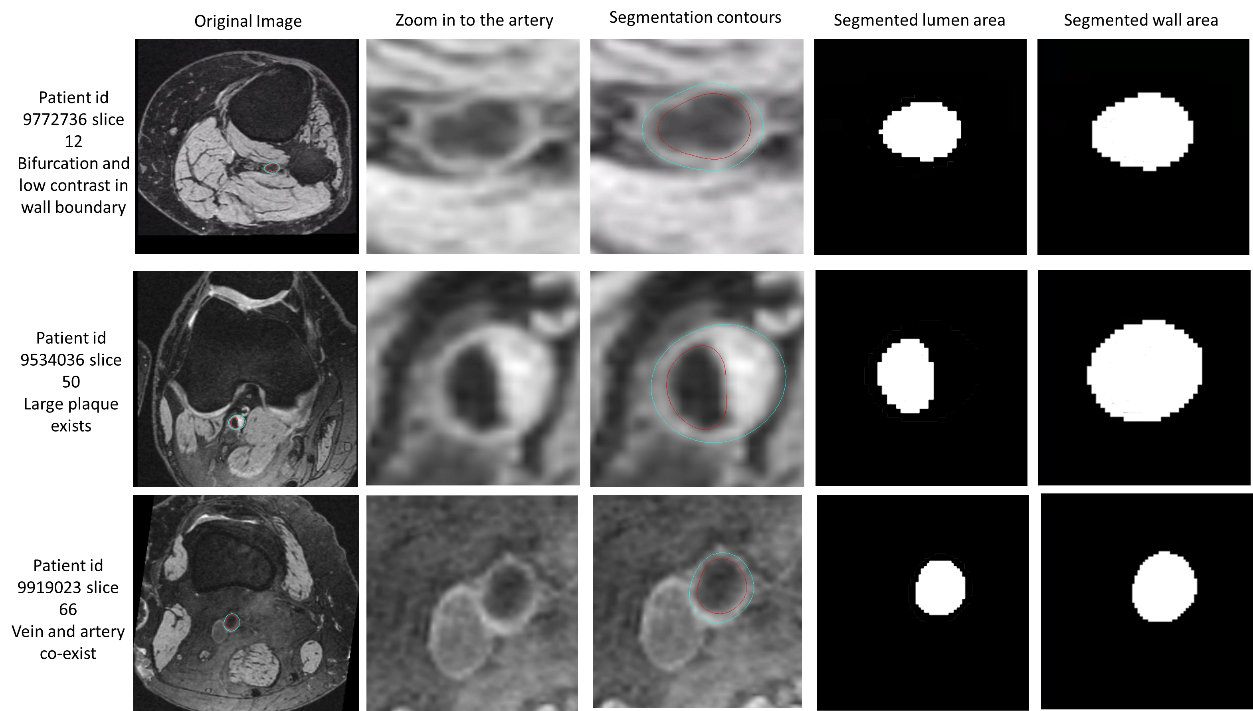
MRI is the modality of choice for imaging biomarkers for atherosclerosis and cardiovascular disease such as atherosclerotic plaque and vessel wall thickness [1,2]. Traditionally, manual vessel wall contour delineation was used. Deep learning techniques can replace manual contour delineation if a large manually-delineated training set is available [3,4]. However, some issues remain. Firstly, in validation of these biomarkers, latent features in the deep learning model which detect differences and patterns between normal and diseased vessel wall must be understood: a meaningful feature map is needed. Secondly there is a need to reduce manual labeling and human bias in model training while retaining reasonable performance, e.g. with unlabeled data and unsupervised or weakly supervised learning methods.We previously developed a vessel wall segmentation technique [3] and acquired more than 3.49 million slices of vessel wall contours of popliteal arteries from a massive public 3T MRI dataset, the Osteoarthritis Initiative (OAI) [5], with 4796 subjects at multiple time points (example of segmentation shown in Figure 1). We now propose a workflow based on this dataset for feature map generation using a weakly supervised learning method and demonstrate the feasibility of atherosclerotic plaque classification using this feature map.
Methods
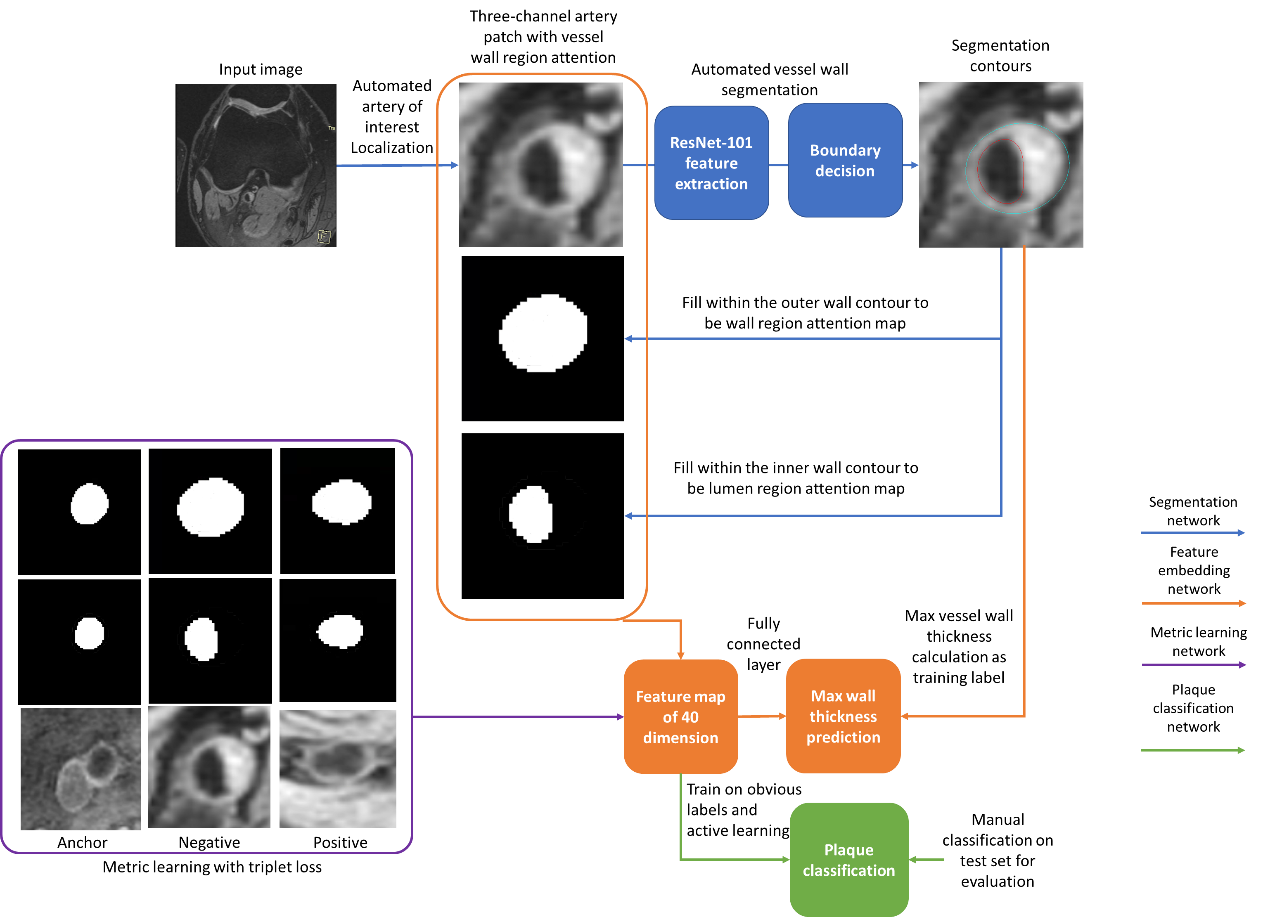
A feature map is a high dimensional representation of image features. The proposed workflow uses four networks (segmentation, thickness prediction, plaque classification, and metric learning networks) to generate and utilize the feature map for vessel wall analysis (flow chart in Figure 2). The segmentation network locates the artery of interest and segments [3] vessel wall regions into lumen and wall area masks, which are concatenated with the original image as the artery patch (size of 128*128*3, enough to cover whole artery region).No plaque classification labels exist, so a transfer learning approach is used to train the feature map from vessel wall thickness prediction network which can be trained using existing labels from segmentation. The thickness prediction network shares the intermediate layer output (fully connected layer with 40 dimensions as the feature map) from the segmentation network and is trained to predict maximum wall thickness from the artery patches. Ten thousand randomly selected artery patches from the OAI dataset were used to train the thickness prediction network.
From the feature map, the plaque classification network categorizes artery patches into two groups: normal artery, and vessel wall with noticeable atherosclerotic plaque, each with a probability. An active learning approach is used to select the samples for training. Initially, patches with the 1,000 greatest and least wall thickness are represented as two clusters in the feature space (clusters considered as plaques and normal arteries). For each iteration, 1,000 patches were classified, and the patches at the border of two clusters were labeled by two trained vessel wall reviewers (with over 6 months, and 10 years of experience in vascular review, consensus reached). Labeled samples were used for distance metric learning [6] to strengthen clusters in the feature space. Metric learning trains the feature embeddings using the triplet loss, which minimizes the intra-class distance and maximizes the inter-class distance in the feature space.
After feature space generation, t-SNE [7] is used to visualize high-dimensional data into 2D space for human perception.
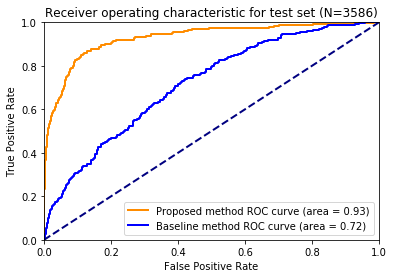
An untouched test set of randomly selected 60 scans (3586 slices) was manually labeled for plaque classification for performance evaluation.
As comparison, a baseline model with the original image patch as input for plaque classification using only the same classification network structure was evaluated. Area under the Receiver Operating Characteristics Curve (AUC) was used as the evaluation metric.
Results
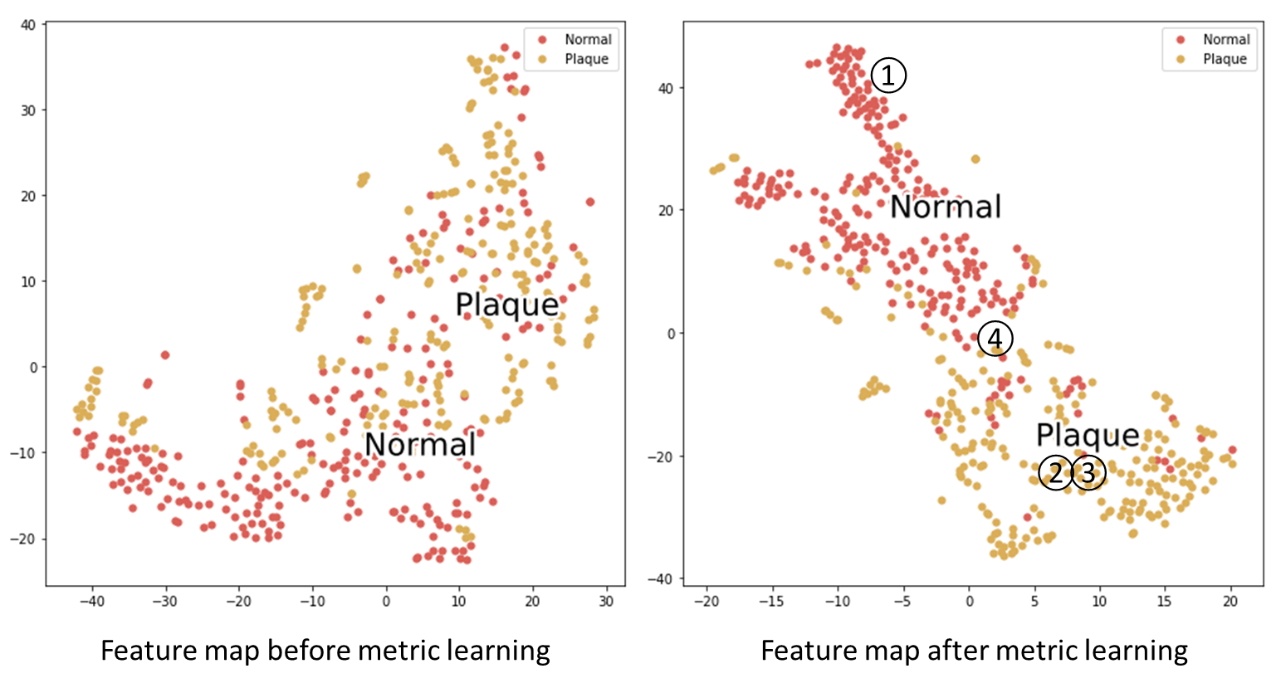
By using the automated generated thickness measurements (weak labels) as training labels, and a few highly challenging labeled samples (three rounds of active learning, 256 normal patches and 256 disease patches), a meaningful feature map could be generated.Feature maps before and after metric learning are shown in Figure 3. Two clusters in the feature map are less mixed after metric learning, leading to an easier plaque classification task.
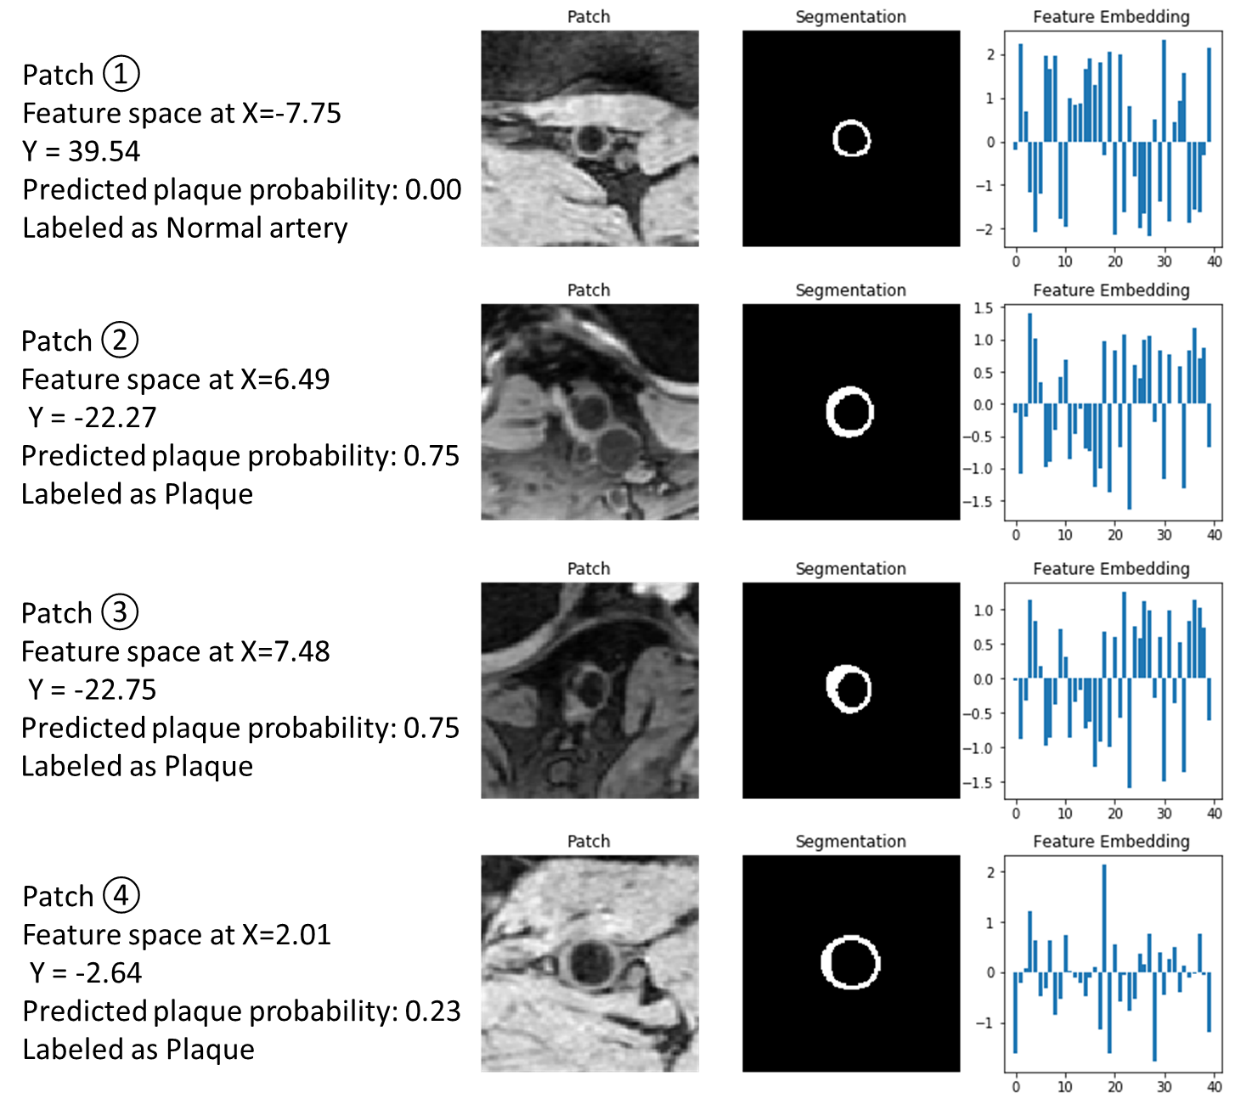
Figure 4 displays artery patches at selected dots in the feature map. Patches of normal arteries are far away from vessel wall with clear plaques while plaques with similar patterns were close in feature space. Patches at the boundary of two clusters in the feature map were found to be ambiguous and even challenging for expert humans to classify.
The AUC for plaque classification was 0.93 for our workflow, and 0.72 for the baseline method (Figure 5).
Discussion and Conclusion
The proposed weakly supervised method generated a meaningful feature map for vessel wall analysis by transfer learning from the existing vessel wall thickness labels, active learning from iterative supervisions for patches with greatest uncertainty, and metric learning by separating plaque and normal artery patches in the feature space. The generated feature map visualized using t-SNE, can be useful in vessel wall analysis, such as plaque classification. More analysis using the feature map could be explored to better understand the vessel wall disease patterns and monitoring the plaque progressions patterns.Acknowledgements
We gratefully acknowledge the support of NVIDIA Corporation for donating the Titan GPU. The Osteoarthritis Initiative (OAI) is a public-private partnership comprised of 5 contracts (N01-AR-2-2258; N01-AR-2-2259; N01-AR-2-2260; N01-AR-2-2261; and N01-AR-2-2262) funded by the National Institutes of Health (NIH), a branch of the Department of Health and Human Services, and conducted by the OAI Study Investigators.
This research is supported by grants from American Heart Association (18AIML34280043).
References
[1] Sun J, Zhao XQ, Balu N, Hippe DS, Hatsukami TS, Isquith DA, et al. Carotid magnetic resonance imaging for monitoring atherosclerotic plaque progression: a multicenter reproducibility study. Int J Cardiovasc Imaging 2015;31:95–103. doi:10.1007/s10554-014-0532-7.
[2] Choudhury RP, Birks JS, Mani V, Biasiolli L, Robson MD, L’Allier PL, et al. Arterial Effects of Canakinumab in Patients With Atherosclerosis and Type 2 Diabetes or Glucose Intolerance. J Am Coll Cardiol 2016;68:1769–1780. doi:10.1016/j.jacc.2016.07.768.
[3] Chen L, Sun J, Canton G, Balu N, Zhao X, Li R, et al. Automated Artery Localization and Vessel Wall Segmentation of Magnetic Resonance Vessel Wall Images using Tracklet Refinement and Polar Conversion. ArXiv 2019.
[4] Wu J, Xin J, Yang X, Sun J, Xu D, Zheng N, et al. Deep Morphology Aided Diagnosis Network for Segmentation of Carotid Artery Vessel Wall and Diagnosis of Carotid Atherosclerosis on Black‐Blood Vessel Wall MRI. Med Phys 2019:mp.13739. doi:10.1002/mp.13739.
[5] Peterfy CG, Schneider E, Nevitt M. The osteoarthritis initiative: report on the design rationale for the magnetic resonance imaging protocol for the knee. Osteoarthr Cartil 2008;16:1433–1441. doi:10.1016/j.joca.2008.06.016.
[6] Schroff F, Philbin J. FaceNet: A Unified Embedding for Face Recognition and Clustering. n.d.
[7] Maaten L van der, Hinton G. Visualizing High-Dimensional Data Using t-SNE. J Mach Learn Res 2008;9:2579–2605.
Figures