0676
Accelerating the B0 Inhomogeneity Correction for GluCEST Imaging Using Deep Learning1Department of Electrical and Computer Engineering, Temple University, Philadelphia, PA, United States, 2Department of Radiology, University of Pennsylvania Perelman School of Medicine, Philadelphia, PA, United States, 3Department of Neurology, University of Pennsylvania Perelman School of Medicine, Philadelphia, PA, United States, 4Department of Diagnostic Radiology and Nuclear Medicine, University of Maryland School of Medicine, Baltimore, MD, United States
Synopsis
Glutamate Chemical Exchange Saturation Transfer (GluCEST) MRI is a noninvasive technique for mapping parenchymal glutamate in the brain. GluCEST signal is sensitive to magnetic field (B0) inhomogeneity. Corrections for B0 inhomogeneity often require repeated data acquisitions at several saturation offset frequencies, which however dramatically prolongs the total acquisition time and can cause practical issues such as increased sensitive to patient motions. Another technique challenge in GluCEST MRI is the low signal-to-noise-ratio (SNR) as the signal is derived from the small z-spectrum difference. Both issues were addressed in this study with a novel deep learning-based algorithm armed with wide activation neurons.
Introduction
Glutamate Chemical Exchange Saturation Transfer (GluCEST) MRI is a noninvasive technique for mapping parenchymal glutamate in the brain1-4. GluCEST signal is sensitive to magnetic field (B0) inhomogeneity. Corrections for B0 inhomogeneity often require repeated data acquisitions at several saturation offset frequencies, which however dramatically prolongs the total acquisition time and can cause practical issues such as increased sensitive to patient motions5,6. There is an urgent need of developing a method that can correct B0 inhomogeneity without significantly increasing the total acquisition time. Another technique challenge in GluCEST MRI is the low signal-to-noise-ratio (SNR) as the signal is derived from the small z-spectrum difference. Both issues were addressed in this study with a novel deep learning (DL)-based algorithm armed with wide activation neurons.Methods
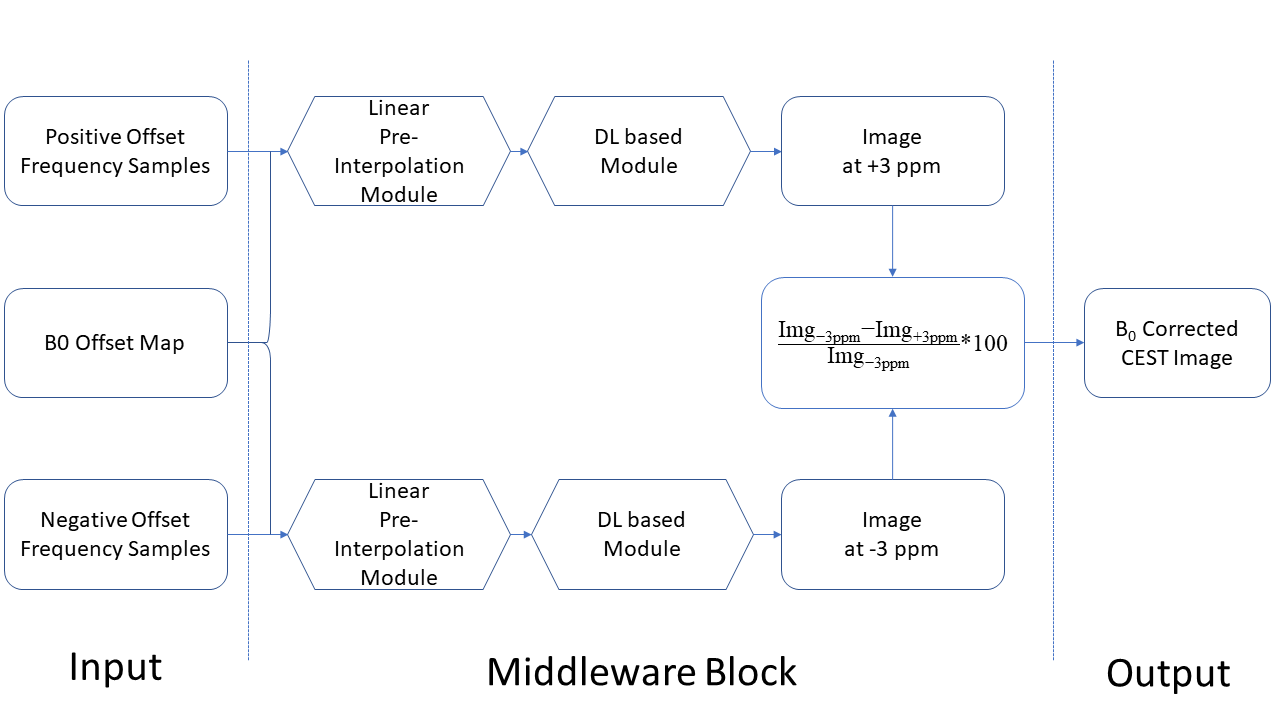
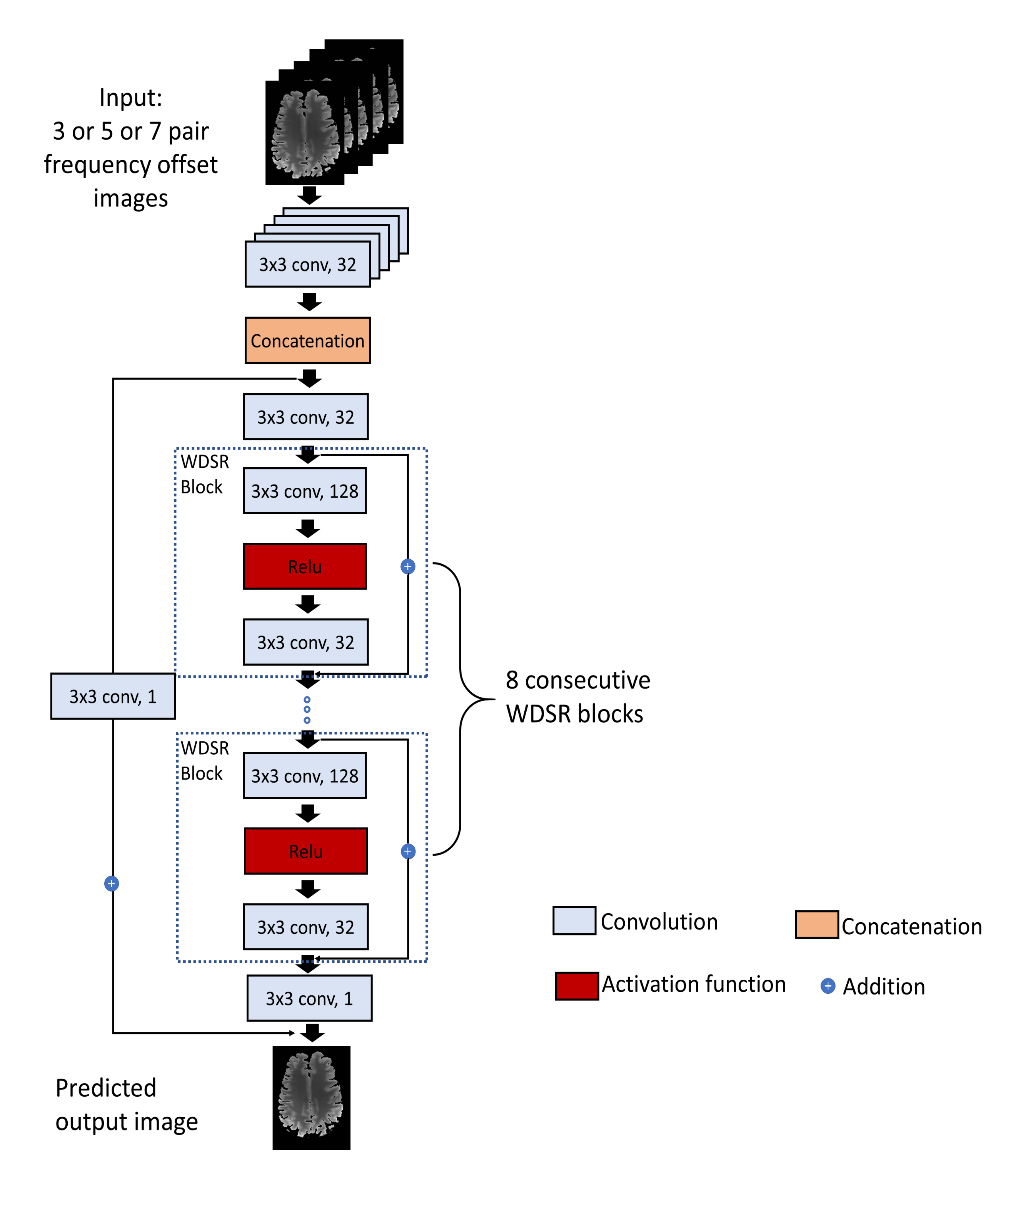
Current GluCEST B0 correction needs 26 saturation frequency acquisitions along each side of the z-spectrum (from ±1.8 to ±4.2 ppm with a step size of 0.2 ppm). The goal of DL-based method was to use fewer z-spectrum sampling points to achieve similar or even better correction results. Fig 1 shows the network structure used for B0 correction which was performed for the positive and negative side of the z-spectrum separately. The backbone of the network is the vanilla residual network while all the residual blocks are replaced by the blocks from Wide-activation Deep Super-Resolution network (WDSR)7 (Fig. 2). For each side, an independent DL-B0GluCEST network was trained to learn the nonlinear projection from a few CEST-weighted images acquired at different ppm values to that at 3 ppm (where GluCEST peaks) in the same side of the z-spectrum. The optimal hyperparameters for WDSR filters were determined from the original WDSR paper7. To assess the sensitivity of DL-B0GluCEST to the number of offset acquisitions, the network was trained separately for taking 3, 5 or 7 different ppm acquisitions as the input for each side of the z-spectrum. In addition to the WDSR-based DL- B0GluCEST, DL-B0GluCEST was implemented based on another popular network structure, the U-net8. Seven healthy volunteers (6 males, 1 female) aged 28 to 66 years old (45 ± 14.54 years) participated in the study and were imaged using a 7T Siemens scanner (Erlangen, Germany) with a Siemens volume coil transmit/32-channel phased-array receive coil. 29 scans were collected from seven subjects, with twenty scans being used as training data sets and nine scans being used as the test data sets.Results
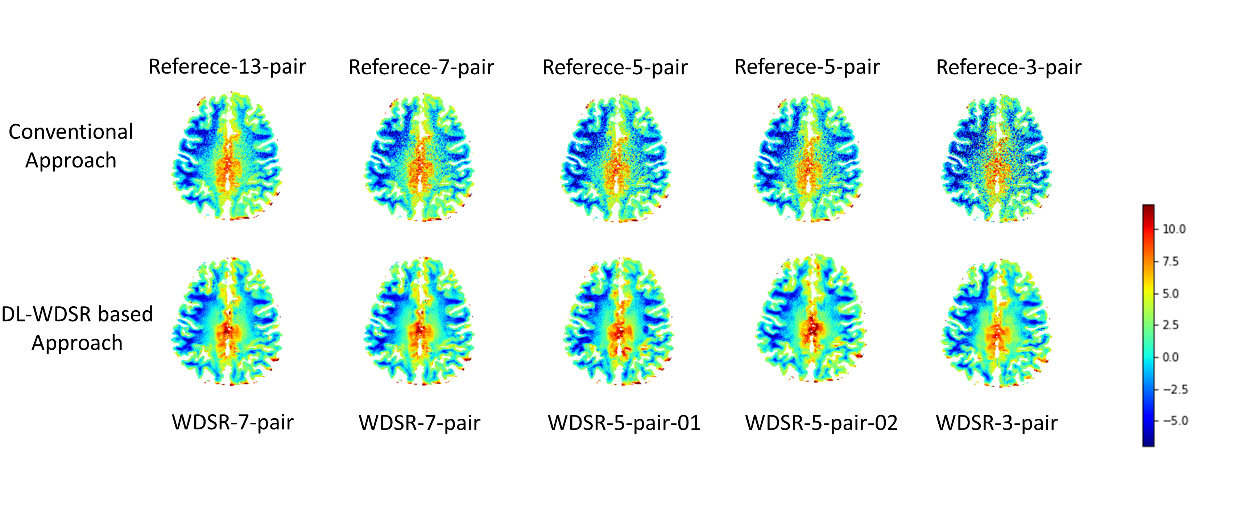
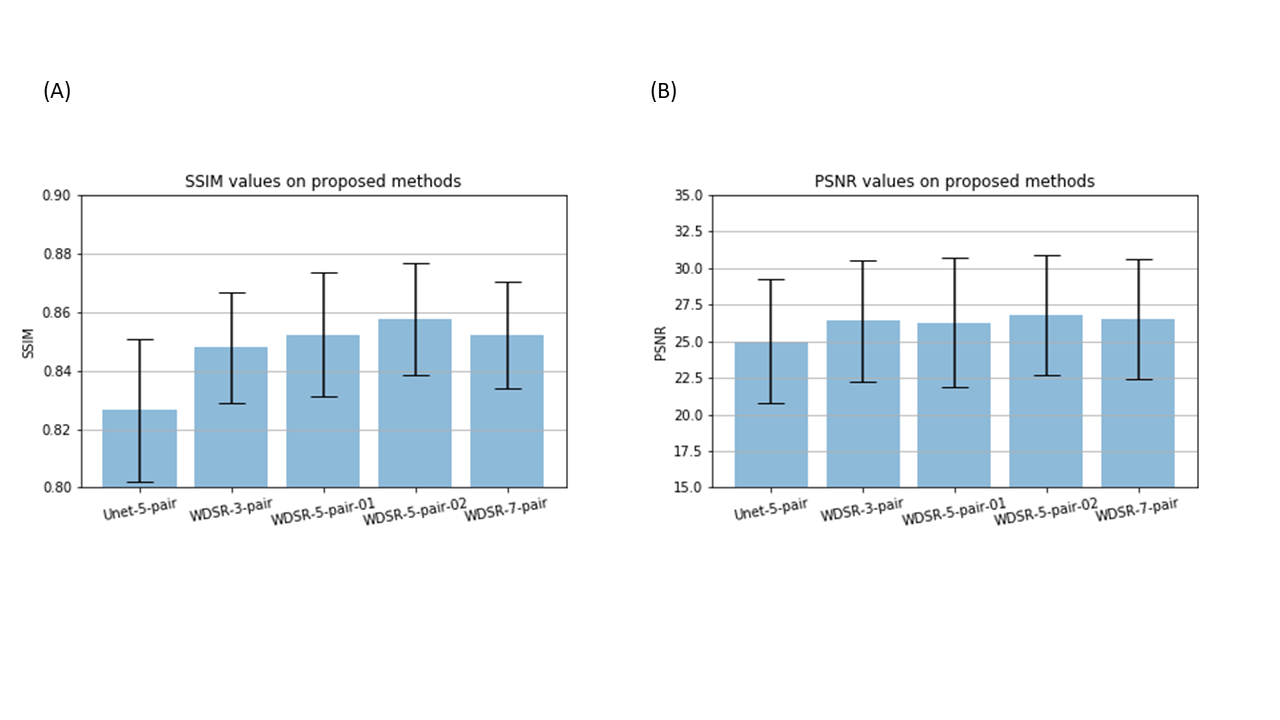
Fig. 3 shows the GluCEST maps of one representative subject. Traditional B0 correction method [5] based on 7/5/3 pairs CEST-weighted images yielded substantially reduced SNR (top row of Fig. 3). By contrast, DL-B0GluCEST produced high B0 corrected GluCEST image quality in terms of tissue structures and image contrast for all assessed different number of inputs. Fig. 4 shows the performance quantification results. Among the several DL-B0GluCEST implementations, the ones with WDSR yielded the best B0 correction results as measured by the Structural Similarity Index (SSIM) in relative to the B0 corrected results by current method. As compared to the current B0 correction method, all DL methods produced higher Peak Signal-to-Noise Ratio (PSNR). Increasing the input from 5 to 7 didn’t significantly improve the results. While reducing the number of inputs to be 3 didn’t yield significant B0 correction performance degradation, the results showed some visual inconsistency across subjects.Discussion
We developed a DL-based B0 correction method for GluCEST imaging. Using the method, the total GluCEST imaging time can be saved by 46%, 61%, and 77% of acquisition time by using 7, 5, and 3 pairs of frequency offset acquisitions, respectively. Based on both visual and quantitative evaluations, we recommend using DL-B0GluCEST with 5 pairs of offset acquisitions. The possibility of substantially reducing the number of offset sampling steps while still getting similar or even better B0 correction results can be attributed to two reasons. First, the typical z-spectrum is smooth across different frequency offset, which enables the deep neural network to learn the low-dimensional (smoothing often suggests low-dimension) manifold from relatively small training data. Second, DL-B0GluCEST is image-based, meaning that the spatial correlation among neighboring voxels are explicitly utilized to improve the manifold learning, resulting in an increased SNR. As a pilot study, there were several limitations. First, the training sample size was relatively small. While overfitting due to small sample size was prevented by using several training strategies such as k-fold cross validation9, retesting the method with larger dataset will be imperative before fully replacing the current B0 correction method with DL-B0GluCEST. Second, the network parameters, such as number of filters, layers, and the expansion ratio were determined based on the relevant literature7. A future exploration will be using asymmetric offset acquisitions so the minimal number of offsets can be further reduced.Conclusion
We proposed a DL based framework for correcting B0 inhomogeneity for GluCEST imaging using fewer acquisitions, which has the potential of reducing CEST acquisition time by >60%. The assessed DL-B0GluCEST networks were largely insensitive to the number of input frequency offset images and yielded higher SNR than traditional method. We envision that a similar framework can be extended to include correction for B1 inhomogeneity in future work.Acknowledgements
This project was supported by the National Institute of Biomedical Imaging and Bioengineering of the National Institute of Health under award number p41EB015893 and the National Institute of Drug Abuse of the National Institutes of Health under award number R01DA037289, and by NIH/HIA R01AG060054-01.References
1. Forsén, S., Hoffman, R.A.: Study of moderately rapid chemical exchange reactions by means of nuclear magnetic double resonance. J. Chem. Phys. 39, 2892–2901 (1963).
2. Ward, K.M., Aletras, A.H., Balaban, R.S.: A new class of contrast agents for MRI based on proton chemical exchange dependent saturation transfer (CEST). J. Magn. Reson. 143, 79–87 (2000).
3. Zhou, J., Van Zijl, P.C.: Chemical exchange saturation transfer imaging and spectroscopy. Prog. Nucl. Magn. Reson. Spectrosc. 48, 109–136 (2006).
4. Cai, K., Haris, M., Singh, A., Kogan, F., Greenberg, J.H., Hariharan, H., Detre, J.A., Reddy, R.: Magnetic resonance imaging of glutamate. Nat. Med. 18, 302–306 (2012). https://doi.org/10.1038/nm.2615.
5. Kim, M., Gillen, J., Landman, B.A., Zhou, J., Van Zijl, P.C.M.: Water saturation shift referencing (WASSR) for chemical exchange saturation transfer (CEST) experiments. Magn. Reson. Med. An Off. J. Int. Soc. Magn.Reson. Med. 61, 1441–1450 (2009).
6. Sun, P.Z., Farrar, C.T., Sorensen, A.G.: Correction for artifacts induced by B0 and B1 field inhomogeneities in pH-sensitive chemical exchange saturation transfer (CEST) imaging. Magn. Reson. Med. An Off. J. Int. Soc. Magn. Reson. Med. 58, 1207–1215 (2007).
7. Yu, J., Fan, Y., Yang, J., Xu, N., Wang, Z., Wang, X., Huang, T.: Wide activation for efficient and accurate image super-resolution. arXiv Prepr.arXiv1808.08718. (2018).
8. Ronneberger O, Fischer P, Brox T. U-net: Convolutional networks for biomedical image segmentation. InInternational Conference on Medical image computing and computer-assisted intervention, 234-241. (2015).
9. Fushiki, T.: Estimation of prediction error by using K-fold cross-validation. Statistics and Computing, 21(2), 137-146 (2011).
Figures