0674
Convolutional Neural Network for Slice Encoding for Metal Artifact Correction (SEMAC) MRI1Department of Bio and Brain Engineering, Korea Advanced Institute of Science and Technology, Daejeon, Korea, Republic of, 2Department of Radiology, Seoul National University College of Medicine, Seoul, Korea, Republic of
Synopsis
We propose convolutional neural network (CNN) to accelerate Slice Encoding for Metal Artifact Correction (SEMAC). The concept was tested on metal‑embedded agarose phantoms and patients with metallic neuro plates in the cerebral region. CNN was trained to output images with high SEMAC factor from input images with low SEMAC factor, achieving acceleration factors of 2 or 3. The metal artifacts in low SEMAC factor data were visually and quantitatively suppressed well in the output of CNN (p<0.01), which was comparable to that of the high SEMAC factor. The study shows the feasibility of reducing scan time of SEMAC through CNN.
INTRODUCTION
Distortion of MR images caused by metallic materials is highly significant due to metals’ innate influence on the magnetic field in MRI. Slice encoding for metal artifact correction (SEMAC)1 was introduced as an effective way to resolve through-plane metal artifacts. However, prolonged scan time still needs to be solved. A preliminary attempt to accelerate SEMAC using multilayer perceptron (MLP) was demonstrated in a phantom study2. In this study, we introduce convolutional neural network (CNN) to accelerate SEMAC, and prove the effectiveness in both phantom and in vivo studies.METHODS
SEMAC reduces through-plane artifacts by acquisition of a set of partition images for each slice, which consist of one central undistorted image and the remaining distorted images across the z direction. Low SEMAC factors may result in distorted signals outside the spatial coverage aliasing into incorrect spatial locations. Deep learning network was trained to solve the aliasing problem from the lower SEMAC factor to produce correct signals, thereby effectively decreasing the scan time.Convolutional Neural Network (CNN) was used following the U-Net scheme3 to accelerate SEMAC. Major differences from the classic U-Net structures include: use of three skip connections instead of four for computational efficiency, and number of channels for input and output layers matched to low SEMAC factor (6 or 4) and label high SEMAC factor 12, respectively. Input factor 6 and 4 data were retrospectively generated from the ground truth factor 12 data.
All data were acquired on a SIEMENS Skyra 3.0 T scanner (Siemens Medical Solutions, Erlangen, Germany). Eight phantoms were made with titanium metals of various shapes and sizes that were embedded in 4% agarose solution. For each phantom, proton-density, T1, and T2 weighted images were acquired with SEMAC factor 12, yielding total of 24 image sets. The imaging parameters were: TR/TE = 3500.0/34.0ms for PD4, 600.0/6.9ms for T1, and 3500.0/83.0ms for T2, FOV = 180 × 135 , number of slices = 20, slice thickness = 3.0 mm, matrix size = 256 × 192, flip angle = 120° for PD/T2 and 150° for T1, concatenation = 1 for PD/T2 and 2 for T1, Partial Fourier = 81%, 61%, 74% for PD, T1, and T2, respectively, and scan time = 9.2 min for PD/T2 and 9.4 min for T1. Seven out of the eight phantom datasets were used for training and the remaining one dataset was used for testing, which was repeated by changing test dataset to achieve 8-fold cross validation.
Total 77 subjects who underwent surgery involving metallic neuro plating instruments were included for this study approved by institutional review board. T2-weighted SEMAC data were acquired with factor 12. The imaging parameters were: TR/TE = 2800.0/83.0ms, FOV = 230 × 172, number of slices = 16-20, slice thickness = 4.0mm, matrix size = 256 × 192, flip angle = 120°, Partial Fourier = 66%, and GRAPPA factor = 2. The resulting scan time was 4.5 minutes. 60 Sets were used for training, 2 for validating, and 15 for testing.
T1-weighted image data were acquired from two subjects with parameters: TR/TE = 842.0-1170.0/6.9ms, FOV = 230 × 172, number of slices = 20, slice thickness = 4.0mm, matrix size = 256 × 192, flip angle = 137°-150°, Partial Fourier = 60%, Phase encoding resolution = 75%. The T1-weighted images were used to check the generalizability of the model on different contrast.
The fully reconstructed input and output image sets from CNN were compared with the label reconstruction images through normalized root mean squared error (NRMSE), peak signal-to-noise ratio (PSNR), and structural similarity (SSIM) indices. P values less than 0.01 were considered statistically significant.
RESULTS
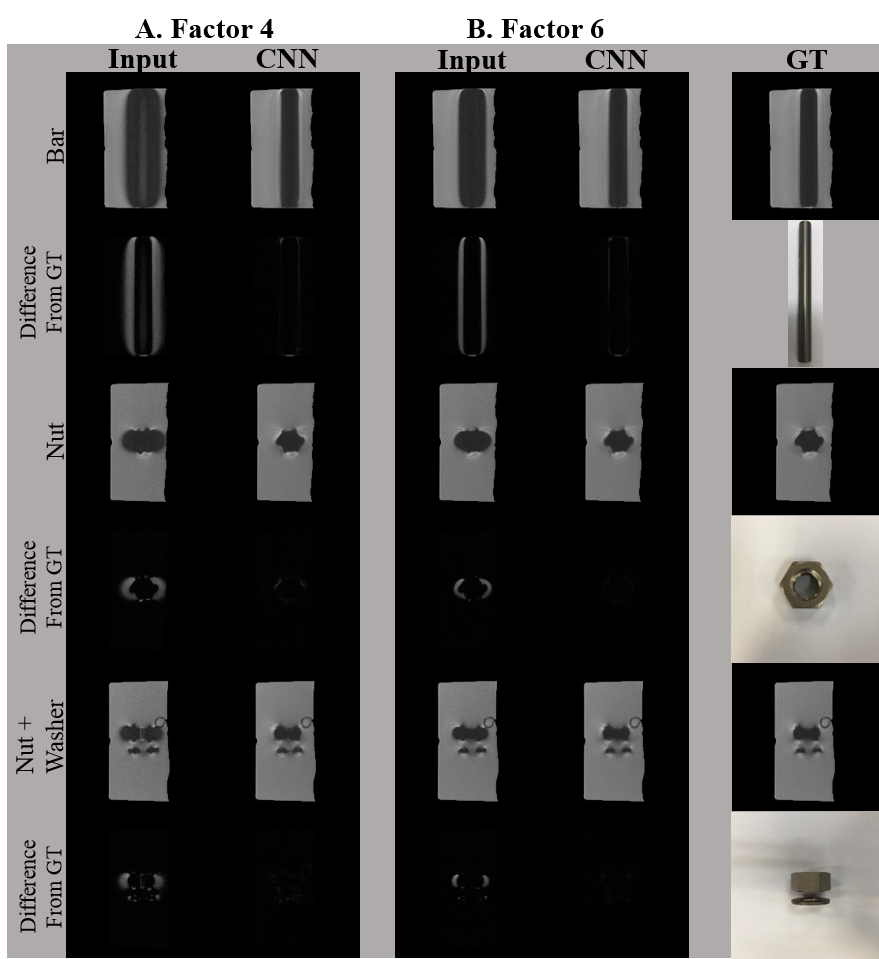
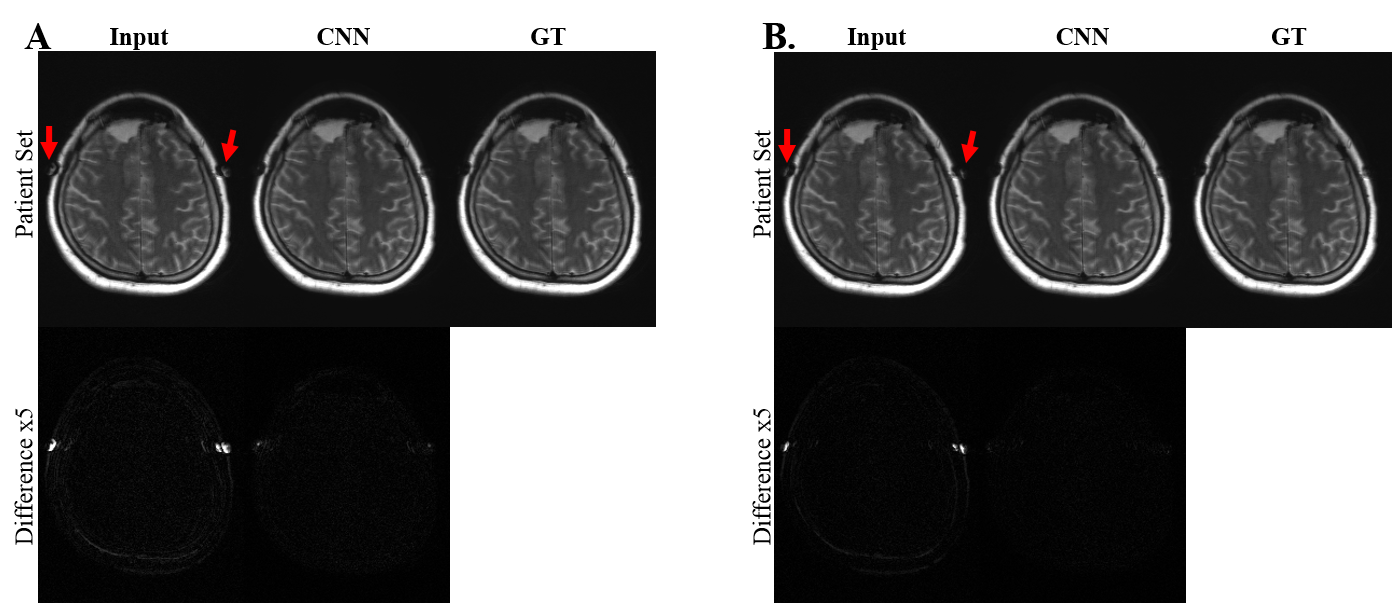
Figure 1 shows phantom images of metal artifact suppression through the combination of the encoded images for the conventional SEMAC (input 4 and 6) and CNN, in comparison with the ground truth (SEMAC factor 12). CNN showed visually significantly reduced metal artifacts, regardless of the SEMAC factor and image type, which is more clearly shown in the difference images. The visual observations were consistent with the quantitative analyses (Table 1), improvement of which was statistically significant.For the in vivo test, the metallic neuro plating instruments around the patients’ skull induced artifacts along the skull as well as along the cerebral structure (Figure 2). The difference images show clear reduction of signal pileups and voids through CNN, quality of which was visually comparable to that of the ground truth. Table 2 shows quantitative measures for the in vivo tests, which shows statistically significant improvement.
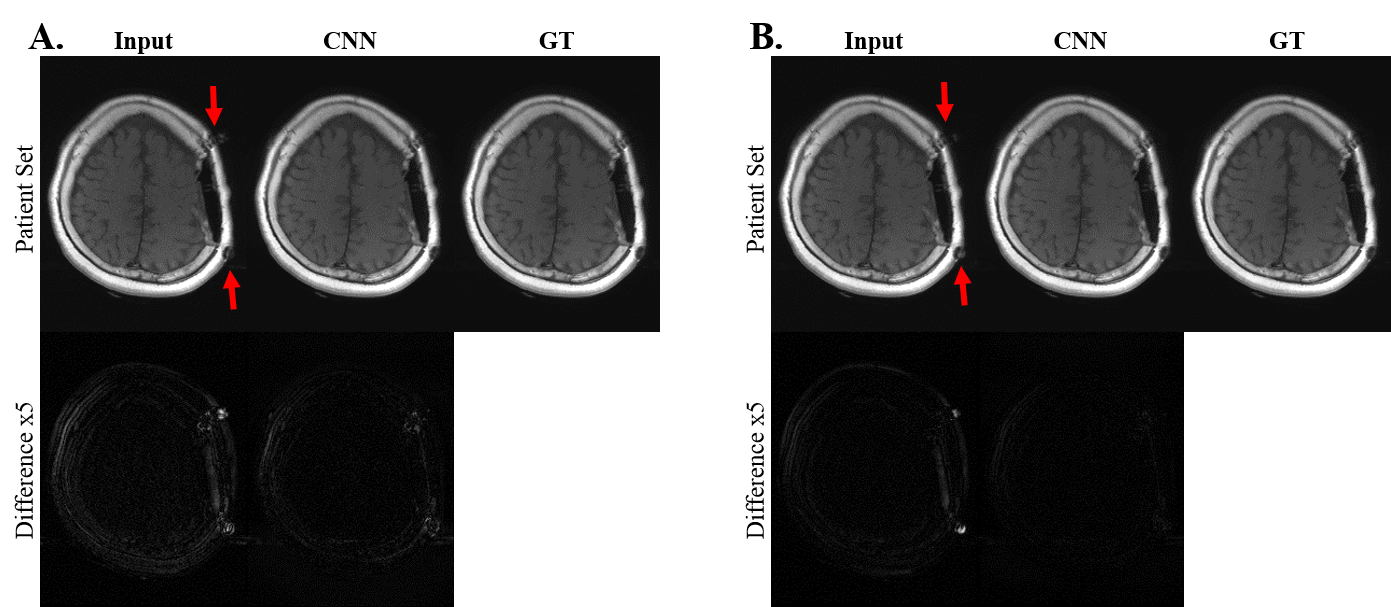
Further test on the T1 data through CNN model trained only with T2 dataset is visualized in Figure 3. For both factors 6 and 4, clear visual metal artifact suppression could be observed, which is also demonstrated in Table 2.
DISCUSSION and CONCLUSION
Our study provided a promising approach to solving the metallic disruption problem in MRI by combining an existing state‑of‑the‑art metal artifact suppression method, SEMAC, with CNN in a seamless manner. Applications on in vivo data demonstrated the potential clinical utility of the proposed method. Further studies are necessary to demonstrate its feasibility on other body parts such as knee or hip replacement.Acknowledgements
No acknowledgement found.References
1. Lu W, Pauly KB, Gold GE, Pauly JM, Hargreaves BA. SEMAC: Slice Encoding for Metal Artifact Correction in MRI. Magn Reson Med 2009;62(1):66-76.
2. Seo S, Kim KH, Choi SH, Park S-H. Artificial Neural Network for Suppression of Metal Artifacts with Slice Encoding for Metal Artifact Correction (SEMAC) MRI. 2018; Paris, France. p Abstract No. 3385.
3. Ronneberger O, Fischer P, Brox T. U-Net: Convolutional Networks for Biomedical Image Segmentation. Medical Image Computing and Computer-Assisted Intervention – MICCAI 2015; 2015; Cham. Springer International Publishing. p 234-241. (Medical Image Computing and Computer-Assisted Intervention – MICCAI 2015).
4. Reichert M, Ai T, Morelli JN, Nittka M, Attenberger U, Runge VM. Metal artefact reduction in MRI at both 1.5 and 3.0 T using slice encoding for metal artefact correction and view angle tilting. Br J Radiol 2015;88(1048):20140601.
Figures