0659
Reduction of vibration-induced signal loss by matching mechanical vibrational states: application in high b-value diffusion weighted MRS1Department of Diagnostic and Interventional Radiology, Technical University of Munich, Munich, Germany, 2Chair of Vibroacoustics of Vehicles and Machines, Technical University of Munich, Munich, Germany
Synopsis
Diffusion gradients are known to yield MR hardware vibrations, which may lead to signal loss in DW measurements especially at high b-values. The present work proposes to mitigate vibration-induced signal loss by introducing a vibration matching gradient (VMG). Laser interferometry was employed to measure the displacements induced by high b-value DW MR spectroscopy, focusing on the quantification of lipids ADC. The measured displacement patterns during the two diffusion gradients were more similar when using the VMG. The application of VMG showed an improvement in lipid ADC quantification in both a water-fat phantom and a volunteer’s tibial bone marrow.
Purpose
Diffusion-weighted (DW) magnetic resonance (MR) is a powerful tool for the non-invasive assessment of tissue microstructure and is widely applied in clinical routine and research(1). Sensitizing the measurement to diffusion requires strong diffusion gradients bringing up technical challenges related to increased sensitivity to motion(2), eddy currents(3) and scanner table vibrations(4). Specifically, diffusion gradients were shown to yield scanner hardware vibrations(5,6). The observed influences of vibration-induced motion include reports of signal loss in brain DW images(7,8) and increased lipid ADC in regions close to the scanner table(4). Multiple research applications require high b-value DW measurements, including high resolution diffusion tensor imaging(9) or the assessment of fat microstructure(10-12). Specifically, measuring lipid diffusion properties has proven to be challenging because fat has a diffusion coefficient approximately two orders of magnitude lower than water(4,13). The assessment of fat microstructure is important in the study of adipose tissue and ectopic lipids in both health and metabolic dysfunction. Particularly, the quantification of lipid droplet size is of great interest in skeletal muscle(14), metabolic(15) and bone marrow research(16). Measuring high resolution diffusion features or diffusion restriction effects requires the acquisition of an artifact-free high b-value DW signal. Motion during DW induces accumulated phase and eventually leads to signal cancellations due to intravoxel dephasing(17). The present work proposes an additional gradient, called vibration matching gradient (VMG), placed before the diffusion sensitizing period to mitigate vibration-induced signal loss.Methods
Theory: Fig.1 shows the induced vibrations by the first diffusion gradient (DG1) that are present during the second diffusion gradient (DG2). The vibration-induced displacements lead to accumulated phase during DG2 not present in DG1. By applying the VMG, the displacement patterns in DG1 and DG2 match and therefore the signal loss is mitigated.Pulse sequence: A bipolar DW stimulated echo acquisition mode (STEAM) MRS sequence (Figure 1) was employed. The sequence was based on a STEAM sequence with gradients added after the first and third RF pulse to induce DW (18). A VMG with identical properties as DG1 was added. The data processing included zero order phasing, apodization and frequency alignment. Quantification was performed on the real spectrum fitting eight fat peaks (18). Only the methylene peak (1.3ppm) was analysed for the ADC quantification.
Interferometry: The displacements on an agar phantom surface were measured by a laser doppler interferometer with 1,550nm wavelength (PSV-500-3D-Xtra, Polytec, Waldbronn). All experiments were performed on a 3T scanner (Ingenia Elition, Philips, Best) using an 8-channel wrist coil on the scanner table and on a wooden decoupling table that decoupled the sample and the vibrating scanner table. The sequence parameters were: VOI: (15mm)3, TE/TM/TR: 60/300/1800ms. First, the agar phantom was placed on the scanner table and a high b-value (50,000s/mm2) DW MRS experiment was performed with varying timing of the VMG (TVMG: 50ms to 650ms in 5ms steps). The displacements during both diffusion gradients were extracted and the theoretical accumulated phase was calculated. To access lipid diffusion, the experiment was repeated in an 80% fat fraction water–fat (WF) phantom. Second, TVMG matched the diffusion time (Δ) and the displacements were acquired on the whole phantom open surface. Three different scenarios were measured: phantom placed on scanner table without and with VMG and placed on a decoupling table without VMG. The local accumulated phase and total signal was then calculated.
Lipid ADC measurements: The lipid ADC was measured in a WF phantom and a volunteer’s tibia bone marrow. The phantom experiment was performed for the three interferometer measurement scenarios. In vivo, three repeated scans were performed using an 8-channel extremity coil without and with the VMG and with additional weight on the scanner table (0/10/20kg) to change the mechanical loading. Parameters differing from the interferometer measurements were averages: 16, b-values: 10,000/20,000/40,000/60,000s/mm2.
Results
Interferometry: Fig.2 shows the displacements during both diffusion gradients for three TVMG. The displacement patterns varied when TVMG was unequal to Δ. When TVMG approached Δ, the displacement curves were similar. Fig.3 shows the accumulated phase and methylene signal. The accumulated phase oscillated with a similar but inverted pattern as the methylene signal. When TVMG matched Δ, maximum signal and corresponding minimum accumulated phase values were observed. Fig.4 shows the accumulated phase for the 2D surface. Relative to the scenario on the decoupling table without VMG, a reduction of 5% (without VMG) and 1% (with VMG) was observed on the scanner table.Lipid ADC measurements: Fig.5A shows that the lipid ADC was overestimated by 119% without VMG compared to a relative error of 5.5% with VMG when the WF phantom was measured on the scanner table. Figure 5B shows that without VMG the in vivo ADC was depending on the additional loading. Combing all measurements, the ADC was 14.8±0.4x10⁻⁶mm2/s without VMG compared to 14.6±0.2x10⁻⁶mm2/s with VMG (coefficient of variation was reduced by 35%).
Discussion & Conclusion
A method was proposed to mitigate signal loss induced by scanner table vibrations in DW measurements. When placing the VMG before the actual high b-value DW, interferometry revealed that the displacements during the diffusion gradients were more similar. With the VMG the lipid ADC quantification was improved in phantom and in vivo. The proposed approach can be theoretically applied in other DW MR sequences.Acknowledgements
We would like to thank the company Polytec GmbH for their support in performing the laser interferometer measurements. We would also like to thank Professor Rainer Burgkart for his help in the construction of the decoupling table and Curtis L. Johnson for the valuable discussion. The present work was supported by the European Research Council (grant agreement No 677661, ProFatMRI). This work reflects only the authors view and the EU is not responsible for any use that may be made of the information it contains. The authors acknowledge finally research support from Philips Healthcare.References
1. Derek K. Jones P. Diffusion MRITheory, Methods, and Applications: Oxford University Press; 2012.
2. Anderson. Analysis and correction of motion artifacts in diffusion weighted imaging. Magn Reson Med 1994;32(3):379-387.
3. Reese TG, Heid O, Weisskoff RM, Wedeen VJ. Reduction of eddy-current-induced distortion in diffusion MRI using a twice-refocused spin echo. Magn Reson Med 2003;49(1):177-182.
4. Steidle G, Eibofner F, Schick F. Quantitative Diffusion Imaging of Adipose Tissue in the Human Lower Leg at 1.5 T. Magnetic Resonance in Medicine 2011;65(4):1119-1125.
5. Hiltunen J, Hari R, Jousmaki V, Muller K, Sepponen R, Joensuu R. Quantification of mechanical vibration during diffusion tensor imaging at 3 T. Neuroimage 2006;32(1):93-103.
6. Gallichan D, Robson MD, Bartsch A, Miller KL. TREMR: Table-resonance elastography with MR. Magn Reson Med 2009;62(3):815-821.
7. Gallichan D, Scholz J, Bartsch A, Behrens TE, Robson MD, Miller KL. Addressing a systematic vibration artifact in diffusion-weighted MRI. Hum Brain Mapp 2010;31(2):193-202.
8. Berl MM, Walker L, Modi P, Irfanoglu MO, Sarlls JE, Nayak A, Pierpaoli C. Investigation of vibration-induced artifact in clinical diffusion-weighted imaging of pediatric subjects. Hum Brain Mapp 2015;36(12):4745-4757.
9. Setsompop K, Kimmlingen R, Eberlein E, Witzel T, Cohen-Adad J, McNab JA, Keil B, Tisdall MD, Hoecht P, Dietz P, Cauley SF, Tountcheva V, Matschl V, Lenz VH, Heberlein K, Potthast A, Thein H, Van Horn J, Toga A, Schmitt F, Lehne D, Rosen BR, Wedeen V, Wald LL. Pushing the limits of in vivo diffusion MRI for the Human Connectome Project. Neuroimage 2013;80:220-233.
10. Cao P, Fan SJ, Wang AM, Xie VB, Qiao Z, Brittenham GM, Wu EX. Diffusion magnetic resonance monitors intramyocellular lipid droplet size in vivo. Magn Reson Med 2015;73(1):59-69.
11. Verma SK, Nagashima K, Yaligar J, Michael N, Lee SS, Xianfeng T, Gopalan V, Sadananthan SA, Anantharaj R, Velan SS. Differentiating brown and white adipose tissues by high-resolution diffusion NMR spectroscopy. J Lipid Res 2017;58(1):289-298.
12. Weidlich D, Honecker J, Gmach O, Wu M, Burgkart R, Ruschke S, Franz D, Menze BH, Skurk T, Hauner H, Kulozik U, Karampinos DC. Measuring large lipid droplet sizes by probing restricted lipid diffusion effects with diffusion-weighted MRS at 3T. Magn Reson Med 2019;81(6):3427-3439.
13. Lehnert A, Machann J, Helms G, Claussen CD, Schick F. Diffusion characteristics of large molecules assessed by proton MRS on a whole-body MR system. Magn Reson Imaging 2004;22(1):39-46.
14. Suzuki M, Shinohara Y, Ohsaki Y, Fujimoto T. Lipid droplets: size matters. J Electron Microsc (Tokyo) 2011;60 Suppl 1:S101-116.
15. Cousin B, Cinti S, Morroni M, Raimbault S, Ricquier D, Penicaud L, Casteilla L. Occurrence of brown adipocytes in rat white adipose tissue: molecular and morphological characterization. J Cell Sci 1992;103 ( Pt 4):931-942.
16. Scheller EL, Doucette CR, Learman BS, Cawthorn WP, Khandaker S, Schell B, Wu B, Ding SY, Bredella MA, Fazeli PK, Khoury B, Jepsen KJ, Pilch PF, Klibanski A, Rosen CJ, MacDougald OA. Region-specific variation in the properties of skeletal adipocytes reveals regulated and constitutive marrow adipose tissues. Nat Commun 2015;6:7808.
17. Callaghan PT. Principles of nuclear magnetic resonance microscopy: Oxford University Press on Demand; 1993.
18. Ruschke S, Kienberger H, Baum T, Kooijman H, Settles M, Haase A, Rychlik M, Rummeny EJ, Karampinos DC. Diffusion-weighted stimulated echo acquisition mode (DW-STEAM) MR spectroscopy to measure fat unsaturation in regions with low proton-density fat fraction. Magn Reson Med 2016;75(1):32-41.
Figures
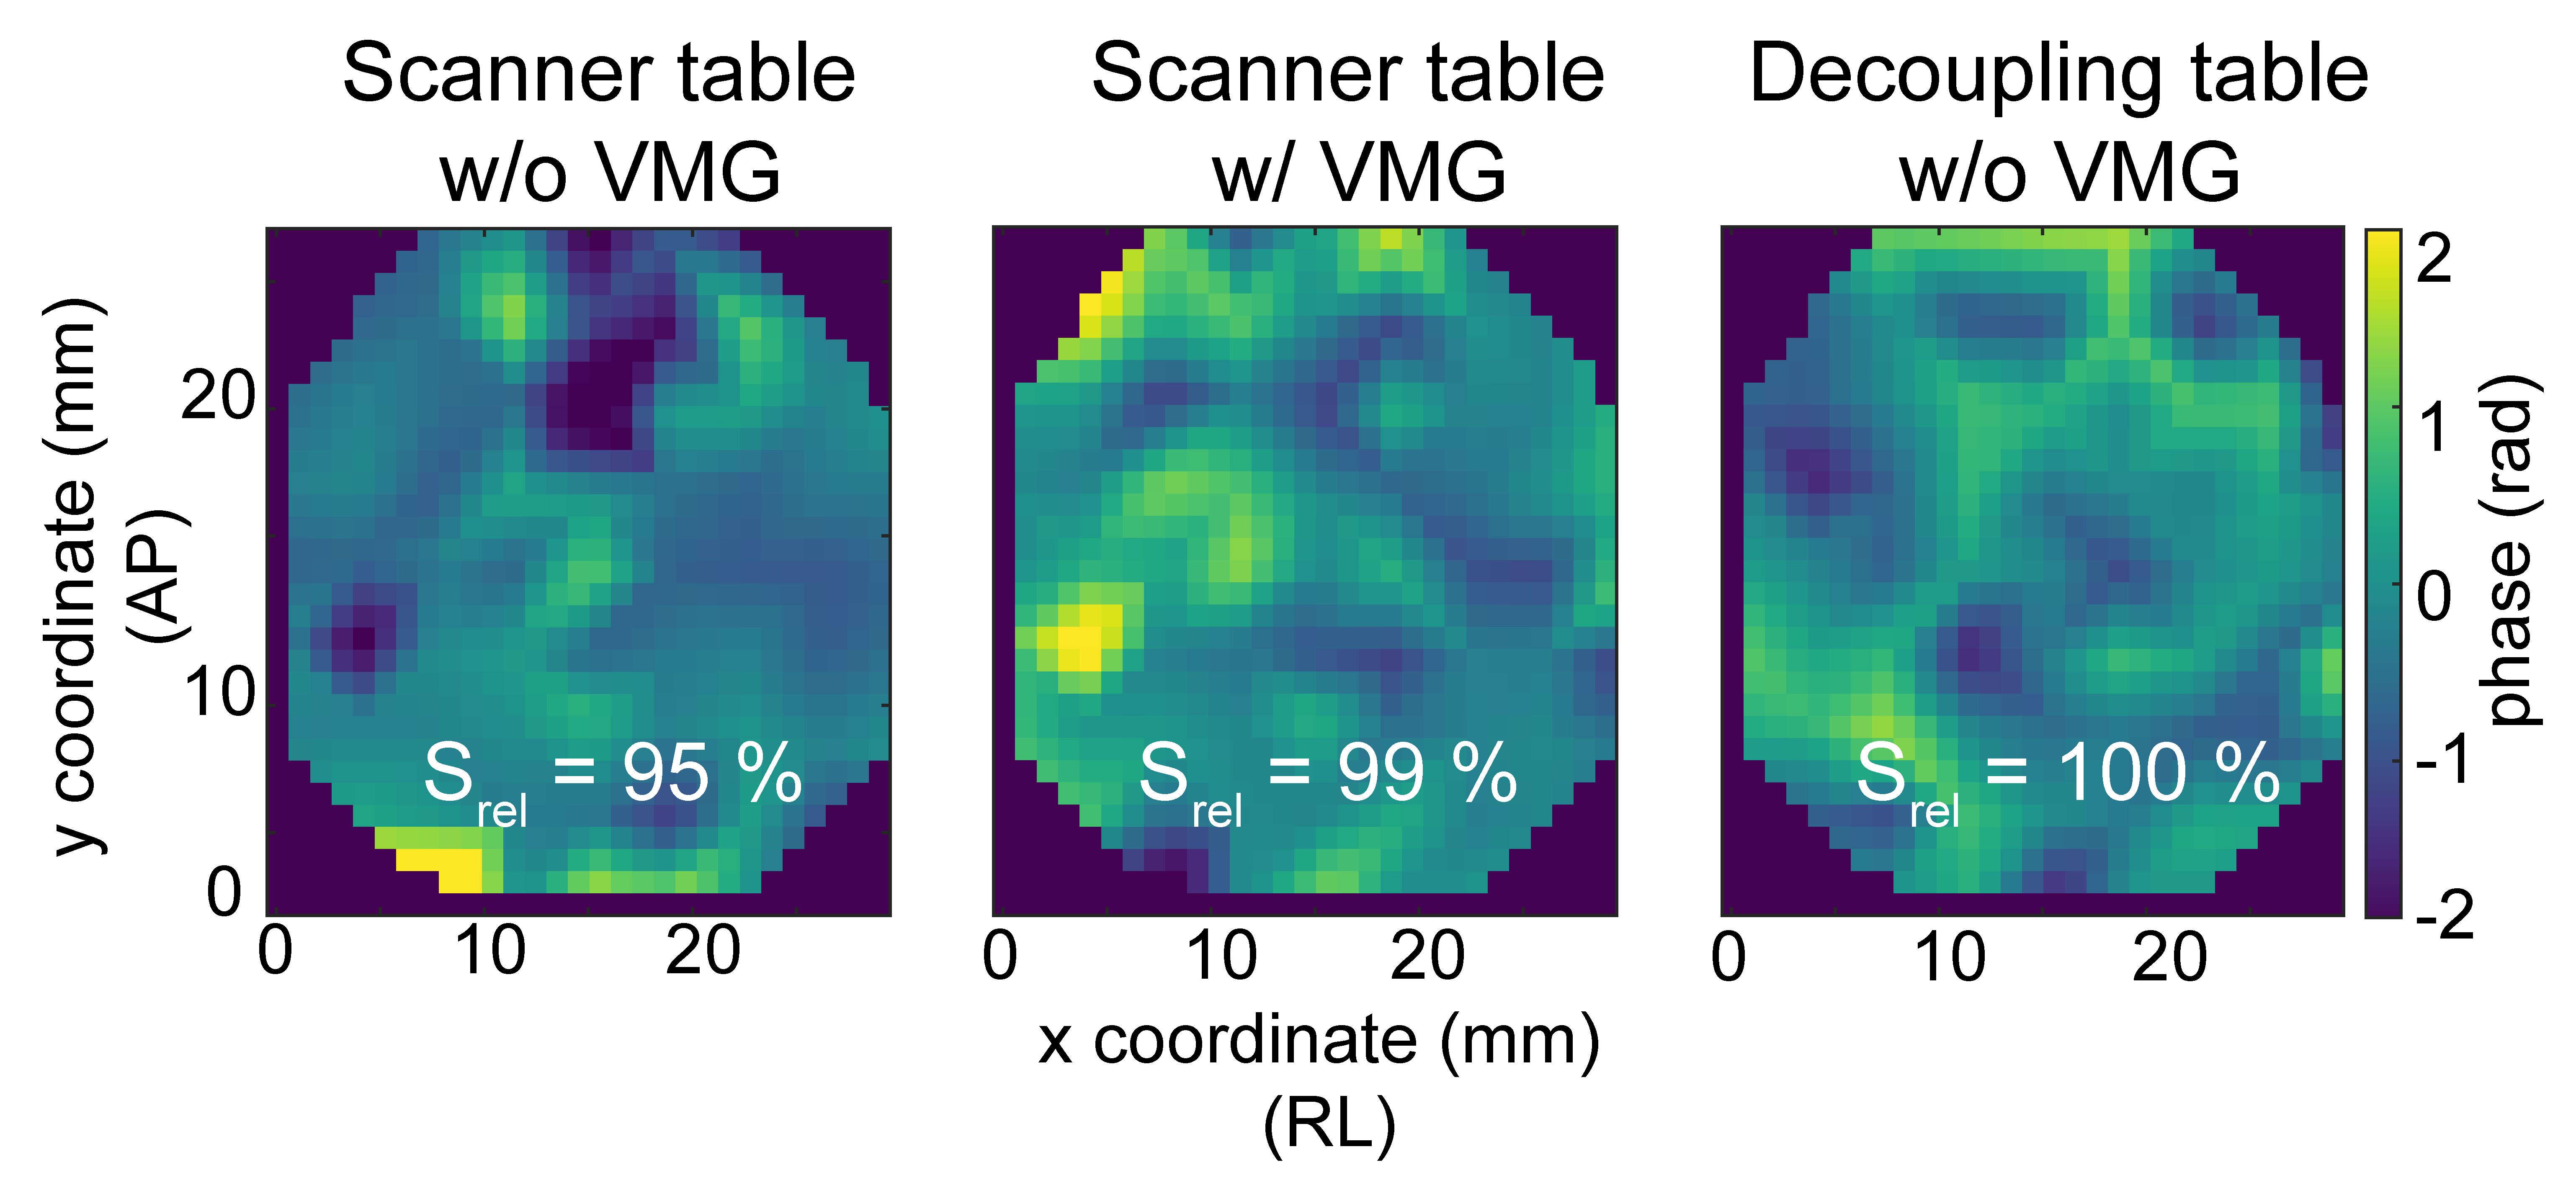
Accumulated phase on a 2D surface on top of agar phantom for three different scenarios. Phantom placed on the scanner table without VMG, phantom placed on the scanner table with VMG and phantom placed on the decoupling table without VMG. When the phantom was solely placed on the scanner table, a 5 % decay of the total signal was observed in the measured surface. When the phantoms were placed on the scanner table with the VMG only a 1 % decay of the signal was observed. Larger signal decay is expected when displacements over a 3D volume instead of over a 2D surface are measured.