0657
A simple method to estimate gradient delay for MRF1Human Brain Research Center, Graduate School of Medicine, Kyoto University, Kyoto, Japan, 2Center for Advanced Imaging Innovation and Research (CAI2R) and Bernard and Irene Schwartz Center for Biomedical Imaging, Department of Radiology, New York University School of Medicine, New York, NY, United States
Synopsis
A self-contained method to estimate the gradient delay for radial based MRF sequences based on the residual error after dictionary matching was presented. Under IRB approval, MRF was performed in two healthy volunteers at 7T. Images were reconstructed with varying degrees of gradient offset in the readout direction. The correlation of the dictionary match (i.e. inner product of the compressed data with the matched dictionary entry) was recorded. The average signal intensity within the head ROI in the “match map” gave the best result, and hence could be an easy and reliable metric for gradient delay correction.
introduction
Magnetic Resonance Fingerprinting (MRF) enables simultaneous quantification of tissue properties by utilizing a pseudo-random radiofrequency (RF) pulse train and comparing the obtained signal evolutions to the entries in a dictionary simulated based on the Bloch equation (1). Most MRF implementations use a non-Cartesian trajectory in k-space to achieve a rapid and efficient sampling (2-7). However, delays in gradient timing can lead to a shift in k-space along the readout direction. For Cartesian sampling, such delays simply shift the image in space. However, when a radial trajectory is used, the image is blurred and/or streak artifacts appear. Therefore, it is very important to correctly estimate this gradient delay in radial imaging sequences (8-10) and radial based MRF methods (11). Here, we propose a self-contained method to estimate the gradient delay for radial MRF sequences based on the residual error after dictionary matching.Methods: Sequence design
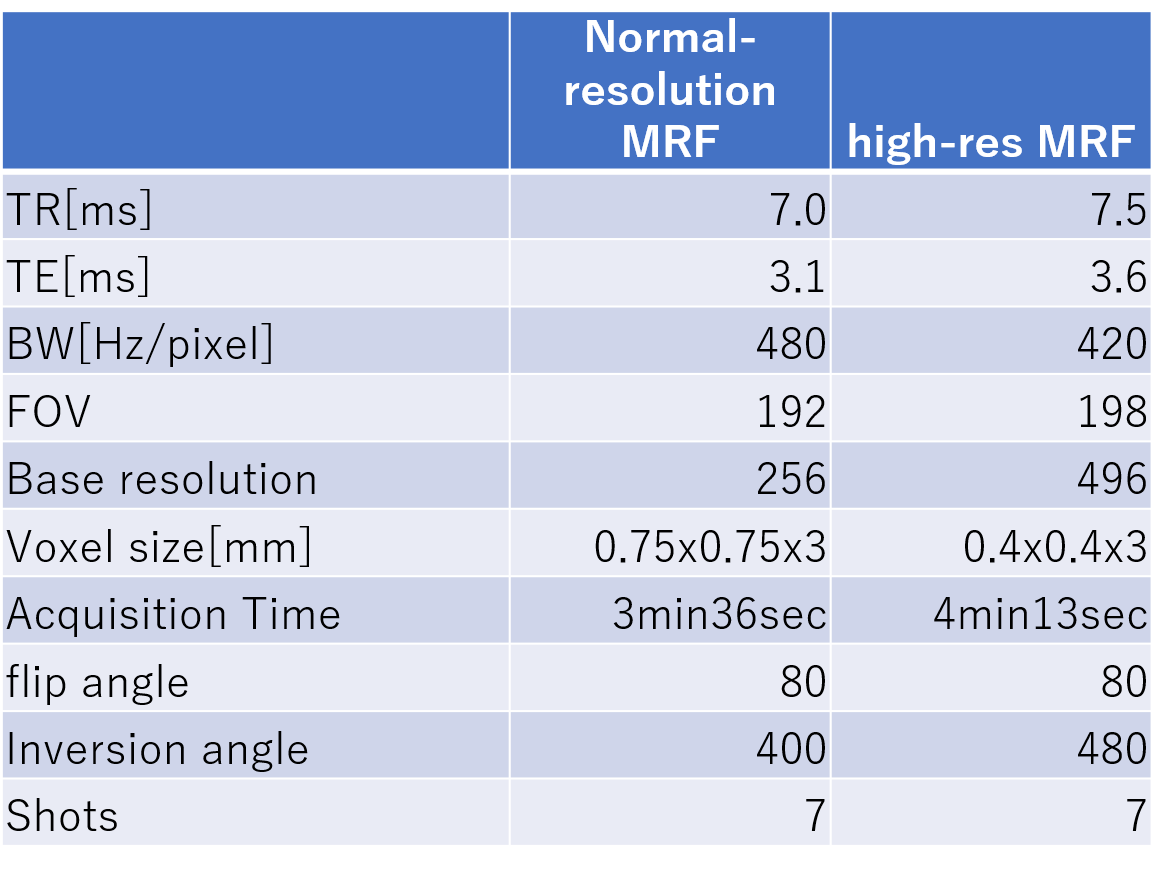
In this work, a single channel (CP) version of the PnP-MRF sequence is used (6; 12; 13). The sequence consists of segments of FISP and FLASH with variable flip angles. The FLASH segments encode B1+ and T1, and the FISP segments additionally encode T2 relaxation component. A non-selective adiabatic inversion pulse was applied at the beginning of each FA train. A constant TR and 2D radial readout with an increment of golden angle was used (14). The sequence parameters were selected based on (13; 15) see a Table 1.Methods: Experiments
All experiments were performed on an investigational whole-body 7T scanner (MAGNETOM 7T, Siemens Healthineers, Erlangen, Germany) equipped with body gradients and a 1ch Tx, 32ch Rx coil (Nova Medical, Wilmington, MA). Under the IRB approval, data was acquired in two healthy volunteers (45y.o., male and 51y.o., female).Methods: Post-processing
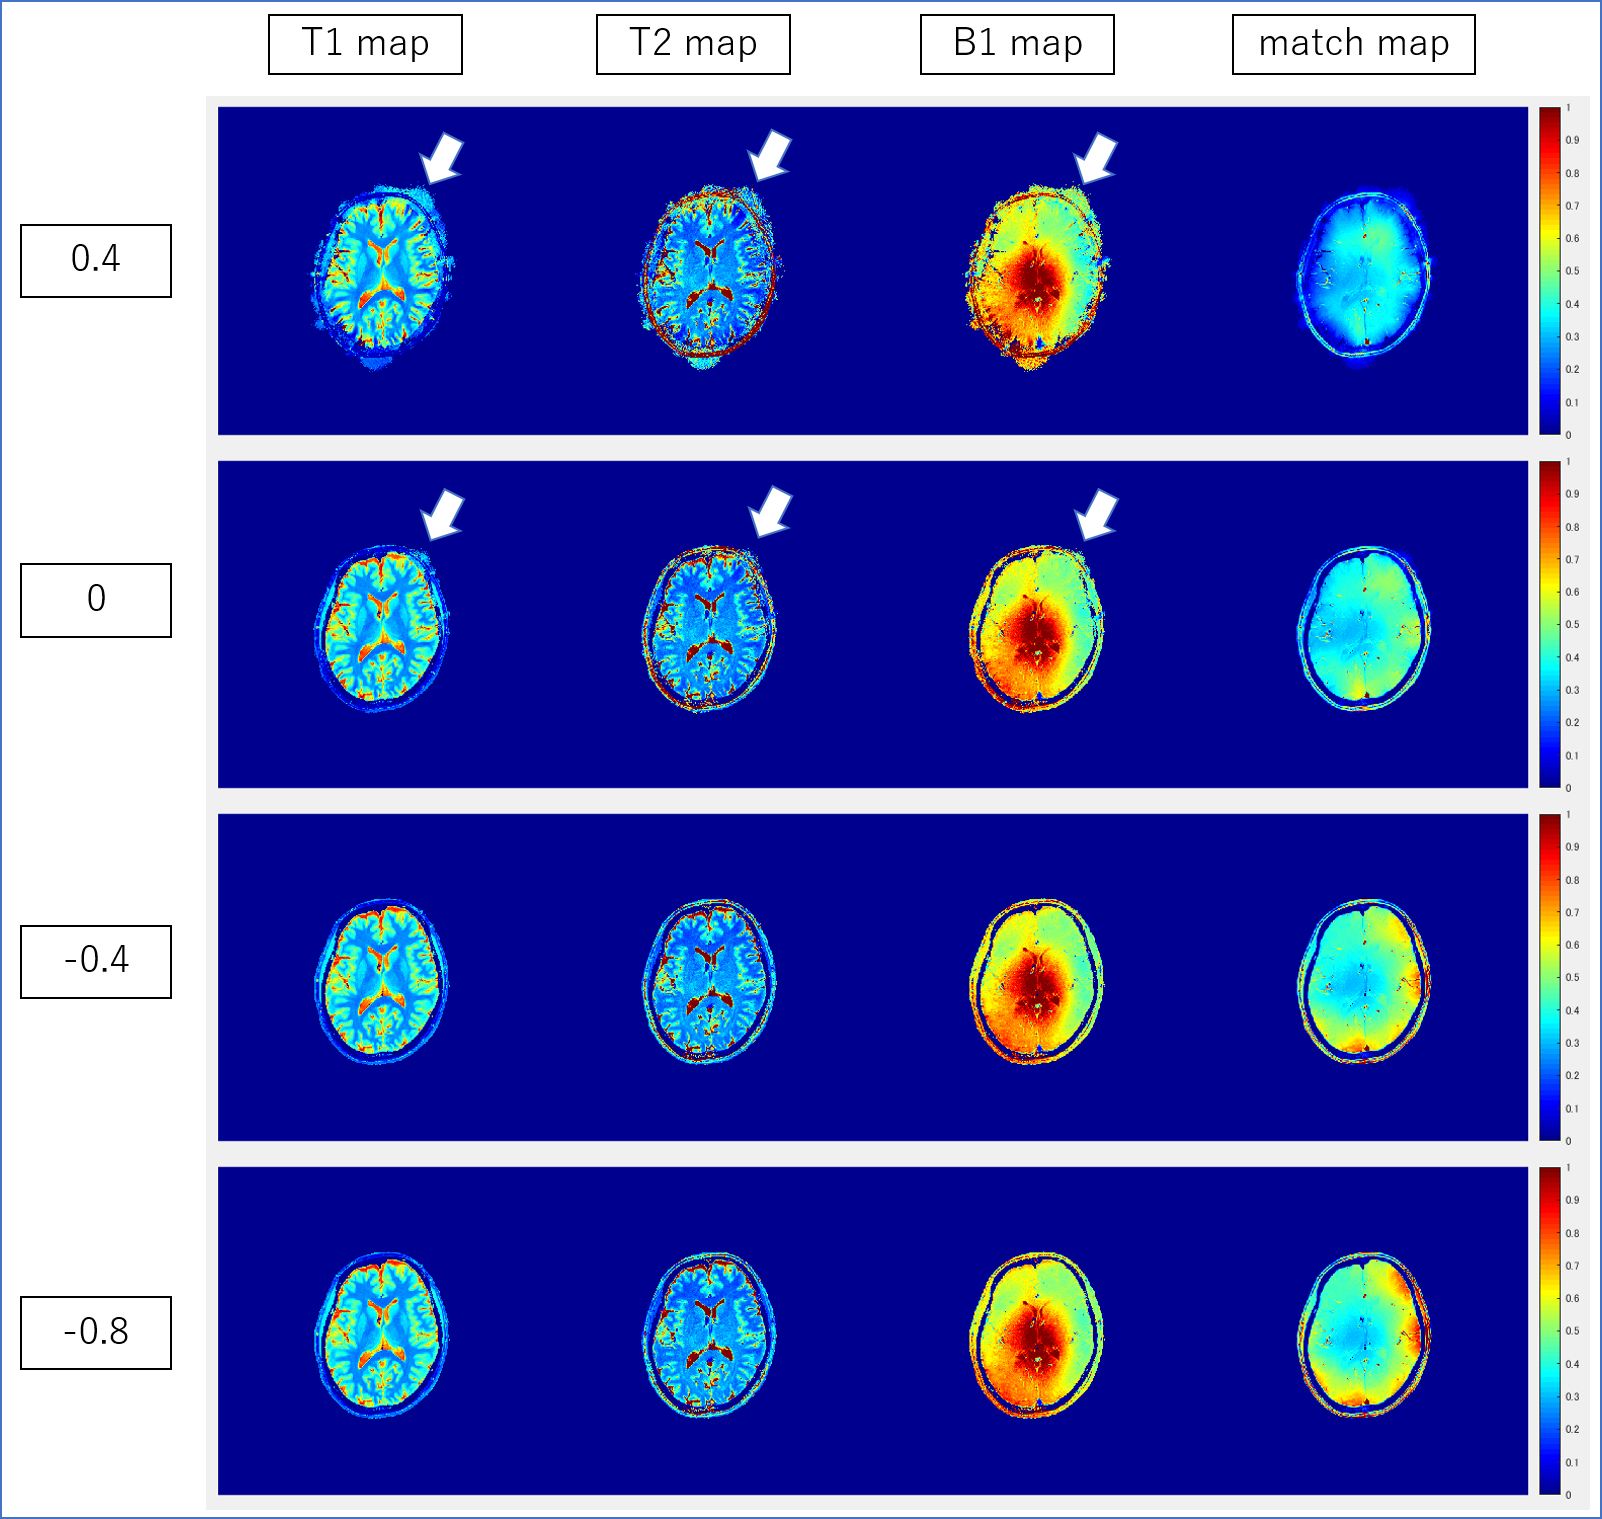
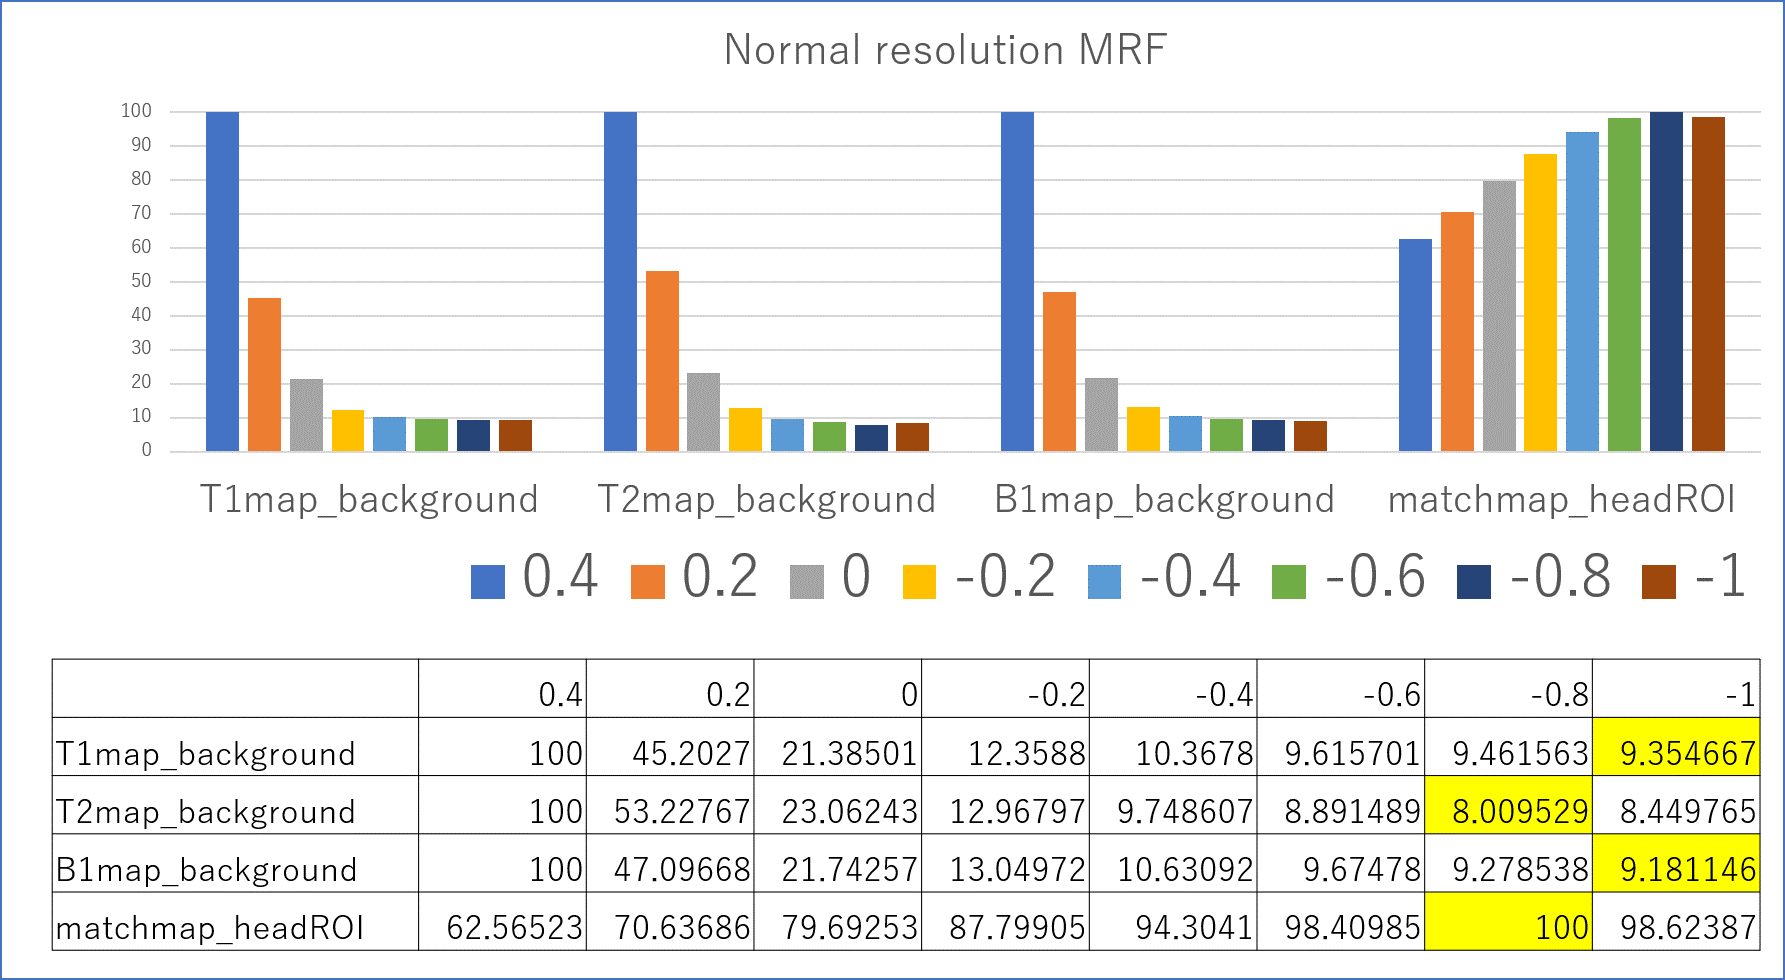
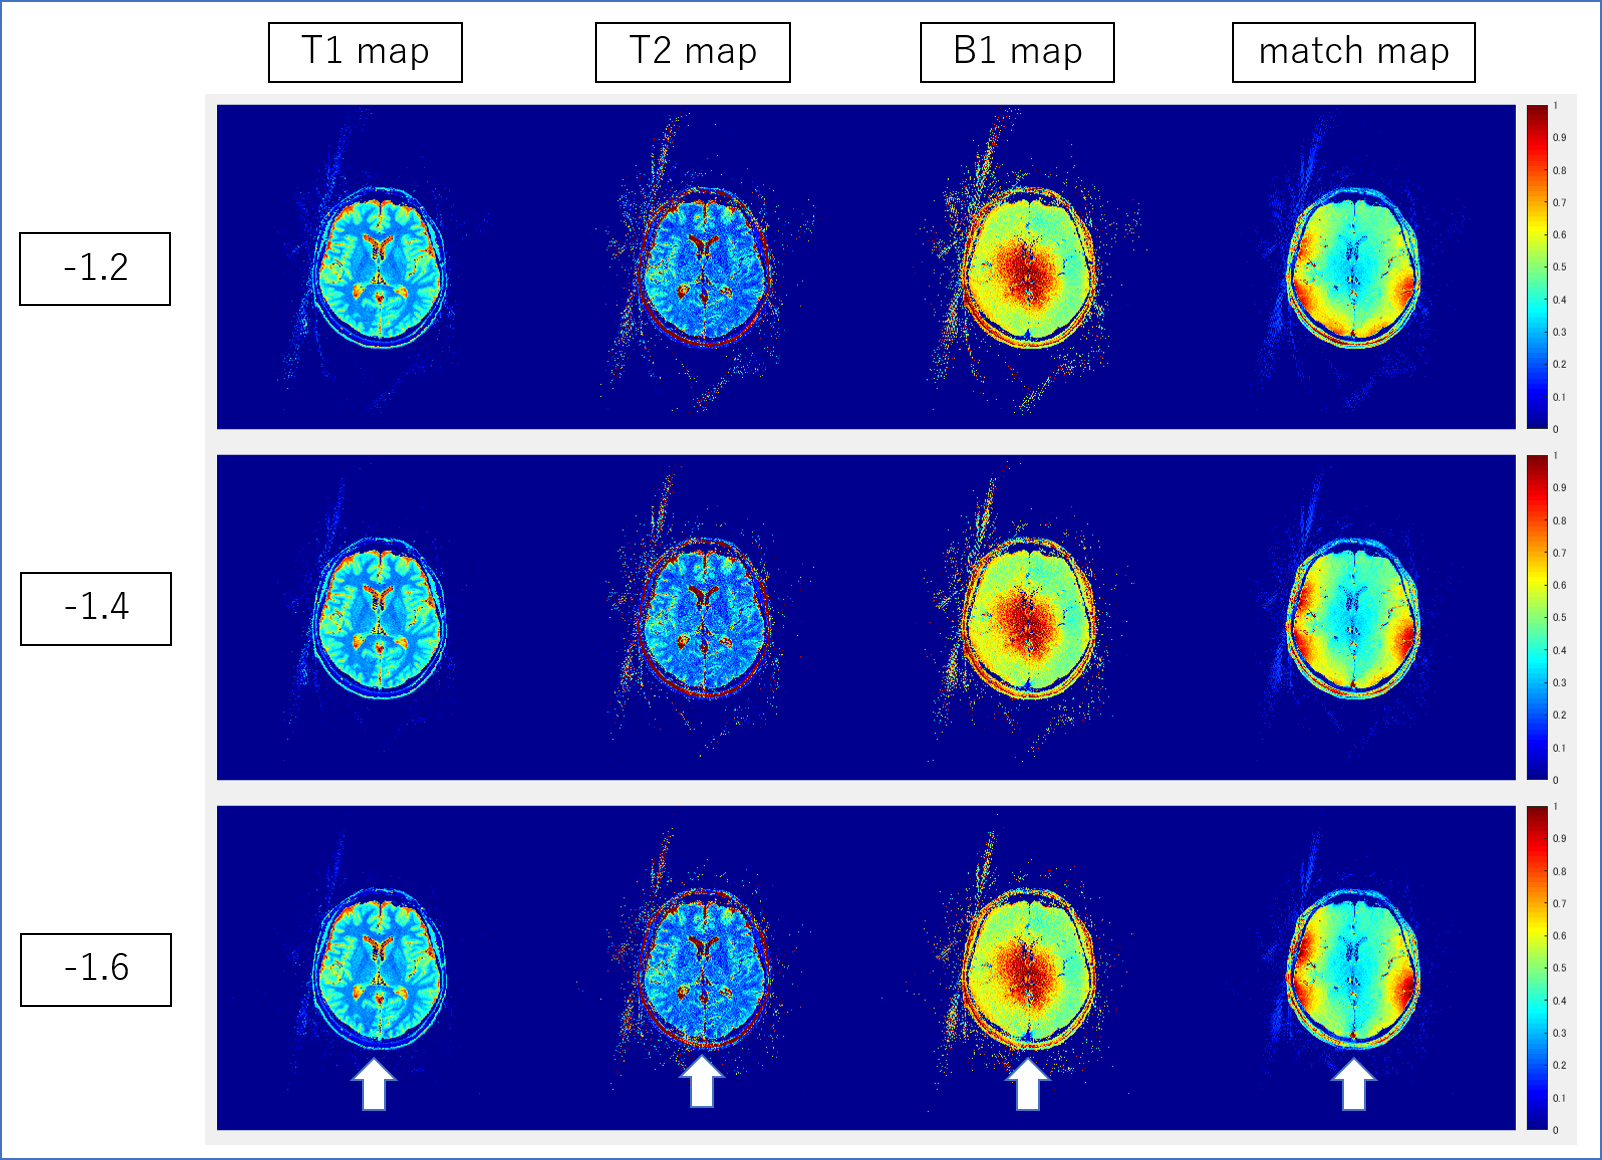
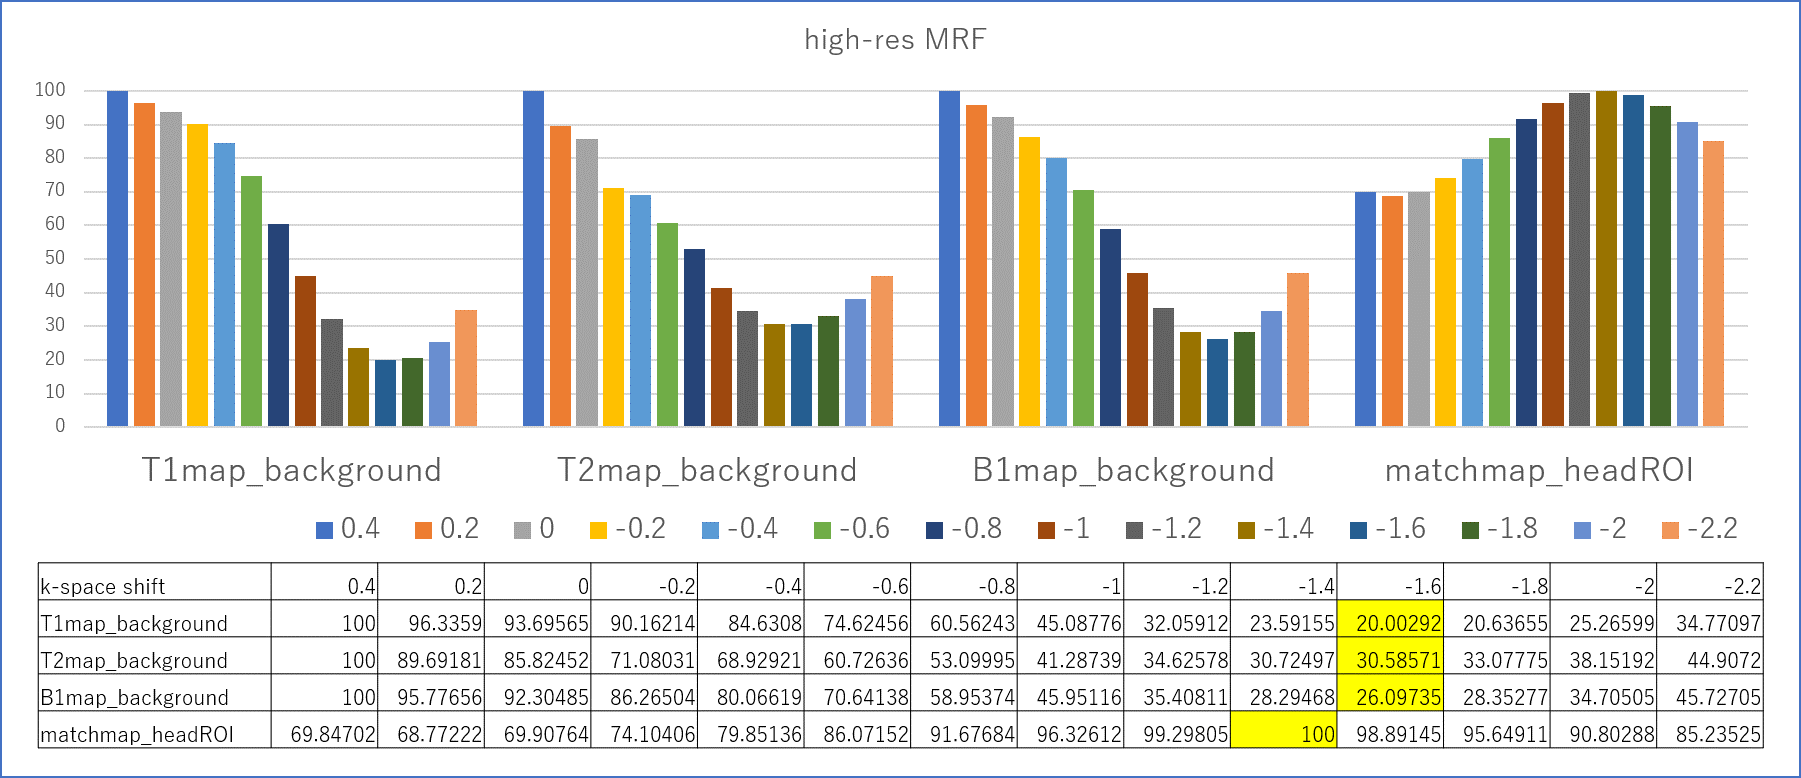
Images were reconstructed with in-house Matlab (MathWorks, Natick, MA, USA) scripts. Prior to dictionary matching, data compression with SVD was used to reduce computational time without reducing matching accuracy (16). Images were reconstructed with varying degrees of gradient offset in the readout direction. Specifically, the gradient delay was varied from -1.0 to 0.4 (normal resolution MRF) or -2.2 to 0.4 (high-resolution MRF) delta k in k-space with increments of 0.2. In addition to parametric (T1/T2/B1+) maps, the correlation of the dictionary match (i.e. inner product of the compressed data with the matched dictionary entry) was recorded in what hereafter we will refer to as a “match map”. To find the optimal readout shift a rough ROI of head was drawn manually. The average correlation within the ROI in the “match map” was considered to reflect overall matching accuracy. As such, we hypothesized that the k-space shift value with the best average matching accuracy may indicate the optimal gradient delay correction and produce the best parametric map. For comparison, we also considered the average signal intensities outside of the ROI in T1/T2/B1 maps which might be considered to provide an estimate of the noise and artifacts in the parametric maps.Results & Discussion
Representative examples of parametric maps and match maps using different k-space shifts are shown in figure 1 and 3. The mean values in the background of the T1/T2/B1 maps and the average values within the head ROI in the match map for different k-space shifts are summarized in Figures 2 and 4. When using our normal resolution protocol (0.75x0.75x3mm), the k-space shift of -0.8 [delta k] gave the highest average match. For the high-resolution (0.4x0.4x3mm) setting, the k-space shift of -1.4 [delta k] gave the best match. When using the background noise to estimate the optimal shift a delta k of -1 was found for normal resolution, and -1.6 [delta k] for our high-resolution setting. The difference in the optimal shift in k-space can be explained by a simple formula: optimal shift in k-space gradient delay(μs)*number of pixels/BW in readout direction. After visual inspection of the image quality, images with a k-space shift derived from the best “match map” showed the least artifacts in the parametric map. The effect of image degradation was more severe in the high-res scan than the normal resolution scan, where accurate gradient delay correction is more crucial.Conclusion
The inner product of the measured data and the dictionary entry can be an easy and reliable metric for gradient delay correction. Gradient delays in radial MRF acquisitions can accurately be estimated based on the best “matched map”. Because this approach does not require any additional calibration data it can be easily and reliably applied to existing MRF data.Acknowledgements
A research grant of Siemens Healthcare K.K.References
1. Ma D, Gulani V, Seiberlich N, Liu K, Sunshine JL, Duerk JL, Griswold MA: Magnetic resonance fingerprinting. Nature 2013;495:187-192
2. Rieger B, Zimmer F, Zapp J, Weingärtner S, Schad LR: Magnetic resonance fingerprinting using echo-planar imaging: Joint quantification of T. Magn Reson Med 2017;78:1724-1733
3. Hamilton JI, Jiang Y, Chen Y, Ma D, Lo WC, Griswold M, Seiberlich N: MR fingerprinting for rapid quantification of myocardial T. Magn Reson Med 2017;77:1446-1458
4. Jiang Y, Ma D, Keenan KE, Stupic KF, Gulani V, Griswold MA: Repeatability of magnetic resonance fingerprinting T. Magn Reson Med 2017;78:1452-1457
5. Badve C, Yu A, Rogers M, Ma D, Liu Y, Schluchter M, Sunshine J, Griswold M, Gulani V: Simultaneous T. Tomography 2015;1:136-144
6. Cloos MA, Knoll F, Zhao T, Block KT, Bruno M, Wiggins GC, Sodickson DK: Multiparametric imaging with heterogeneous radiofrequency fields. Nat Commun 2016;7:12445
7. Buonincontri G, Schulte RF, Cosottini M, Tosetti M: Spiral MR fingerprinting at 7T with simultaneous B1 estimation. Magn Reson Imaging 2017;41:1-6
8. Duyn JH, Yang Y, Frank JA, van der Veen JW: Simple correction method for k-space trajectory deviations in MRI. J Magn Reson 1998;132:150-153
9. Block KT, Uecker M. Simple Method for Adaptive Gradient-Delay Compensation in Radial MRI. In Proc Intl Soc Mag Reson Med 2011. Montreal
10. Rosenzweig S, Holme HCM, Wilke RN, Uecker M. Extending the Simple Method for Adaptive Gradient-Delay Compensation in Radial MRI. In Proc Int Soc Magn Reson Med 2018, 4207. Paris
11. Palombit A, Bertoldo A, Yu Z, Lattanzi R, Cloos M. Exploring the sensitivity of Magnetic Resonance Fingerprinting to k-space trajectory uncertainties. In Proc Intl Soc Mag Reson Med 2011, 4457. Montreal
12. Cloos MA, Assländer J, Abbas B, Fishbaugh J, Babb JS, Gerig G, Lattanzi R: Rapid Radial T. J Magn Reson Imaging 2019;50:810-815
13. Akasaka T, Fujimoto K, Cloos MA, Okada T. In Vivo Evaluation of MR Fingerprinting at 7T. In Proc Int Soc Magn Reson Med 2018, 3293. Paris
14. Winkelmann S, Schaeffter T, Koehler T, Eggers H, Doessel O: An optimal radial profile order based on the Golden Ratio for time-resolved MRI. IEEE Trans Med Imaging 2007;26:68-76
15. Fujimoto K, Cloos MA, Shima A, Thuy DHD, Sawamoto N, Takahashi R, Isa T, Okada T. Age-related changes in tissue T1, T2 values of the human brain quantified by 2D PnP-MRF at 7T MRI. In Proc Int Soc Magn Reson Med 2019, 2810. Montreal
16. McGivney DF, Pierre E, Ma D, Jiang Y, Saybasili H, Gulani V, Griswold MA: SVD compression for magnetic resonance fingerprinting in the time domain. IEEE Trans Med Imaging 2014;33:2311-2322
Figures