0648
Impact of cerebrospinal and blood flow pulsatilities on periventricular white matter in patients with hydrocephalus1Department of Image Processing, University Hospital, Amiens, France, 2CHIMERE EA 7516, Research Team for Head & Neck, University of Picardie Jules Verne, Amiens, France, 3GIE Faire Face, CHU Amiens Picardie, Amiens, France, 4Department of Radiology, University Hospital, Amiens, France, 5Department of Neurosurgery, University Hospital, Amiens, France
Synopsis
The aim of this study was to assess the relationship between neuro-fluids dynamic and microstructure architecture of white matter fibers in hydrocephalus patients. Twenty-eight hydrocephalus patients underwent simultaneously diffusion tensor and phase contrast imaging. A statistical correlation between diffusion and flow parameters has shown a biological causal relationship between abnormal brain neuro-fluids dynamic and white matter alterations in hydrocephalus patients.
Introduction
Hydrocephalus is characterized by cerebral ventricles dilation which impact white matter fibers, cerebral blood and cerebrospinal fluid circulations. This pathology is often associated with form of dementia like other neurodegenerative diseases as Alzheimer. Studies have shown that 5% of Alzheimer patients are misdiagnosed and presented an active hydrocephalus (AH) (1,2). AH patients are easily treatable by CSF shunt placement, it is the unique case of reversible dementia. Actually, mainly based on morphological indexes, neuroradiological diagnosis could improve by taking in account diffusion and phase contrast MRI investigations to define new biomarkers of AH. DTI-MRI and PC-MRI are valuable MRI sequences to respectively detect microstructural alterations of periventricular white matter (PVWM) (3,4,5,6) and hydro and hemodynamic perturbations (7,8,9,10,11) in hydrocephalus patients. Despite the advances in MRI research, the diagnosis of hydrocephalus lacks quantitative image biomarkers that can be used to better understand the physiopathology of hydrocephalus to be able to suggest an appropriate treatment. Our hypothesis is that there is an interaction between the brain tissue microstructure alterations and the cerebral hydro and hemodynamics and this might bring new biomarkers for hydrocephalus.Material and Methods
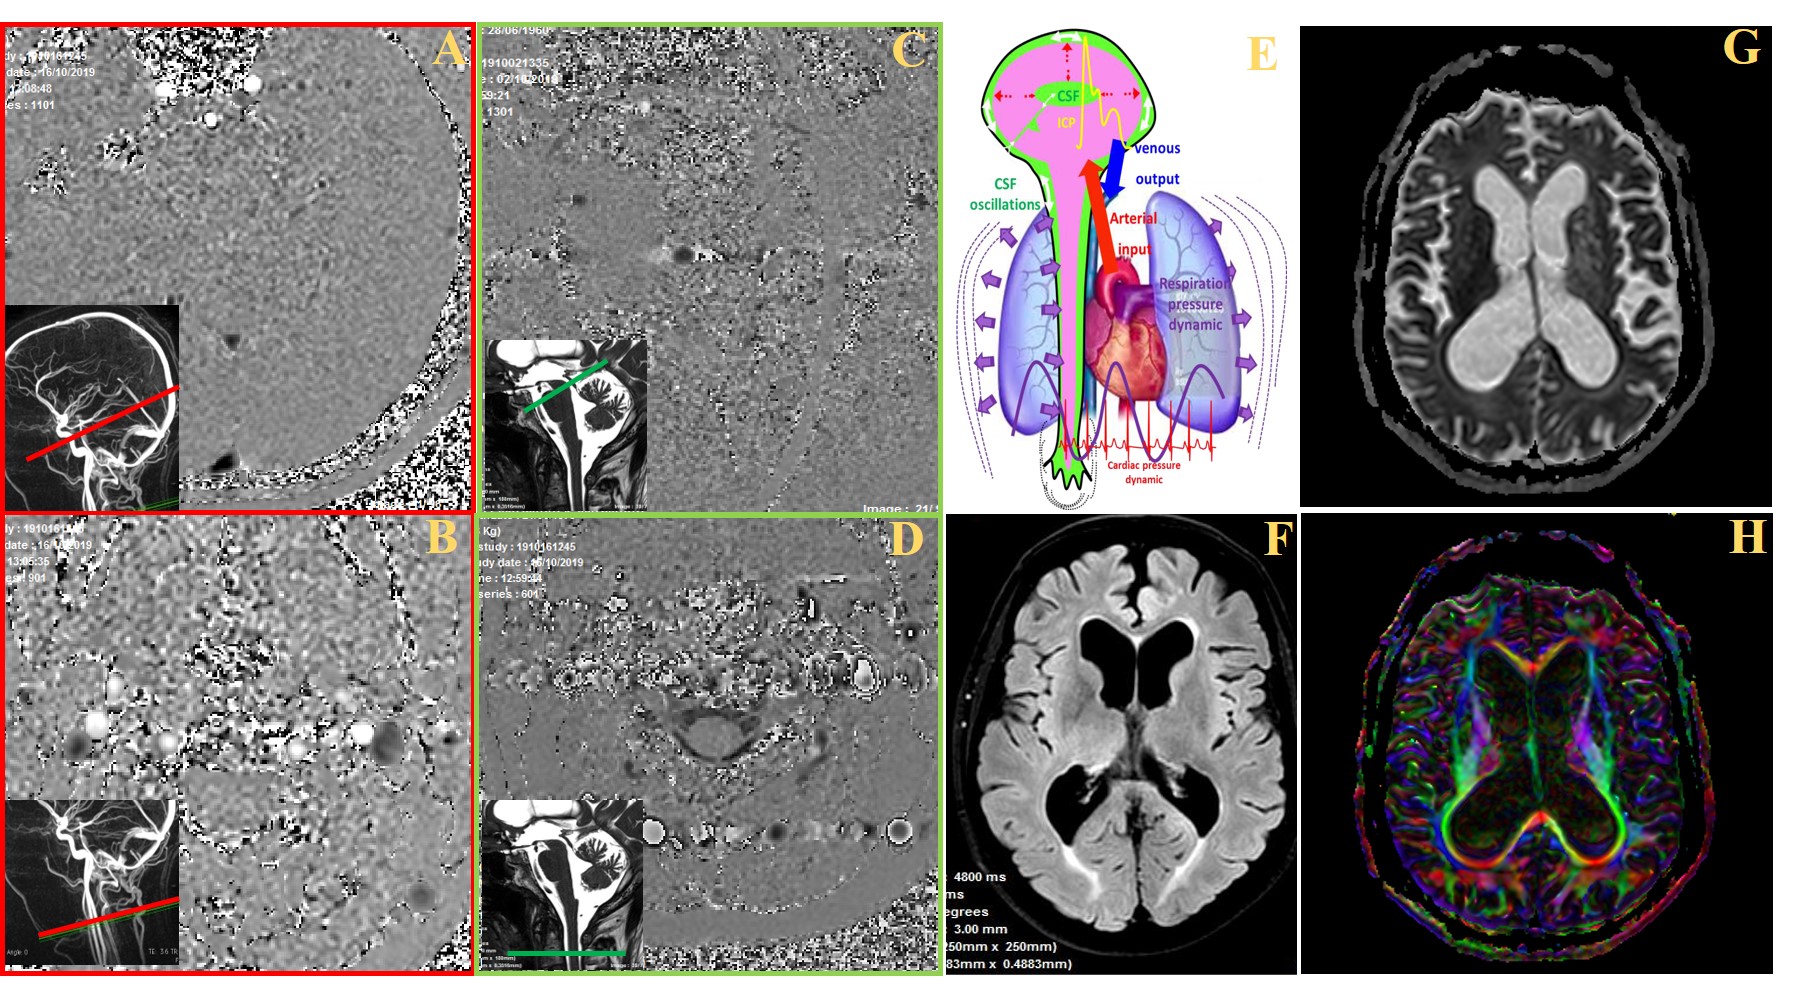
Patients: 28 patients with suspected active hydrocephalus (mean age 72 ± 8 Y) were enrolled. The diagnosis was based on the presence of gait disturbance, cognitive deterioration and/or urinary incontinence and ventricular dilation (Evans index>0.3). MRI sequences: The MRI exam were performed on a 3.0 T scanner. CSF flows were investigated by 2D PC-MRI at the intracranial and the erxtracranial levels (Figure 1) in the aqueduct of Sylvius and the spinal subarachnoid spaces for the CSF and in the internal carotid arteries (ICAs), the internal jugular veins (IJVs), the basilar artery (BA) and the sinuses (sagittal and straight) for the blood. The imaging parameters are: TR and TE=min, FOV: 140 × 140 mm2, thickness: 5 mm, FA: 25° for vascular flows and 20° for CSF flows, spatial resolution: 0.5 mm × 0.5 mm. The Venc was 60 cm/s for vascular flows and 5 cm/s to 30 cm/s for CSF flows. 32 images were reconstructed to represent a mean cardiac cycle (cc). Total acquisition time was 8 min. DTI-MRI was performed with 6 diffusion directions and 2 repetitions, b = 1000 (s/mm2), SENSE=2, 45 slices, 2 mm thickness. Isotropic voxel at the acquisition (2x2x2 mm3) reconstructed in 1x1x1 mm3. The FOV was 220x220 mm2, and the acquisition time was 5 min. Images analysis: For PC-MRI, dedicated software (12) was used to segment and calculate CSF and BF curves along cardiac cycle in all vessels and ROI. Then, aqueductal and spinal CSF stroke volumes (SV) were calculated. The total intracranial arterial CBF (IntraACBF) was calculated by adding both the (ICAs) and BA flows. The total intracranial venous CBF (IntraVCBF) was calculated by adding the sinuses flows. Since, our measure does not take in account the flow in the peripheral veins and considering that ACBF must be equal to VCBF, the IntraVCBF was corrected by αIntra factor (ratio of IntraACBF/IntraVCBF). For DTI-MRI, manual delineation was performed on the following structures: genu, rostral body, body, isthmus and splenium of the corpus callosum (CC), anterior limb of internal capsule (ALIC), posterior limb of internal capsule (PLIC) and corona radiata (CR). For ALIC, PLIC and CR, ROI were performed bilaterally. Parallel (E1) and perpendicular (E23) diffusions, ADC and FA were calculated in all the delineated structures. Statistical analysis: Spearman correlation was used to correlate flow and DTI parameters.Results
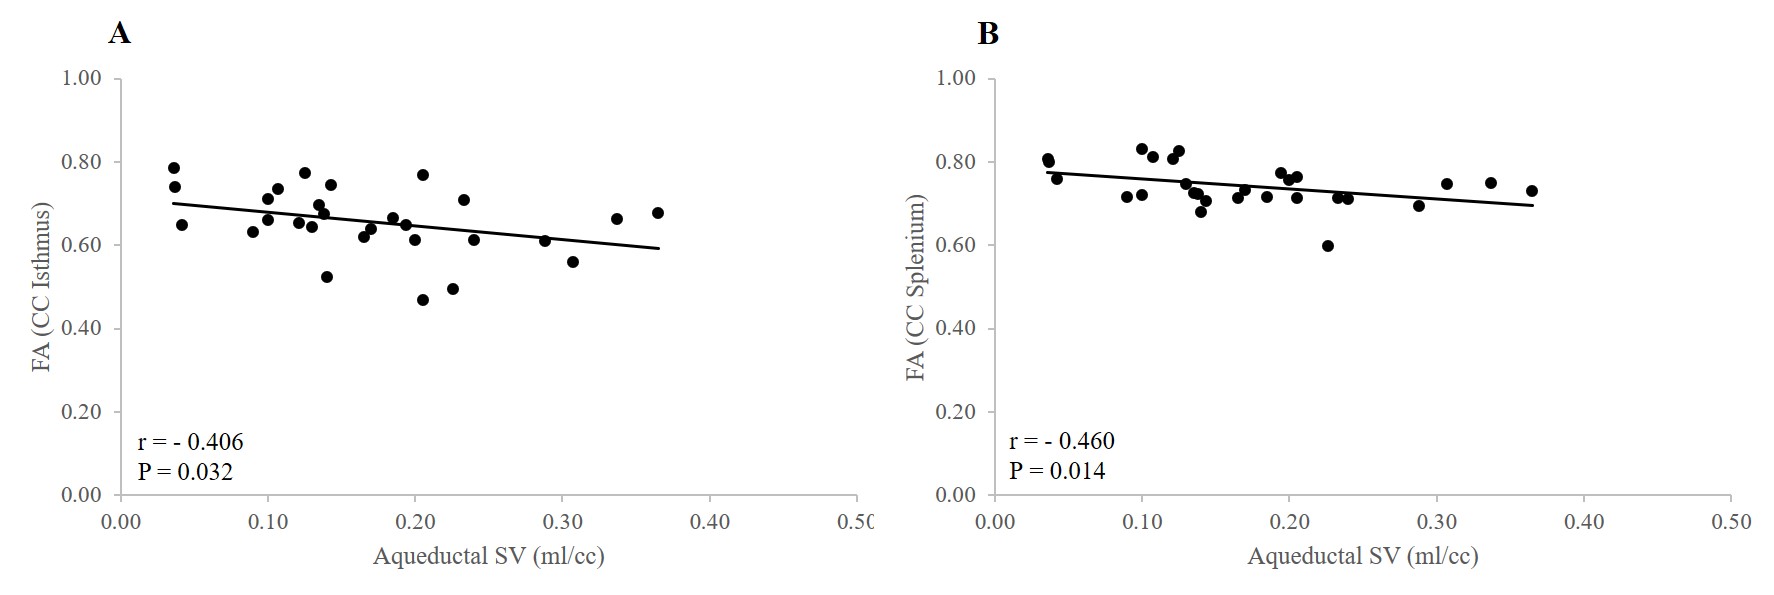
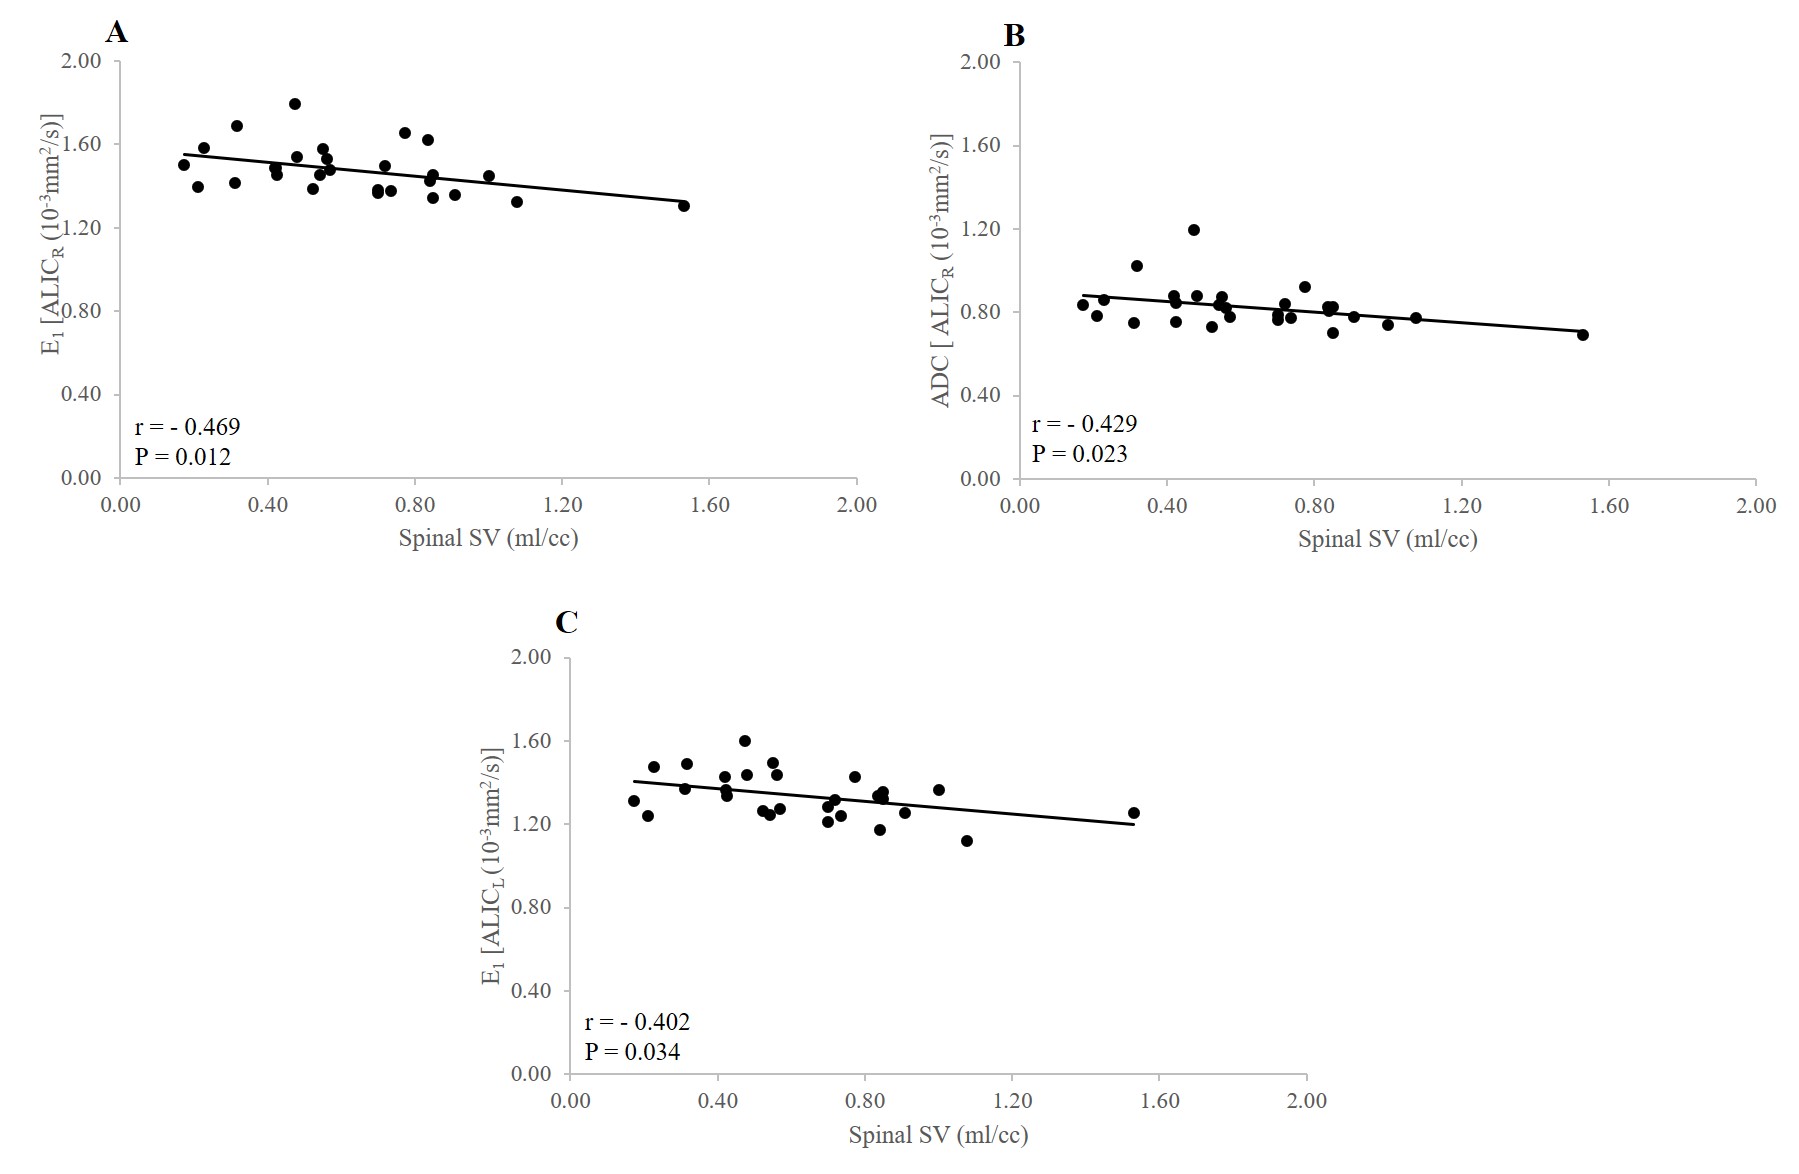
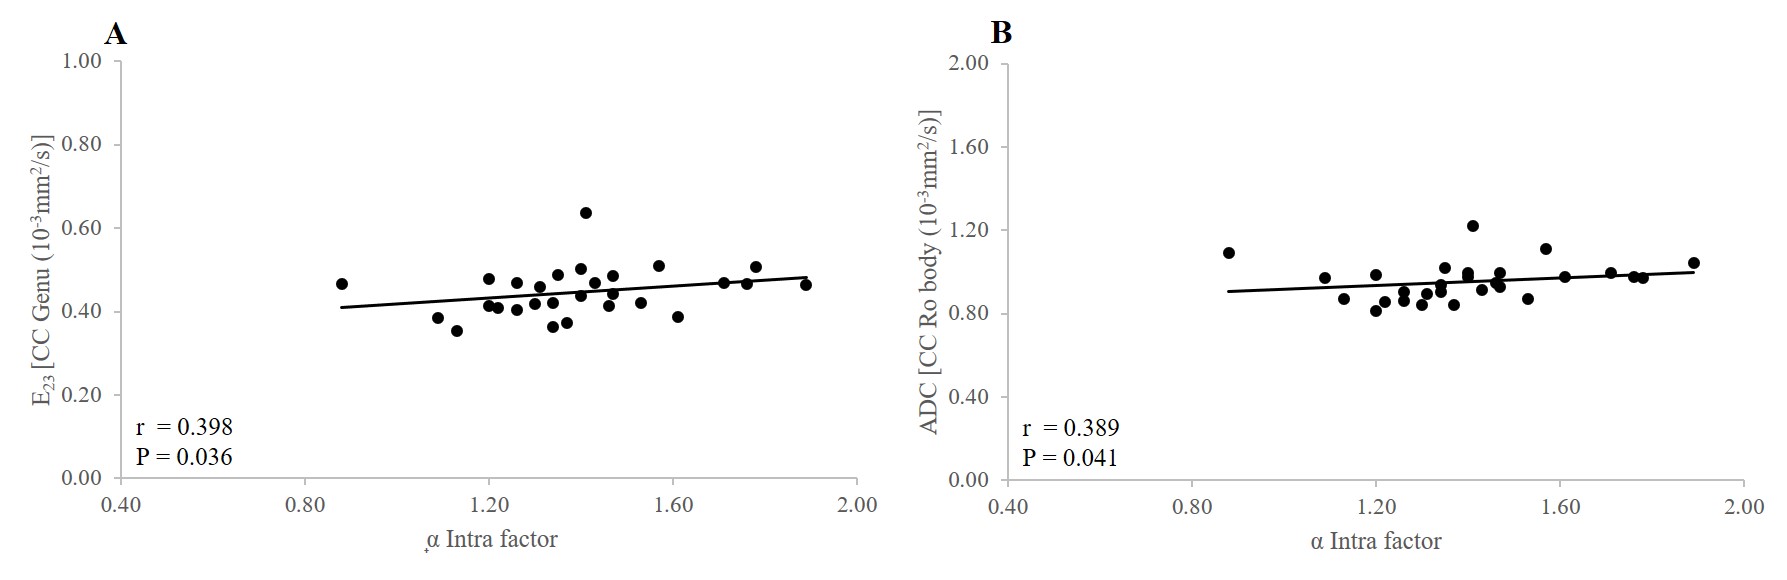
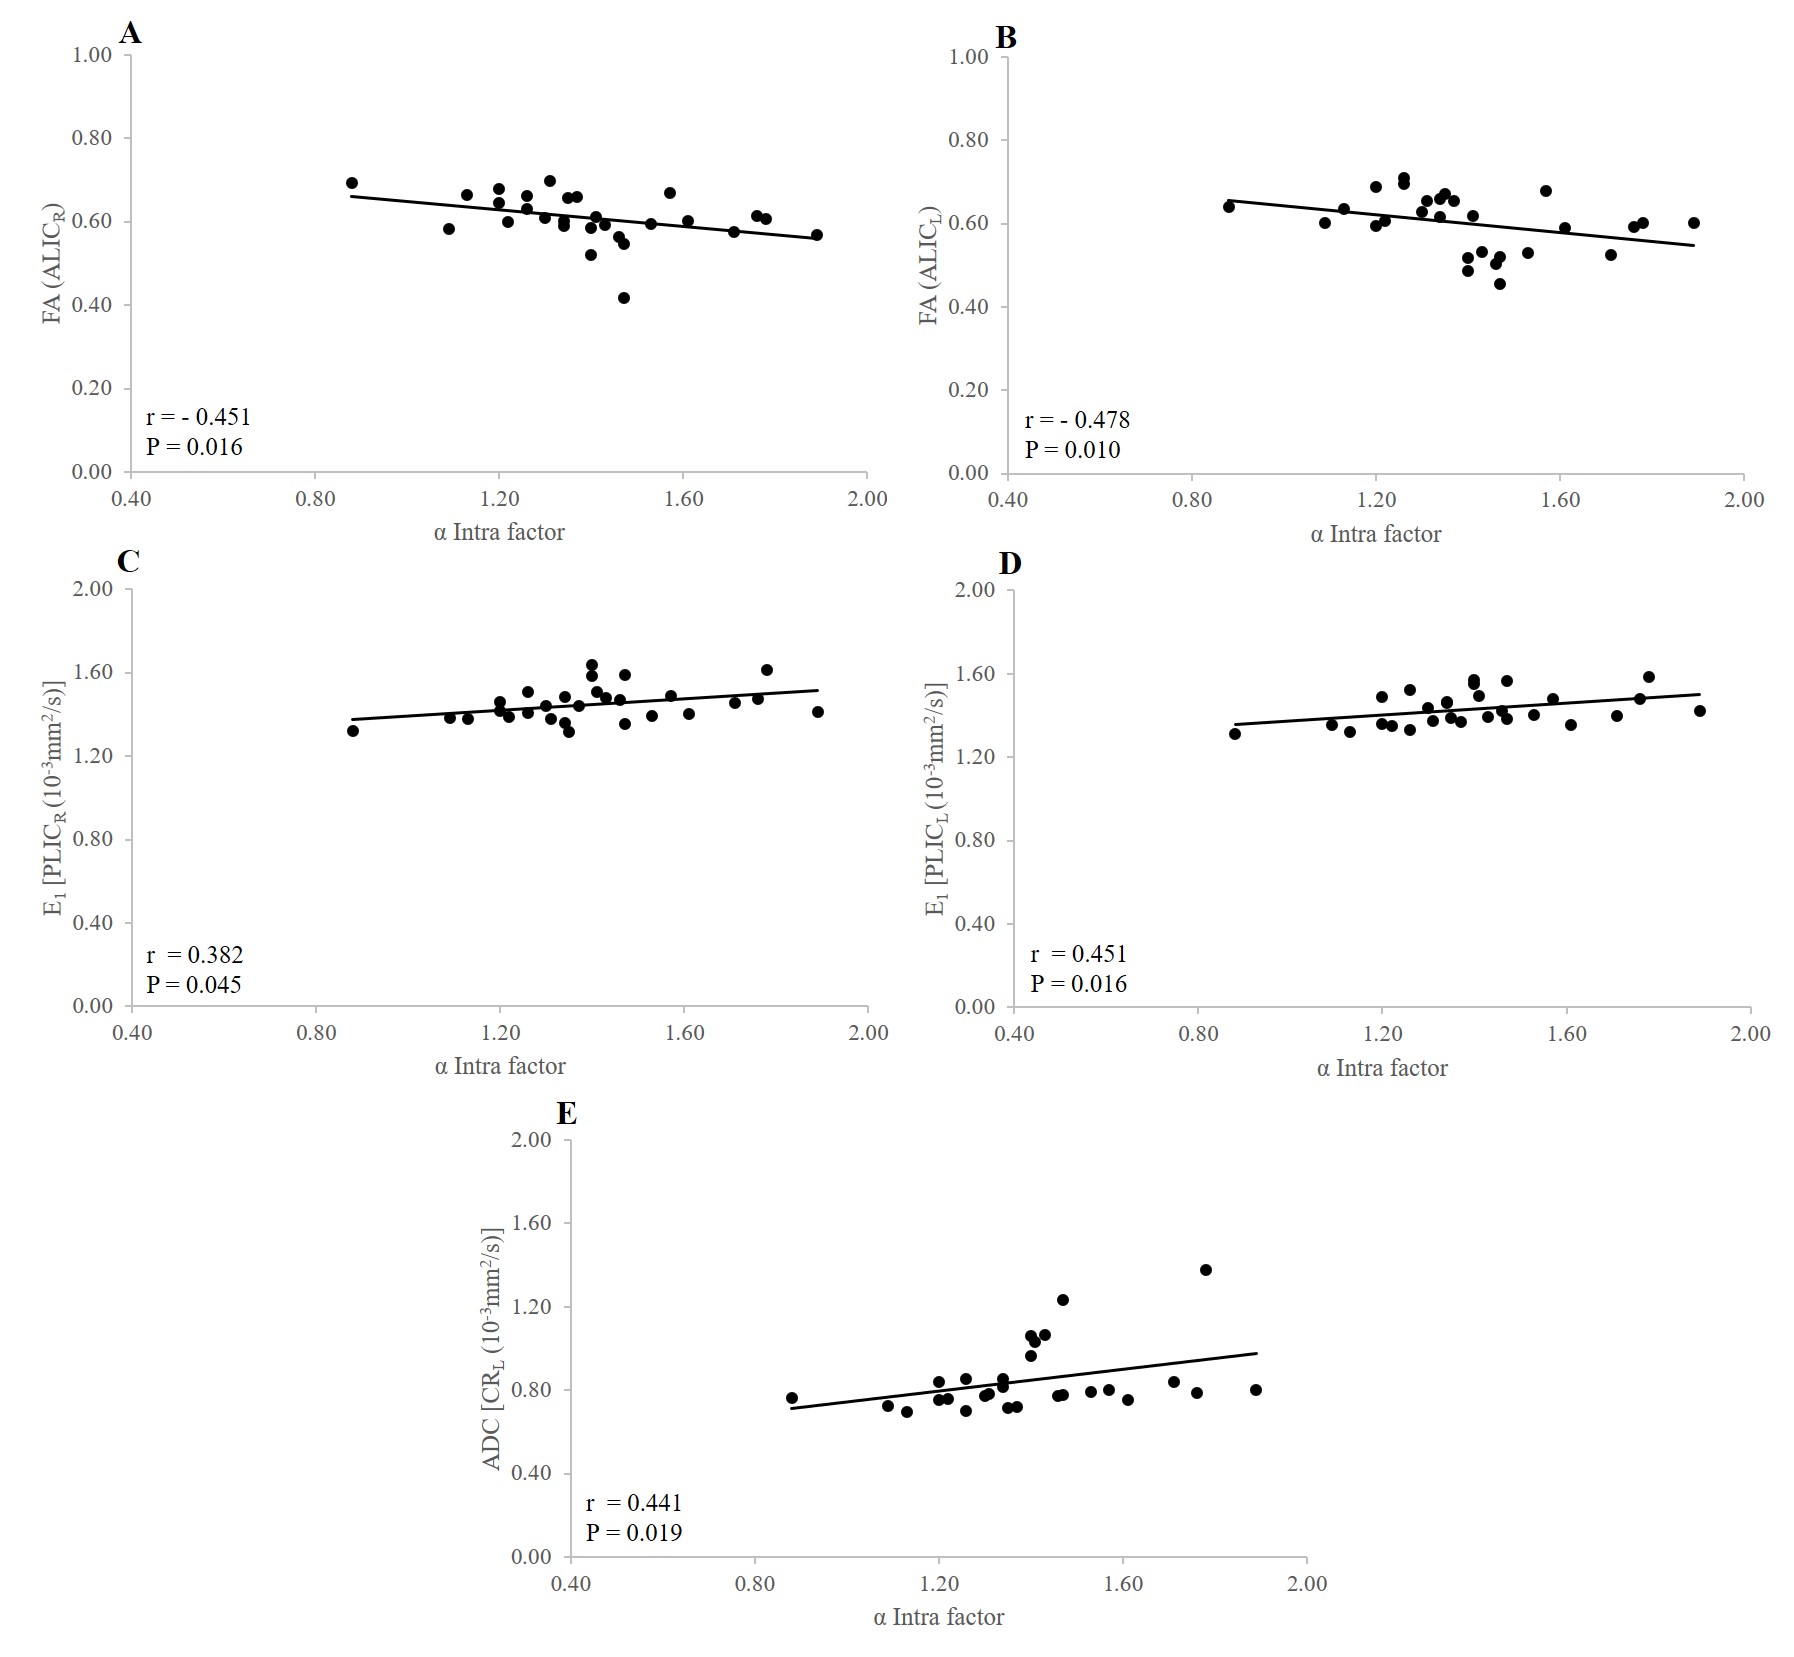
Negative significant correlations were observed between FA of Isthmus and Splenium of the CC and aqueductal SV (r = -0.406, p = 0.032; r = -0.460, p = 0.014, respectively) (Figure 2). Negatif significant relationships were found between E1ALICR, ADC ALICR, E1ALICL and spinal SV (r = -0.469, p= 0.012; r = -0.429, p = 0.023; r = -0.402, p = 0.034, respectively) (Figure 3). Positive significant relationship were observed between E23 CC genu, ADC CC rostral body and α Intra factor (r = 0.398, p = 0.036; r = 0.389, p = 0.041, respectively) (Figure 4). Negative significant correlation was found between FA ALICR, FA ALICL and α Intra factor (r = -0.451, p = 0.016; r = -0.478 , p = 0.010, respectively) (Figure 5). Positive correlation was found between E1PLICR, E1PLICL, ADC CRL and α Intra factor (r = 0.382, p = 0.045; r = 0.451, p = 0.016; r = 0.441, p = 0.019, respectively) (Figure 5).Discussion
Our results suggest that higher aqueductal and spinal CSF SV may cause damage to axonal membrane, de/dysmyelination or reduced amount of intra-axonal structures in CC and ALIC. In addition, the increase in α Intra factor is associated with the increase in DTI indices in CC, ALIC, PLIC and CR suggesting that some hemodynamic alterations may be in part responsible in changes of PVWM in hydrocephalus patients.Conclusion
CSF SV and αIntra factor may be used as good predictors for changes in microstructure of PVWM in hydrocephalus patients. Disturbance in the pulsatility of CSF and CBF associated with alteration in the misrostructure of PVWM could be good biomarkers to evaluate the impact of active hydrocephalus on the brain.Acknowledgements
No acknowledgement found.References
1- Gallia GL, Rigamonti D, Williams MA. The diagnosis and treatment of idiopathic normal pressure hydrocephalus. Nat Clin Pract Neurol. 2006;2(7):375-381.
2- Di Ieva A, Valli M, Cusimano MD. Distinguishing Alzheimer's disease from normal pressure hydrocephalus: a search for MRI biomarkers. J Alzheimers Dis. 2014;38(2):331-350.
3- Le Bihan D, Breton E, Lallemand D, et al. MR imaging of intravoxel incoherent motions: application to diffusion and perfusion in neurologic disorders. Radiology. 1986;161(2):401-407.
4- Kamiya K, Hori M, Irie R, et al. Diffusion imaging of reversible and irreversible microstructural changes within the corticospinal tract in idiopathic normal pressure hydrocephalus. Neuroimage Clin. 2017;14:663-671.
5- Keong NC, Pena A, Price SJ, et al. Diffusion tensor imaging profiles reveal specific neural tract distortion in normal pressure hydrocephalus. PLoS One 2017;12(8):e0181624
6- Lock C, Kwok J, Kumar S, et al. DTI Profiles for Rapid Description of Cohorts at the Clinical-Research Interface. Front Med (Lausanne) 2019;10,5:357.
7- Feinberg DA, Mark AS. Human brain motion and cerebrospinal fluid circulation demonstrated with MR velocity imaging. Radiology. 1987;163(3):793-799.
8- El Sankari S, Gondry-Jouet C, Fichten A et al. Cerebrospinal fluid and blood flow in mild cognitive impairment and Alzheimer's disease: a differential diagnosis from idiopathic normal pressure hydrocephalus. Fluids Barriers CNS. 2011;8(1):12.
9- Lindstrøm EK, Ringstad G, Mardal KA et al. Cerebrospinal fluid volumetric net flow rate and direction in idiopathic normal pressure hydrocephalus. Neuroimage Clin. 2018;20:731-741.
10- Gokul UR, Ramakrishnan KG. Change in average peak cerebrospinal fluid velocity at the cerebral aqueduct, before and after lumbar CSF tapping by the use of phase contrast MRI, and its effect on gait improvement in patients with normal pressure hydrocephalus. Neurol India. 2018;66(5):1407-1412.
11- Hamilton RB, Scalzo F, Baldwin K et al. Opposing CSF hydrodynamic trends found in the cerebral aqueduct and prepontine cistern following shunt treatment in patients with normal pressure hydrocephalus. Fluids Barriers CNS. 2019;16(1):2.
12- Balédent O, Henry-Feugeas M C, Idy-Peretti I. Cerebrospinal Fluid Dynamics and Relation with Blood Flow: A Magnetic Resonance Study with Semiautomated Cerebrospinal Fluid Segmentation. Invest Radiol. 2001;36(7):368–377.
Figures