0646
Blood flow in the internal carotid arteries is correlated with CSF outflow from the ventricular system1National 7T facility, LBIC, Lund University, Lund, Sweden, 2Department of Experimental Medical Science, Lund University, Lund, Sweden, 3Wallenberg Centre for Molecular Medicine, Lund University, Lund, Sweden, 4Department of Clinical Sciences, Lund University, Lund, Sweden
Synopsis
Little is known about which physiological parameters regulate CSF production. In this work, we tested the hypothesis that cerebral blood flow and heart rate play roles in CSF regulation. We used 7T MR to quantify CSF flow in the cerebral aqueduct and blood flow in the carotid arteries of healthy volunteers. We found that CSF outflow from the ventricular system correlated with blood flow in the internal carotid arteries, whereas there was no significant effect of heart rate on CSF outflow. This suggests that cerebral blood flow affects CSF flow and production.
Introduction
Cerebrospinal fluid (CSF) is continuously produced within the brain where it is circulated through the brain parenchyma along perivascular pathways, known as the glia-lymphatic (glymphatic) system1. A by-product of neuronal activity, amyloid-β (Aβ) accumulates in the brain during Alzheimer’s disease (AD), and is found in the CSF decades before onset of clinical symptoms. One path for Aβ removal is drainage with the CSF, and CSF dynamics are therefore of interest in relation to Alzheimer’s disease. However, little is known about which physiological parameters regulate CSF production. In this work, we tested the hypothesis that cerebral blood flow and heart rate influence CSF production. Specifically, the aim was to quantify the association between cerebral blood flow and heart rate to CSF production in healthy volunteers.Methods
Healthy volunteers (N=10, 6 female, median age 23 years, age range 21-31 years) underwent a 7T MRI examination. All subjects provided written informed consent. All examinations were done in the afternoon to minimize known effects of circadian rhythm2. We used phase contrast MR (PC MR) at 7T to quantify CSF flow in the cerebral aqueduct and blood flow in the internal carotid arteries (ICA) and vertebral arteries (VA) of healthy volunteers. The aqueduct CSF outflow was taken as proxy for CSF production in the ventricular system.he positioning of the flow measurements is shown in Figure 1. The protocol consisted of three 2D phase contrast measurements adapted to CSF flow3 and arterial blood flow, respectively. The main differences between them were the in-plane spatial resolution (0.3 mm for the aqueduct and 0.5 mm for the blood flow) and the velocity encoding sensitivity (venc) which was 15 cm/s for CSF flow and 100 cm/s for blood flow. The number of heart phases were adjusted for each individual to the best temporal resolution possible given the heart rate, while keeping other parameters constant. The phase contrast scans were cardiac triggered using ECG. If the ECG signal was unreliable, the scanners peripheral pulse oximetry unit (PPU) was used for triggering. The triggering device also provided the heart rate.
The flow measurements were evaluated in Segment4,5. After linear phase background correction, the vessels were delineated and flow and velocity parameters calculated. Linear regression was performed to investigate the relationship between CSF net flow and VA, ICA and total blood flow, and heart rate. The VA and ICA flow volumes are the sum of left and right arteries, respectively. The total blood flow is the sum of all VA and ICA.
Results
All subjects completed the examination, and no data was excluded from the analysis. The ECG triggering was successful in 60% of the flow measurements. The mean net CSF flow was 0.28±0.047 ml/min, directed caudally.Figure 2 shows the results of linear regression analysis of CSF net volume to VA flow volume, ICA flow volume, total blood flow volume and heart rate. The correlation between CSF net volume and ICA net volume was found to be statistically significant (p<0.02).
Discussion
This study shows that CSF flow is correlated with internal carotid artery (ICA) flow, but not vertebral artery (VA) flow, total arterial blood flow or heart rate. As arterial blood enters the brain during the systolic heart phase, the increased brain blood volume drives CSF out of the ventricular system. During diastole, the reduction in brain volume causes CSF to oscillate back into the ventricular system. The net flow volume shows a transport of CSF out of the ventricular system, and is here used as a measure of CSF production in the ventricles. It has been hypothesized that CSF production outside the choroid plexus in certain pathological conditions can cause a net inflow into the ventricles not seen in healthy subjects6. The mean CSF net flow in the aqueduct found in this work is in agreement with previous studies in healthy, young subjects3,7.This study includes a small number of subjects, and findings has to be verified in a larger cohort. To elucidate which physiological parameters that drive CSF flow and production, future work will use interventions to increase blood flow.
It is known that CSF flow in the aqueduct is also affected by respiration8, but this aspect of the dynamics was not investigated in this work.
Conclusion
This study found that CSF outflow from the ventricular system correlates with blood flow in the internal carotid arteries, whereas there was no significant effect of heart rate CSF flow. This could indicate that cerebral blood flow is one regulating mechanism of CSF flow and production.Acknowledgements
This work was supported by the Torsten Söderberg Foundation and the Knut and Alice Wallenberg Foundation.
The National 7T facility at Lund University Bioimaging Center is gratefully acknowledged for providing experimental resources.
References
1. J. J. Iliff, M. Wang, Y. Liao, et al., A paravascular pathway facilitates CSF flow through the brain parenchyma and the clearance of interstitial solutes, including amyloid beta, Science Transl. Med:4, (2012)
2. C. Nilsson, F. Stahlberg, C. Thomsen, et al., Circadian variation in human cerebrospinal fluid production measured by magnetic-resonance imaging, American Journal of Physiology:262, p.R20 (1992)
3. K. Markenroth Bloch, J. Töger, F. Ståhlberg, Investigation of cerebrospinal fluid flow in the cerebral aqueduct using high-resolution phase contrast measurements at 7T MRI, Acta Rad:59, p.988 (2018)
4. E. Heiberg, J. Sjogren, M. Ugander, et al., Design and validation of segment--freely available software for cardiovascular image analysis, BMC Med Imaging:10, p.1 (2010)
5. http://segment.heiberg.se
6. E. K. Lindstrom, G. Ringstad, K. A. Mardal, et al., Cerebrospinal fluid volumetric net flow rate and direction in idiopathic normal pressure hydrocephalus, Neuroimage-Clinical:20, p.731 (2018)
7. A. Wahlin, K. Ambarki, J. Hauksson, et al., Phase contrast MRI quantification of pulsatile volumes of brain arteries, veins, and cerebrospinal fluids compartments: Repeatability and physiological interactions, J Magn Reson Imaging:35, p.1055 (2012)
8. J. M. Spijkerman, L. J. Geurts, J. C. W. Siero, et al., Phase contrast MRI measurements of net cerebrospinal fluid flow through the cerebral aqueduct are confounded by respiration, J Magn Reson Imaging:49, p.433 (2019)
Figures
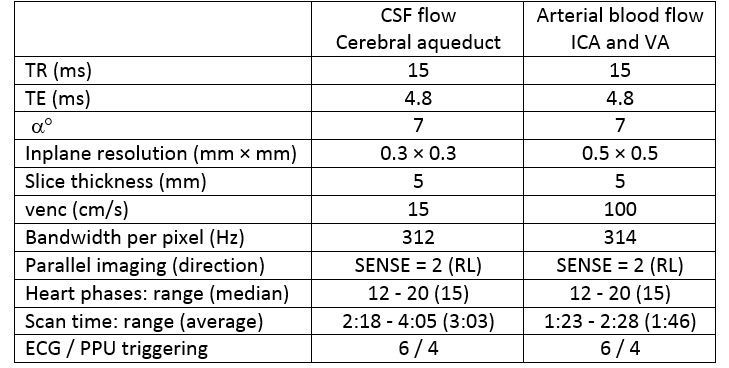
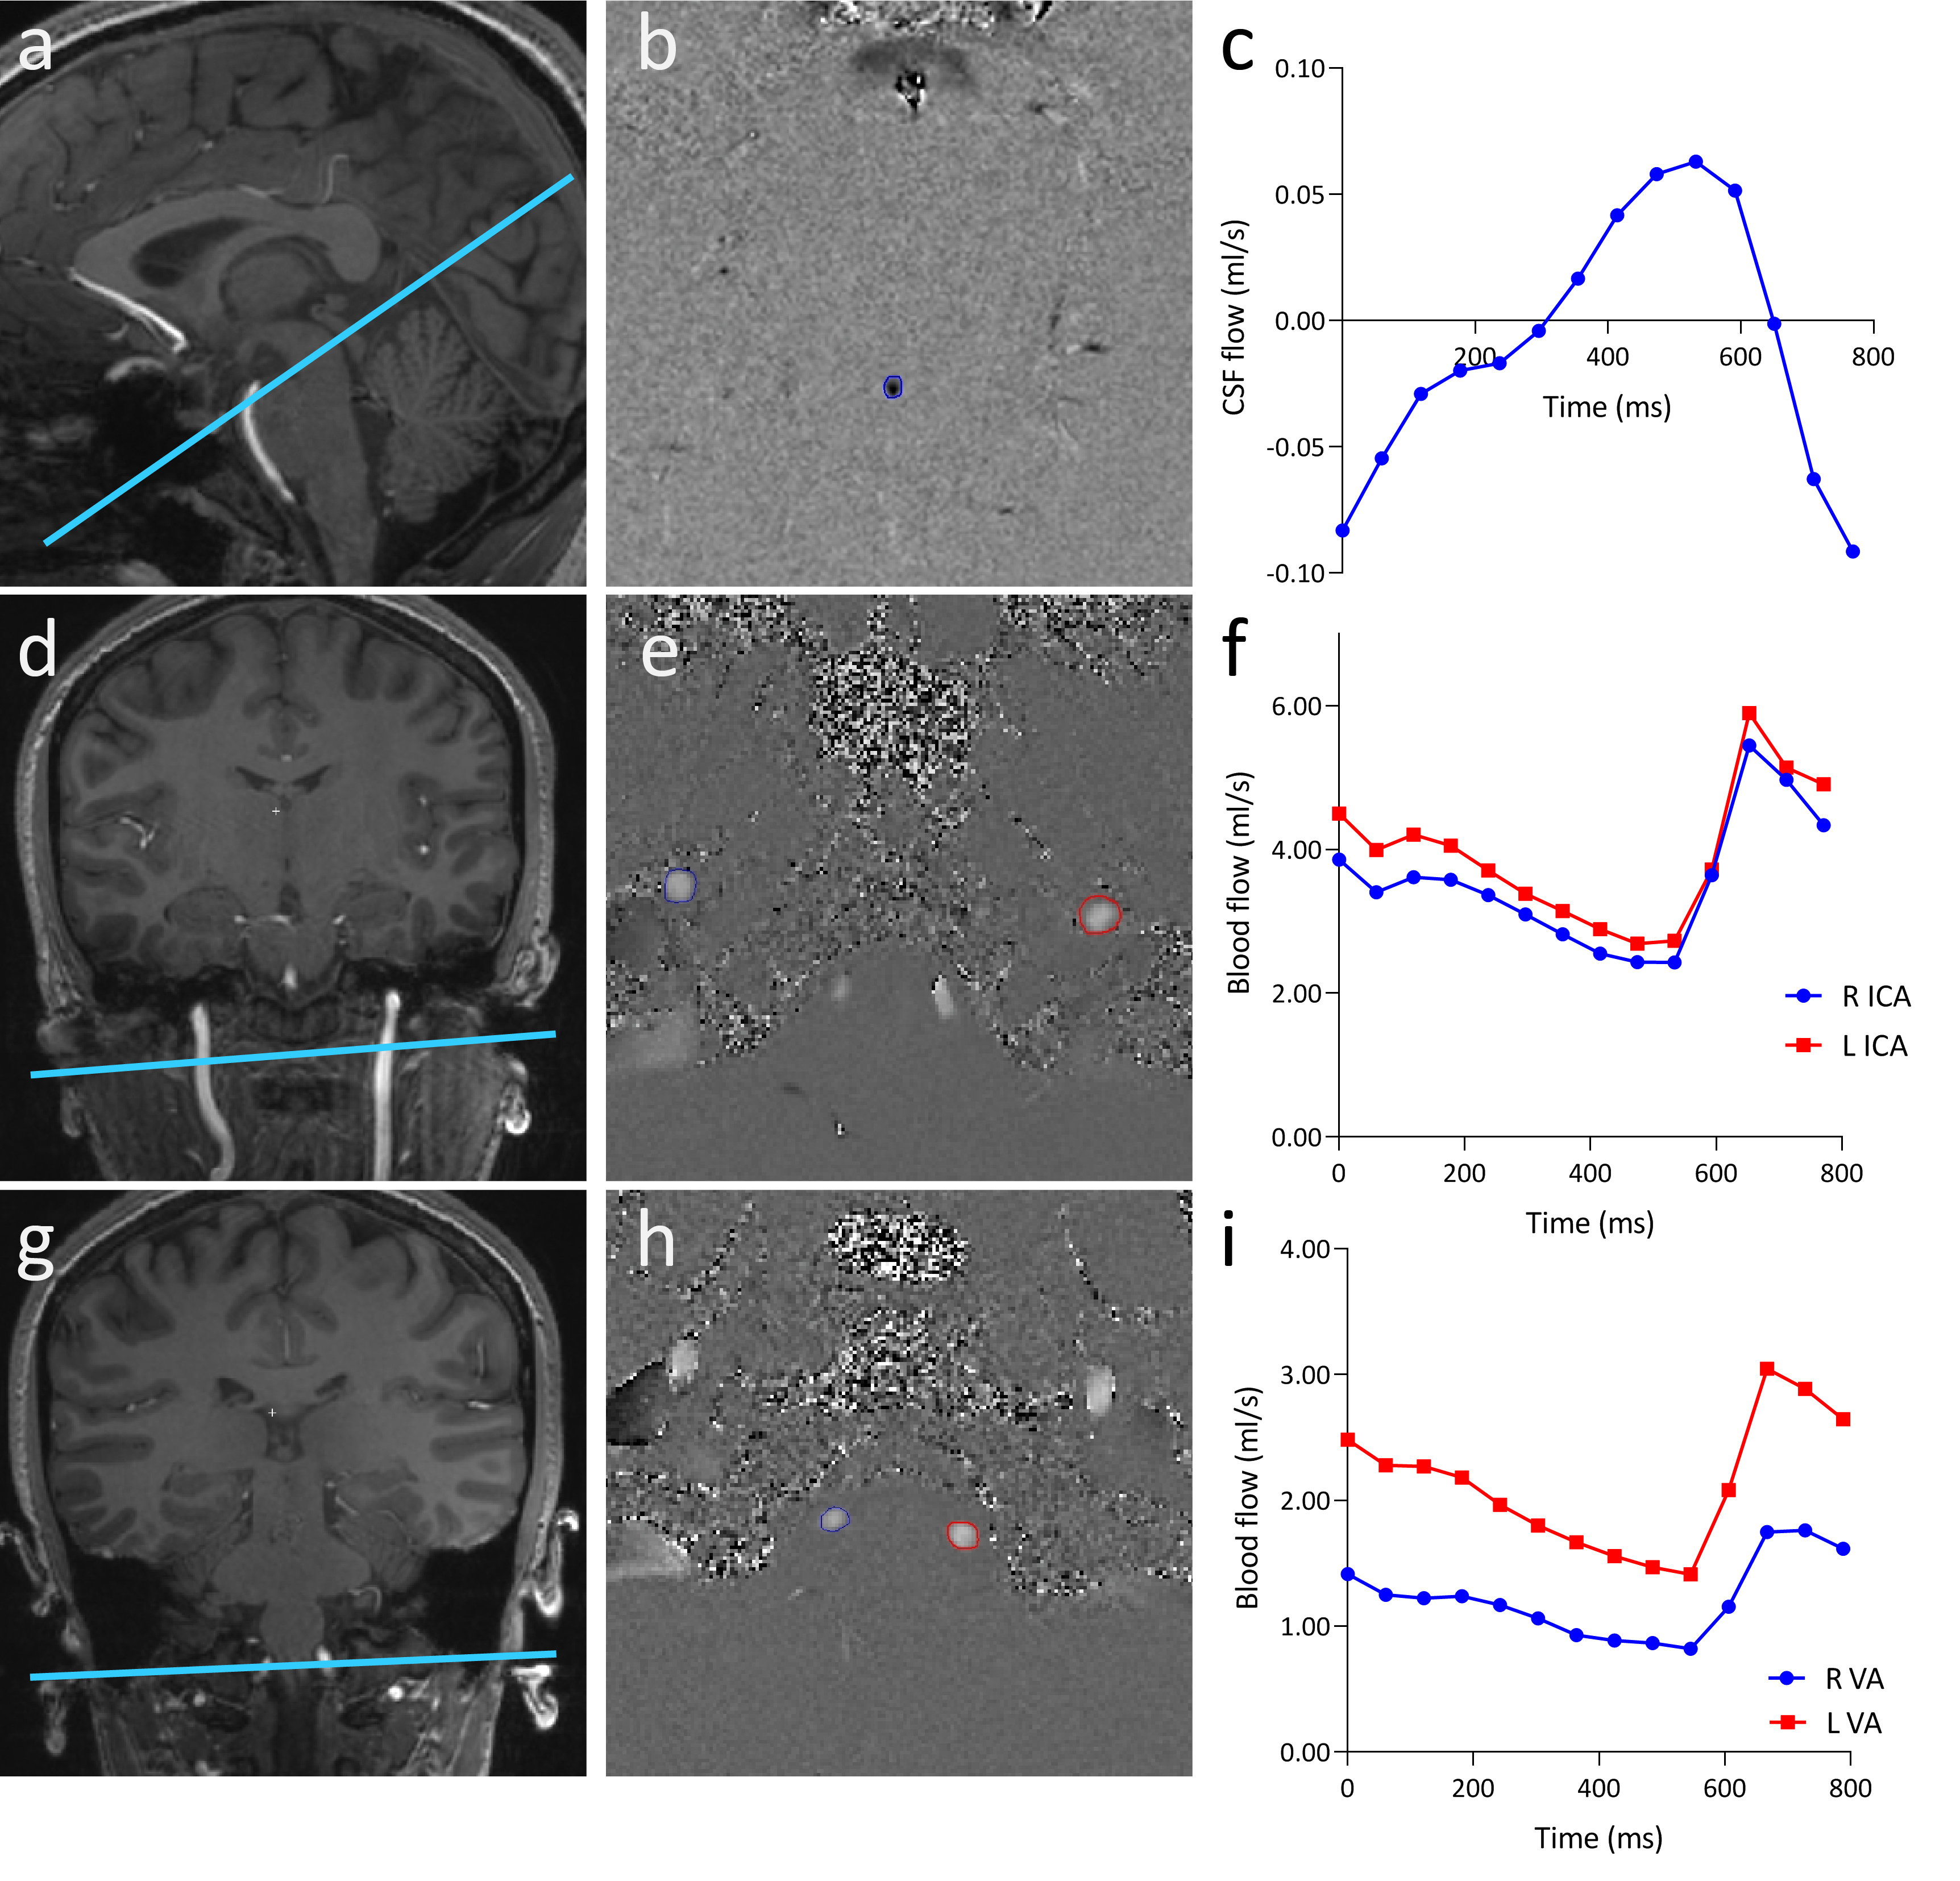
Fig. 1. Overview of slice positioning, phase contrast images and flow curves.
(a) Positioning of the CSF flow measurement with (b) the corresponding CSF velocity map with the aqueduct delineated and (c) the resulting CSF flow curve.
(d) Positioning of the ICA blood flow measurement with (e) the corresponding velocity map with the right and left ICA delineated and (f) the resulting flow curves.
(g) Positioning of the VA blood flow
measurement with (h) the corresponding velocity map with the right and
left IVA delineated and (i) the resulting flow curves.
