0640
Estimation of brown adipose tissue perfusion by DCE-MRI improves measurement of oxidative metabolism by 11C-acetate PET in a rat model1Université de Sherbrooke, Sherbrooke, QC, Canada
Synopsis
Brown adipose tissue (BAT) oxidative metabolism can be measured by 11C-acetate PET with a 3-tissue pharmacokinetic model. However, this model can have trouble distinguishing between increased oxidation and increased blood volume, both of which occur in active BAT. A sequential DCE-MRI and 11C-acetate PET protocol was performed in male Wistar rats with and without BAT activation. DCE-MRI perfusion measures were comparable to those obtained previously with 68Ga-DOTA PET. Incorporating the DCE-MRI blood volume information into the 11C-acetate model revealed higher oxidation in activated BAT than indicated by the unconstrained model.
INTRODUCTION
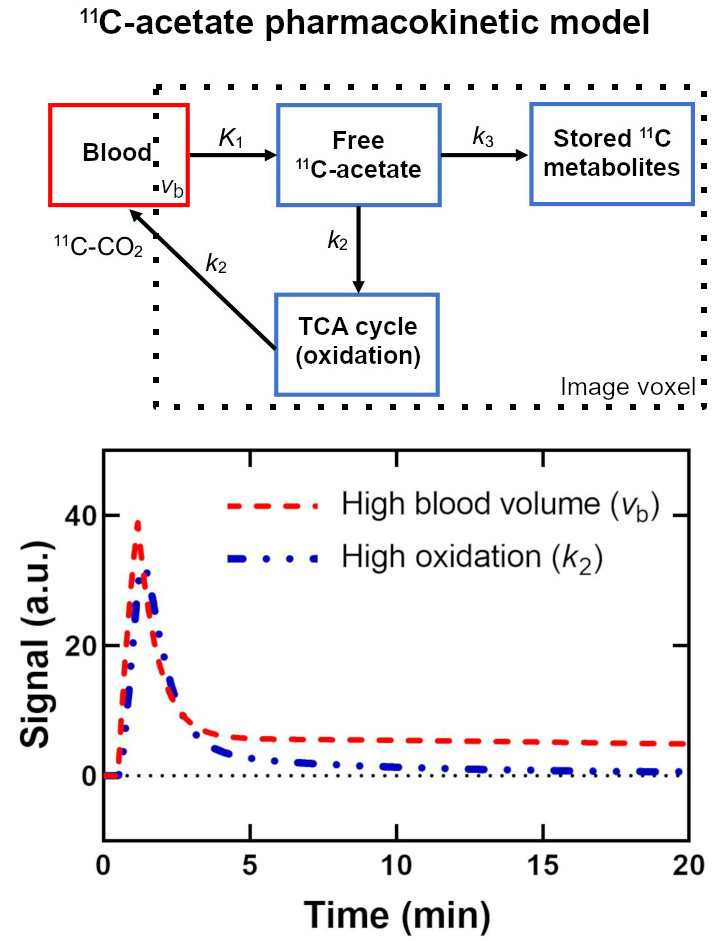
The PET radiotracer 11C-acetate assesses oxidative metabolism which is directly linked to thermogenesis, rather than ATP production, in brown adipose tissue (BAT)1. This measure of thermogenesis is essential to characterize anti-obesity drugs aimed at increasing energy expenditure through BAT.11C-acetate is metabolized quickly after injection (first ~5 minutes)2. Therefore, oxidation and perfusion (first-pass bolus) signals are intermingled (Fig. 1). Moreover, BAT activation increases both blood volume and oxidation making it impossible to measure the change in oxidation with a pharmacokinetic model without prior information about blood volume3.
This work measures perfusion with gadobutrol DCE-MRI in active and inactive BAT. The 11C-acetate pharmacokinetic model is then constrained using these data. Finally, the perfusion measure is validated against 68Ga-DOTA PET4,5 to account for differences between MRI and PET (e.g. methods to calculate imaging probe concentration in a tissue).
METHODS
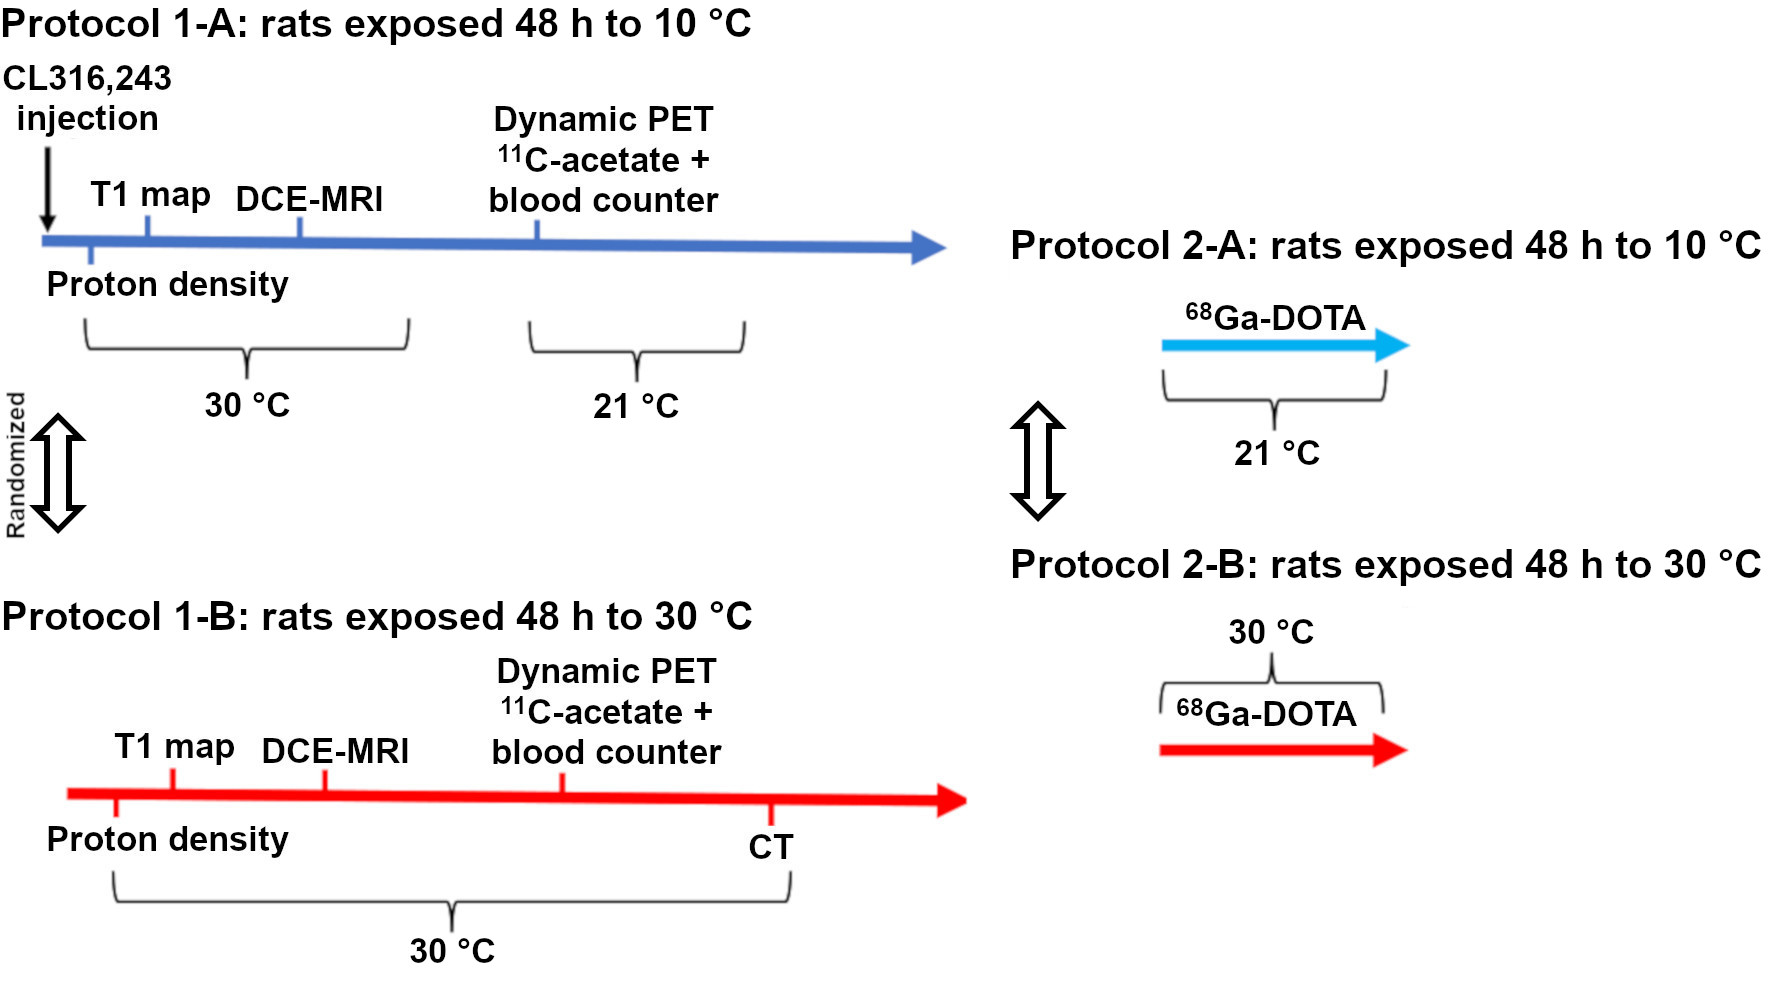
The experimental protocol is summarized on Figure 2. Briefly, 6-week old male Wistar rats (N = 10) underwent sequential DCE-MRI (7 T Varian) and 11C-acetate PET/CT (LabPET-8) twice, once after BAT activation (48 h at 10 °C and injection of β3-agonist) and once after inhibition (48 h at 30 °C and continuous heating on scanners). The MRI-PET sessions were separated by 3 weeks (n = 6 animals started with BAT activation, n = 4 started with inhibition). An additional group of 4 rats were scanned in a PET only protocol with perfusion measured by 68Ga-DOTA. Animals where anesthetized with isoflurane (1.5 %).Concentration maps were generated for DCE-MRI using the T1 map and post-contrast images (17 s time resolution). PET images were reconstructed using 3D maximum likelihood estimation method and the following time resolution: 1x30 s, 12x10 s, 8x30 s, 10x1 min, and 1x4 min.
Regions of interest were drawn by hand on the interscapular BAT depot based on the pre-contrast images for DCE-MRI or sum image of all PET frames and anatomical CT. Pharmacokinetic modeling using appropriate compartment models (1‑tissue for gadobutrol6 and 68Ga-DOTA5; 3-tissue for 11C-acetate3) was performed in MATLAB. The arterial input function was derived using a region of reference for MRI7, and blood counter data (Gamma Medica-Ideas) for PET.
Finally, Pearson correlations of pharmacokinetic parameters for gadobutrol/68Ga-DOTA vs. 11C-acetate were examined. The effect of BAT activation on parameters was assessed by paired t-test with significance level set at p ≤ 0.05.
RESULTS
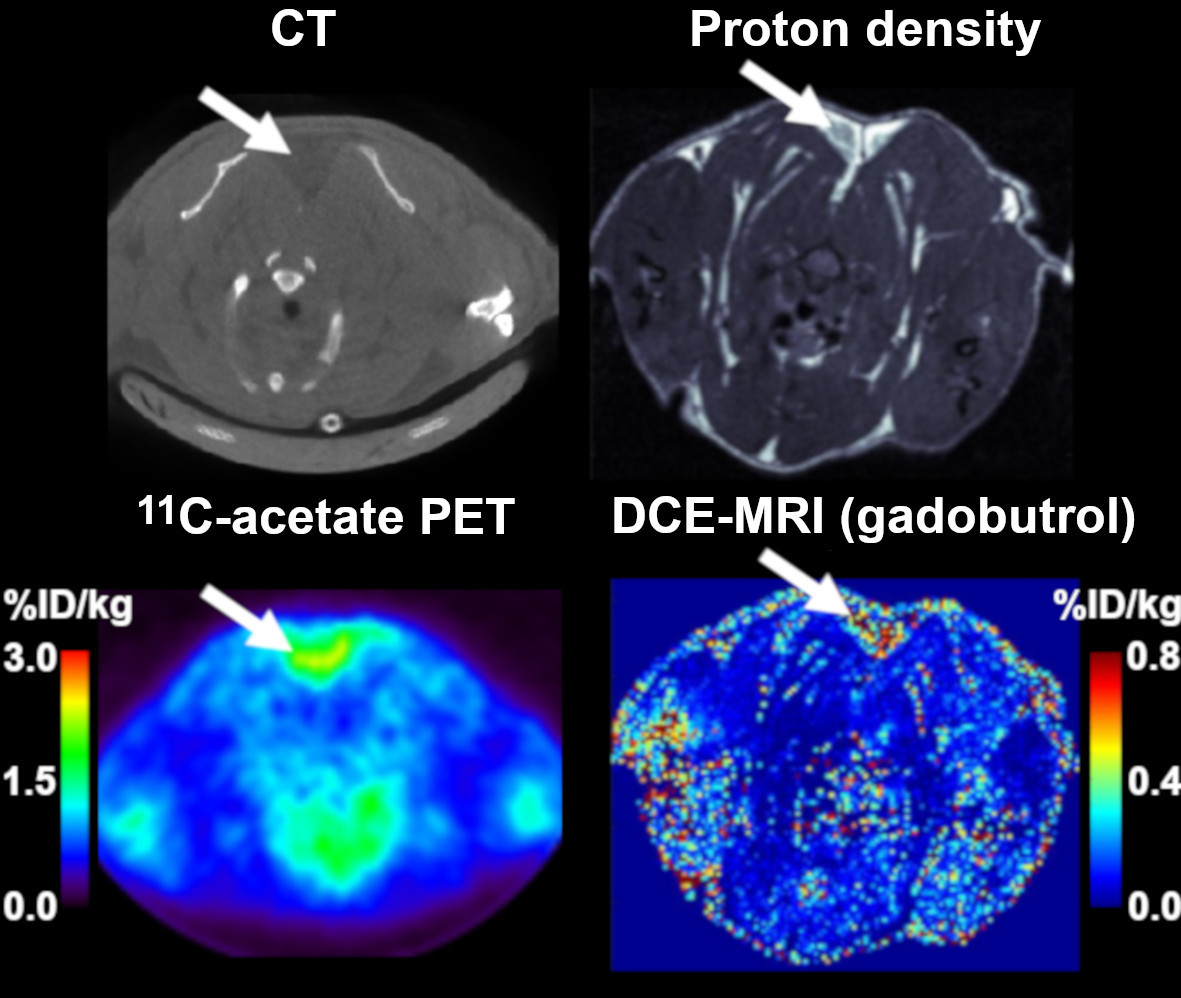
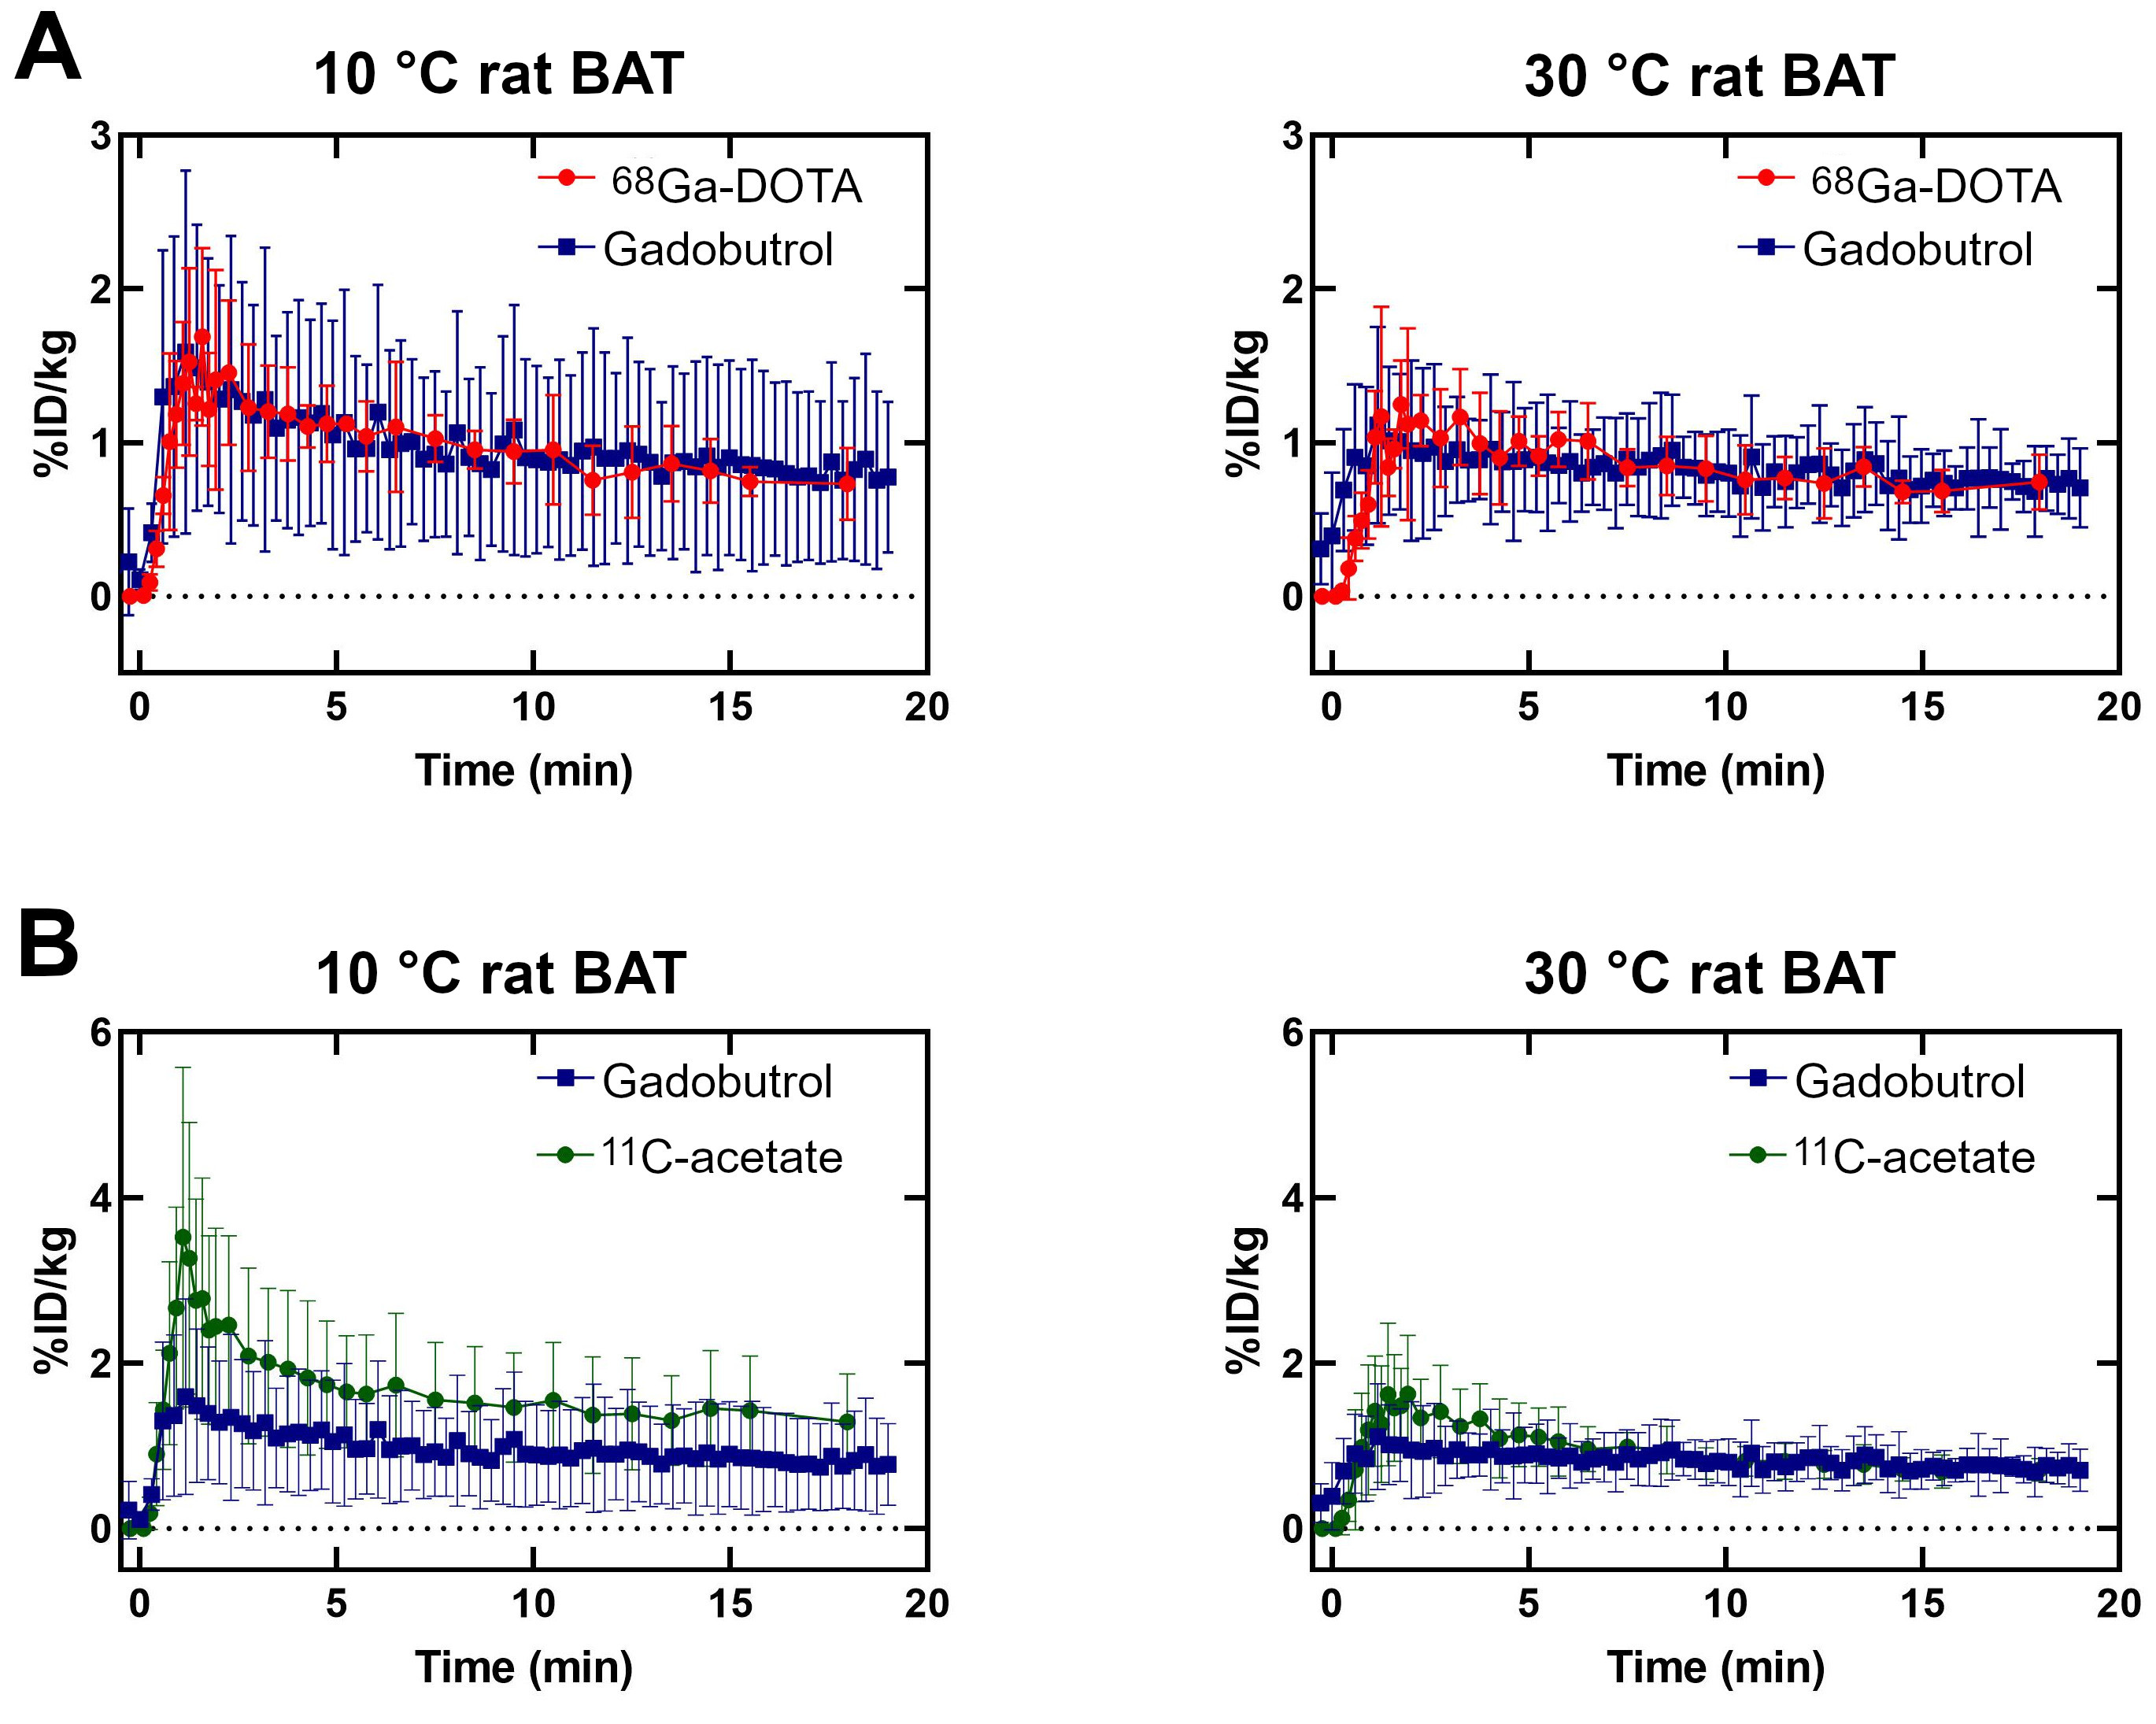
Figure 3 shows examples of DCE-MRI and PET concentration maps.Figure 4A compares the signals from DCE-MRI and 68Ga-DOTA PET. As expected, perfusion is higher in active BAT than inactive BAT. Average signals in active or inactive BAT are the same for both probes, but DCE-MRI results have larger inter-individual variations. A similar increase in signal for active BAT is observed with 11C-acetate (Fig. 4B). However, the 11C-acetate signal differs from the gadobutrol or 68Ga-DOTA signals by the presence of a large initial peak.
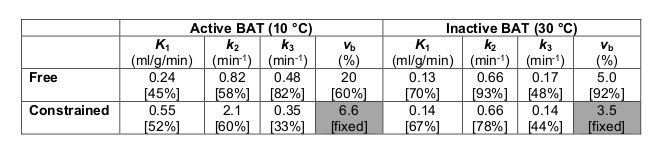
Correlations were found for the rate of entry into the tissue (K1, r = 0.51) and the tissue blood volume fraction (vb, r = 0.57) of 11C-acetate and gadobutrol. The 68Ga-DOTA cohort was too small to be analyzed for correlations but showed similar tendencies. With a fixed K1, 11C-acetate data fit quality (based on residual plots) was poor. Table 1 shows fit results for the non-constrained model and the vb-constrained model. The a priori information leads to an increase in k2 (oxidation) only for cold-exposed animals (active BAT) and does not affect inter-subject variability. However, the difference in oxidation between cold (active) and warm (inactive) conditions is not significant even with the DCE-constrained model (unconstrained p = 0.59; constrained p = 0.081).
DISCUSSION
Constraining the 11C-acetate pharmacokinetic model using vb derived from DCE-MRI reveals the expected increase in oxidation for active BAT which is otherwise interpreted as increased blood volume. The mean blood volume fractions inferred using DCE-MRI (6.6 % ± 2.7 % in active BAT and 3.5 % ± 1.6 % in inactive BAT) are similar to those measured by 15O-H2O PET in humans8. However, in this cohort, the increase in oxidation is not significant, and both DCE-MRI and 11C-acetate show high variability in cold-exposed animals. Possible causes are variations in animal age/weight during the 3-week study, individual responses to cold/β3-agonist, and temperature fluctuations during the scans (which seem to affect perfusion irrespective of metabolism). Experiments are underway to better control these parameters and obtain a direct comparison with 68Ga-DOTA.CONCLUSION
Blood volume estimation by DCE-MRI improves the assessment of oxidative metabolism with 11C-acetate in BAT. This technique would be particularly useful in simultaneous PET-MRI to assess blood volume changes under different pharmacological agents.Acknowledgements
The authors want to thank the Sherbrooke Molecular Imaging Center for access to PET scanners as well as the PET operators Jean-François Beaudoin and Maxime Paillé for their technical expertise.References
1. Cannon B and Nedergaard J. Brown Adipose Tissue : Function and Physiological Significance. Physiol. Rev. 84, 277–359 (2004).
2. Buck A, et al. Effect of Carbon-11-Acetate Recirculation on Estimates of Myocardial Oxygen Consumption by PET. 32, (2017).
3. Richard MA, et al. Determination of a pharmacokinetic model for [11C]-acetate in brown adipose tissue. EJNMMI Res. 9, (2019).
4. Autio A, et al. Assessment of blood flow with (68)Ga-DOTA PET in experimental inflammation: a validation study using (15)O-water. Am. J. Nucl. Med. Mol. Imaging 4, 571–9 (2014).
5. Autio A, et al. 68Ga-DOTA chelate, a novel imaging agent for assessment of myocardial perfusion and infarction detection in a rodent model. J. Nucl. Cardiol. (2019).
6. Tofts PS, et al. Estimating Kinetic Parameters From Dynamic Contrast-Enhanced T1-Weighted MRI of a Diffusable Tracer : Standardized Quantities and Symbols. J. Magn. Reson. Imaging 10, 223–32 (1999).
7. Yankeelov TE, et al. Quantitative pharmacokinetic analysis of DCE-MRI data without an arterial input function: a reference region model. Magn. Reson. Imaging 23, 519–29 (2005).
8. Din MU, et al. Human brown fat radiodensity indicates underlying tissue composition and systemic metabolic health. J. Clin. Endocrinol. Metab. 102, 2258–2267 (2017).
Figures