0639
Quantitative multiparametric PET-MRI of blood-brain barrier damage after stroke recanalization: nanoparticles versus small contrast agent
Justine Debatisse1,2, Omer Eker3,4, Oceane Wateau5, Tae-Hee Cho1,6, Marlene Wiart1, Nicolas Costes7, Ines Merida7, Christelle Leon1, Jean-Baptiste Langlois7, Thomas Troalen2, Christian Tourvielle7, Thibault Iecker7, Didier Le Bars7, Sophie Lancelot7, Norbert Nighoghossian1,6, Michel Ovize1,8, Hugues Contamin5, Francois Lux9, Olivier Tillement9, and Emmanuelle Canet Soulas1
1CarMeN lab, U1060 INSERM, University of Lyon, Lyon, France, 2Siemens Healthcare SAS, Saint-Denis, France, 3Interventional Neuroradiology, Hospices Civils de Lyon, Lyon, France, 4CREATIS lab, UMR CNRS 5220, INSERM U1206, INSA, University of Lyon, Villeurbanne, France, 5Cynbiose SAS, Marcy l'Etoile, France, 6Neurology, Hospices Civils de Lyon, Lyon, France, 7CERMEP, Lyon, France, 8Cardiology, Hospices Civils de Lyon, Lyon, France, 9ILM, CNRS UMR5306, University of Lyon, Villeurbanne, France
1CarMeN lab, U1060 INSERM, University of Lyon, Lyon, France, 2Siemens Healthcare SAS, Saint-Denis, France, 3Interventional Neuroradiology, Hospices Civils de Lyon, Lyon, France, 4CREATIS lab, UMR CNRS 5220, INSERM U1206, INSA, University of Lyon, Villeurbanne, France, 5Cynbiose SAS, Marcy l'Etoile, France, 6Neurology, Hospices Civils de Lyon, Lyon, France, 7CERMEP, Lyon, France, 8Cardiology, Hospices Civils de Lyon, Lyon, France, 9ILM, CNRS UMR5306, University of Lyon, Villeurbanne, France
Synopsis
Quantification of blood-brain barrier (BBB) leakage is of main interest in the stroke field to identify patients susceptible to develop hemorrhage and to identify the therapeutic window for neuroprotective drugs administration. We used small (Gd-DOTA) and medium size (nanoparticles AGuIX) contrast agents (CA) to quantify BBB permeability 60-to-90 minutes post-recanalization in a model of stroke using dynamic contrast-enhanced (DCE) MRI. We confirmed 1) Early BBB leakage with both CA and 2) BBB opening to nanoparticles at post-recanalization provides opportunity for selective neuroprotection drug delivery.
Introduction
Cerebral ischemia-reperfusion (CIR) is characterized by an episode of ischemia followed by restauration of blood flow to the suffering tissue. After CIR, the tissue may undergo physiological changes such as blood-brain barrier (BBB) leakage or tissue water content1. BBB permeability ranges from abnormal water movement, subtle permeability of small to large molecules to red blood cells extravasation, the latter leading to hemorrhagic transformation (HT), critical for patients’ outcome. Dynamic contrast-enhanced magnetic resonance imaging (DCE-MRI) is a T1 weighted imaging technique used to study BBB leakage with a paramagnetic contrast agent (CA). Its modeling is influenced by the relationship between signal enhancement and CA concentration dependent of intrinsic tissue parameters such as T1. It is increasingly used in the stroke field to study subtle BBB disruption where the signal enhancement is much smaller than in tumors and multiple sclerosis2. Yet, the dynamic of tissue T1 changes in CIR after recanalization therapy remains mainly unknown2.Small CA like gadoterate meglumine (Gd-DOTA, 0.5kDa, 1nm diameter) are generally used, but are thought to overestimate vascular permeability3. AGuIX Nanoparticles (NPs) are medium-size CA (8.7kDa, 3nm diameter)4 and can be radiolabeled to combine high PET sensitivity and MRI anatomical resolution. These NPs might better quantify BBB leakage, and might also reflect the ability of medium size drug to be delivered to the stroke area. We hypothesized that AGuIX-NPs can quantify BBB permeability after CIR more accurately than small CA. We also evaluated whether local CIR T1 variations due to water movements affect BBB permeability measures.Material and methods
Six Macaca fascicularis mature males underwent a 110-min transient minimally invasive endovascular middle cerebral artery occlusion. All experiments were approved by ethical committees (C2EA-18; C2EA-42). Simultaneous PET-MR imaging (Siemens Biograph mMR 3T) was performed during ischemia and post-recanalization. Per-ischemia MRI identified the core lesion with diffusion-weighted imaging (DWI) (TR/TE=6650/57ms; voxel size=1.3x1.3x1.3mm; TA=3:00min; b-values=0,1000), followed by post-recanalization DWI and post-contrast fluid attenuated inversion recovery (FLAIR; TR/TE=5000/418ms; voxel size=0.4x0.4x0.8mm; TA=9:15min). Post-recanalization dynamic contrast enhanced MRI (DCE-MRI FLASH; TR/TE=5.2/2.5ms; voxel size=2x2x2mm, bolus of 0.1mmolGd/kg) was done respectively with AGuIX-NPs (at 60min; 100 measurements; r1=8.9 mM-1s-1, at 0.3 mL/sec) and Gd-DOTA (at 90min; 60 measurements; r1=3.5 mM-1s-1). Prior to each CA, T10 was measured (FLASH; TR/TE=5.2/2.5ms; voxel size=2x2x2mm; TA=32sec) using four flip angles (5,10,15,25°). AGuIX-NPs are dual-labeled with [68Ga] (141±18MBq) and a 30-minute dynamic PET (31 frames) was acquired simultaneously with DCE-MRI. Imaging protocol is repeated at day 7 (day+7) after CIR. To compare CA dynamics (PET [68Ga]AGuIX-NPs, DCE-MRI AGuIX-NPs and Gd-DOTA), we extracted signal time curves from blood and ipsilateral and mirror contralateral areas.Apparent diffusion coefficient (ADC) maps (in mm2/s) were computed from DWI imaging. Maps of T10 (T1-maps) were calculated from each pre-contrast acquisitions. For each CA, we computed capillary permeability maps (Ktrans) with the extended Tofts model, placing an input function in the sagittal sinus (Olea Sphere v3.0), i.e. a quantitative Ktrans map (using T1-map to convert signal into gadolinium concentration) and a relative Ktrans map (using only the delta signal enhancement). We manually drew 4-mm circle region-of-interest (ROI) in the per-ischemia lesional and peri-lesional areas and their respective mirrors to assess T1, ADC and Ktrans evolution. ROIs with T1 values above 5s were considered artifactual and were removed. Non-parametric paired Wilcoxon test was used to compare ipsilateral versus contralateral hemispheres values (GraphPad Prism v6).Results
All animals completed each imaging time-point. AGuIX-NPs input blood curve is representative of large molecule vascular kinetic compare to diffusible Gd-DOTA (Fig.1A). The tissue curve derived from post-recanalization [68Ga]AGuIX PET, DCE-MRI AGuIX and Gd-DOTA sequences (Fig.1B) show similar kinetic patterns, with higher signal in the ischemic hemisphere compared to controlateral. Lesional and perilesional ADC values significantly decreased during ischemia and post-recanalization compared to contralateral mirror values and increased at day+7 after CIR (Fig.1A). We also observe opposite T1 and Ktrans values evolution (Fig.1B-C).We found that post-recanalization Ktrans values were consistent with CA diameter (higher values when diameter is lower; see Table). Illustrative maps in one animal show similar BBB leakage pattern with the two CA (Fig.3). When comparing post-recanalization Ktrans values (Fig.4) obtained with intrinsic T1 values (Ktrans) or without (relative Ktrans), we found excellent (for AGuIX: Fig.4A; r=0.96) and good (for Gd-DOTA; Fig.4B; r=0.76) correlation between the two parameters in the pathological hemisphere, where BBB leakage is visible. Overestimation of relative compare to quantitative Ktrans values is similar with both CA (regression slope of 1.49 for AGuIX and 1.36 for Gd-DOTA), but more dispersed with Gd-DOTA.Discussion and Conclusion
This study evaluates early BBB damage after CIR, ranging from water distribution changes on ADC and T1 to important leakage of large molecules. With small (Gd-DOTA) and large molecules (AGuIX-NPs), quantitative Ktrans values were consistent with CA size, also suggesting that BBB leakage can be detected with a medium size CA, more representative of drug diameter and molecular weight. This confirm that 60-min post-recanalization is in the therapeutic window for neuroprotective drug administration. Overestimation of relative versus quantitative Ktrans, prevent its use to define a threshold for HT and confirm T1-mapping usefulness in BBB leakage quantification. This multiparametric characterization opens the way for radiomics analysis in stroke after recanalization.Acknowledgements
This work was supported by the ANR CYCLOPS (ANR-15-CE17-0020) and the RHU MARVELOUS (ANR-16-RHUS-0009) of Université de Lyon, within the program Investissements d’Avenir operated by the French National Research Agency (ANR). The PhD salaries of Oceane Wateau (Cifre, Cynbiose) and Justine Debatisse (Cifre, Siemens) are co-funded by the French Ministry of Higher Education and Research (ANRT).References
1. K. Villringer, et al, DCE-MRI blood – brain barrier assessment in acute ischemic stroke. Neurology, 433–440 (2016). 2. P. A. Armitage, et al, Use of dynamic contrast-enhanced MRI to measure subtle blood-brain barrier abnormalities, Magn. Reson. Imaging 29, 305–314 (2011).3. Y. Yan, et al, Contrast agents in dynamic contrast-enhanced magnetic resonance imaging, Oncotarget 8, 43491–43505 (2017).4. L. Sancey, et al, Long-term in Vivo clearance of gadolinium-based AGuIX nanoparticles and their biocompatibility after systemic injection, ACS Nano 9, 2477–2488 (2015)Figures
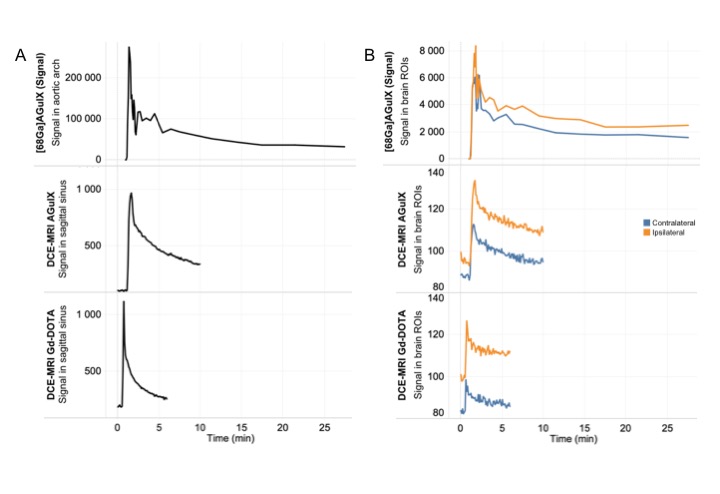
Fig.1. Signal enhancement in input function (A) and brain ROIs (B) in one animal for 30-min dynamic [68Ga]AGuIX PET (first row), DCE-MRI AGuIX (second row) and DCE-MRI Gd-DOTA (third row). Input functions were placed in the aortic arch for [68Ga]AGuIX PET and in sagittal sinus for DCE-MRI. Brains ROIs were placed in both ipsilateral (orange) and contralateral (blue) to the lesion hemispheres.
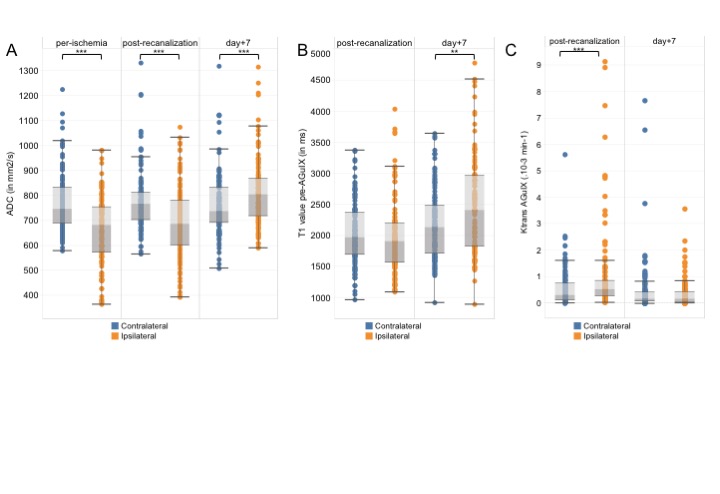
Fig.2. Box-plots of ADC (in mm2/s, A), T1 (in milliseconds, B) and Ktrans values (in .10-3 min-1, C) in per-ischemia lesional and peri-lesional ROIs (orange; n=6 NHP; n=113 ROIs) and their respective mirrors ROIs (blue; n=6 NHP; n=113 ROIs) at three time points: per-ischemia, post-recanalization and day+7 after CIR. Non-parametric paired Wilcoxon test was used to compare ipsilateral versus contralateral hemispheres: ** p<0.001; *** p<0.0001
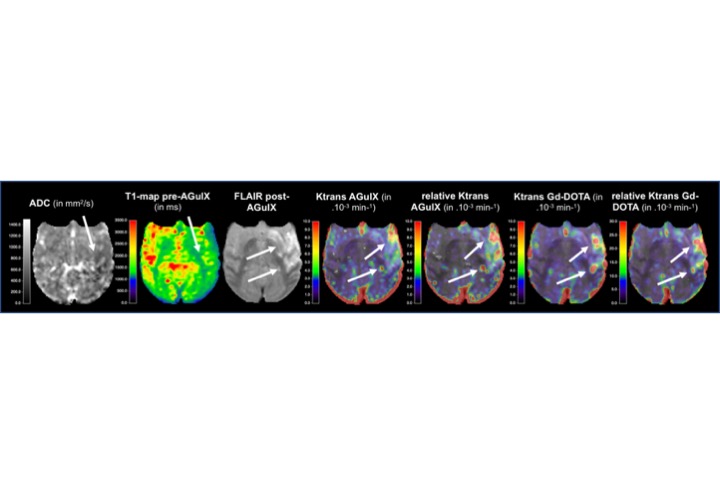
Fig.3. Post-recanalization representative maps of ADC, T1-map pre-AGuIX, FLAIR post-AGuIX, Ktrans and relative Ktrans AGuIX and Gd-DOTA in one animal. Arrows show area of abnormal tissue on ADC and T1, and areas of BBB leakage on FLAIR post-AGuIX and multiple Ktrans maps.
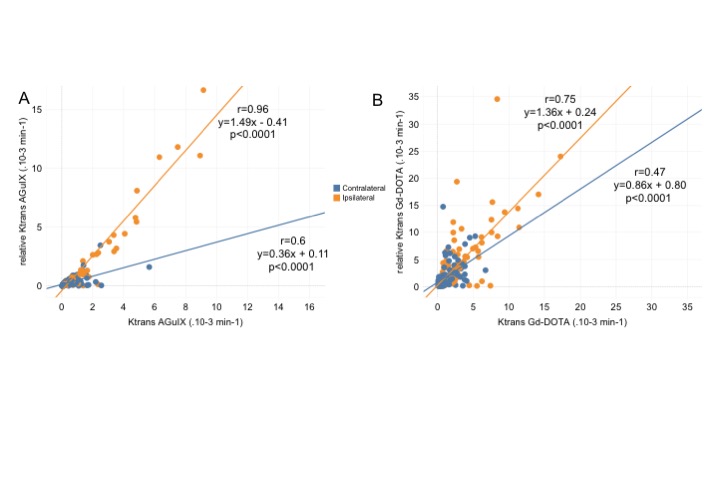
Fig. 4. Scatter plots illustrating the degree of correlation between Ktrans and relative Ktrans with two contrastagents: AGuIX (A) and Gd-DOTA (B) in ipsilateral (orange circles ; r=0.96 for AGuIX; r=0.75 for Gd-DOTA; p<0.001 for both) and contralateral (blue circles; r=0.6 for AGuIX; r=0.47 for Gd-DOTA p<0.001 for both) hemispheres.
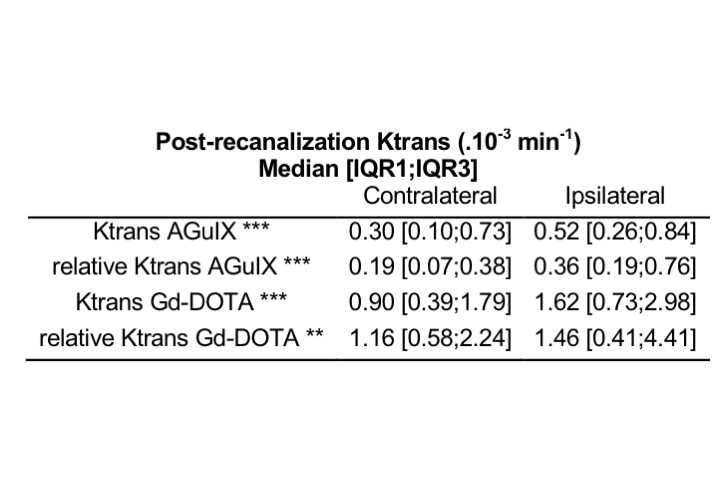
Table: Post-recanalization median [first interquartile range IQR1; third interquartile range IQR3] Ktrans and relative Ktrans for AGuIX and Gd-DOTA contrast agents in both contralateral and ipsilateral hemispheres.Non-parametric paired Wilcoxon test was used to compare ipsilateral versus contralateral hemispheres: ** p<0.001; *** p<0.0001