0638
Multimodal resting-state functional and metabolic connectivity with simultaneous MR-PET1Monash Biomedical Imaging, Monash University, Melbourne, Australia, 2Turner Institute for Brain and Mental Health, School of Psychological Sciences, Monash University, Melbourne, Australia, 3Australian Research Council Centre of Excellence for Integrative Brain Function, Melbourne, Australia
Synopsis
Metabolic connectivity measured using FDG-PET has been proposed as a biomarker for disease, however static FDG-PET cannot provide subject-level measures of connectivity. We applied constant infusion functional FDG-fPET to measure subject-level metabolic connectivity simultaneously with BOLD-fMRI connectivity. Group-average FDG-fPET and BOLD-fMRI connectivity profiles showed similarities and differences. FDG-fPET and BOLD-fMRI connectivity was most similar in superior cortex, and least similar in subcortical regions. Group-average FDG-fPET within-subject connectivity showed little similarity with static FDG-PET connectivity. Our new method opens up the opportunity for new metabolic neuroimaging biomarkers for disease, as well as approaches for multimodality MR-PET imaging.
Introduction
Resting-state connectivity analyses using different imaging modalities can provide unique perspectives on information transfer in the brain. FDG-PET provides a snapshot of cerebral glucose uptake; FDG-PET connectivity characterises covariation in glucose uptake across the brain.1,2 This ‘metabolic’ connectivity is an important complement to BOLD-fMRI ‘functional’ connectivity, since FDG-PET represents a quantitative measure of neural function with fewer haemodynamic and vascular confounders. However, BOLD-fMRI has superior signal-to-noise, spatial and temporal resolution, and a more mature processing pipeline.Multimodal MR-PET studies show modest overlap between BOLD-fMRI and FDG-PET connectivity profiles, with different patterns of anterior-posterior and left-right connectivity.3–5 The static PET acquisitions used by these studies is their major limitation, as it provides a single cumulative measurement per subject, with connectivity estimated between-subjects.
Here, we use continuous infusion FDG functional PET (FDG-fPET) to measure within-subject metabolic connectivity6, whilst simultaneously measuring BOLD-fMRI connectivity. We compare group-average connectivity between the two modalities and examine the anatomical pattern of connectivity strength, within-group variation and between-modality correlations. We develop a temporal filter for estimating instantaneous fluctuations from the cumulative FDG-fPET signal, and examine the relationship between FDG blood concentration and FDG-fPET connectivity.
Methods
Participants (n=27; 18-23-years; mean 19-years; 21 females; all right-handed) underwent a 95-minute, eyes-open, simultaneous MR-PET scan (Siemens Biograph 3 Tesla molecular MR; 16-channel radiofrequency head coil). FDG (average dose 233MBq) was infused over the course of the scan at a rate of 36mL/hr using a BodyGuard 323 MR-compatible infusion pump (Caesarea Medical Electronics, Israel). Blood radioactivity levels were measured with 10mL blood samples drawn every 10-minutes, from a venous cannula.Structural MRIs were acquired for the first 35 minutes of the session. Then, six consecutive 10.02min blocks of T2*-weighted EPI were acquired (TR=2450ms, TE=30ms, FOV=190mm, voxels=3x3x3mm, slices=44, ascending axial). fMRI processing included bias-field correction,7 skull stripping,7,8 slice time correction,9 motion correction,10 and highpass filtering (0.01Hz).
Simultaneously with the BOLD-fMRI, FDG-fPET data was acquired using constant infusion radiotracer administration.11 FDG-fPET data (1.4x1.4x2.0mm voxels) was reconstructed into 16-second bins and filtered using a convolution of two filters (Eq.1). The first, a spatial gaussian filter ($$$\sigma=1$$$ voxel), $$$g(\overrightarrow{r})$$$. Second, a temporal gaussian filter ($$$\sigma=2$$$ frames, 32-seconds), $$$h(t)$$$, modified to estimate a gradient using $$$\alpha(t,x)$$$ (Eq.2).
$$f(\overrightarrow{r},t)=g(\overrightarrow{r})\circledast\alpha(h(t),t)$$(Eq.1)
$$a(x,t) = \begin{cases}
-x & \text{if $t<0$} \\
0 & \text{if $t=0$} \\
x & \text{if $t>0$}
\end{cases}$$(Eq.2)
The brain was parcellated into 82 regions12,13 using T1-weighted scans, and interpolated to fMRI and fPET native spaces using rigid-registration.8 Per-subject correlation matrices were calculated separately for fMRI and fPET, using Pearson correlations between timeseries from each pair of regions.
Per-region connectivity strength was inferred by calculating the degree of a binary matrix, thresholded at the 90% percentile of absolute correlations, for both fMRI and fPET. Connection variance was estimated with between-subject standard deviation in correlations for each region. Between-modality correlation was estimated for each region.
A static PET connectome was estimated from a single-frame 60-minute static PET image for each subject, correlating the signal intensity of region pairs between-subjects. This static connectome was correlated with each individual subjects’ fPET connectome.
Results
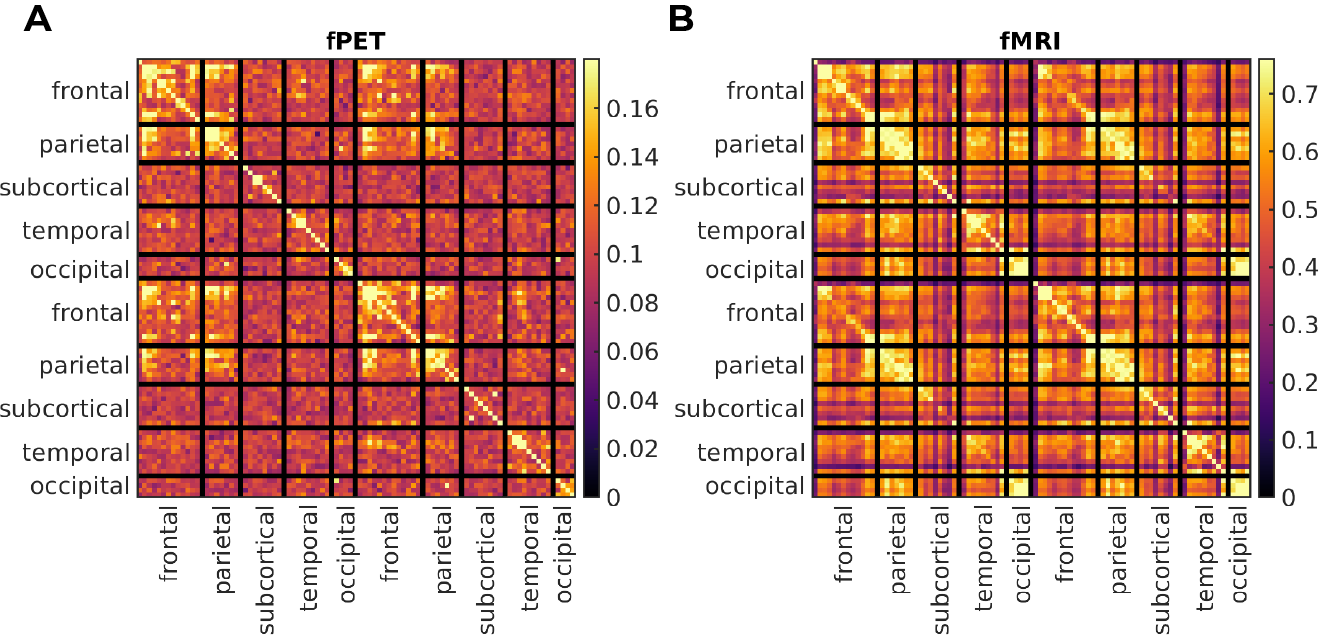
For both modalities, group-average connectivity displayed prominent fronto-fronto, fronto-parietal, and parieto-parietal subnetworks, within and between hemispheres (Figure 1). fPET did not detect additional inter-hemispheric subnetworks.A per-block fPET connectome was derived corresponding to each of the six EPI blocks (Figure 2). The networks obtained in the all-block average (Figure 1) did not emerge until near the blood-radioactivity peak (Block 5, Figure 2).
The strongest fPET connectivity was observed in frontal regions; between-subject variance in connectivity was also highest in these regions (Figure 3). Conversely, the strongest fMRI connectivity was located in posterior regions, with highest variance in the sub-cortical and frontal regions (Figure 3).
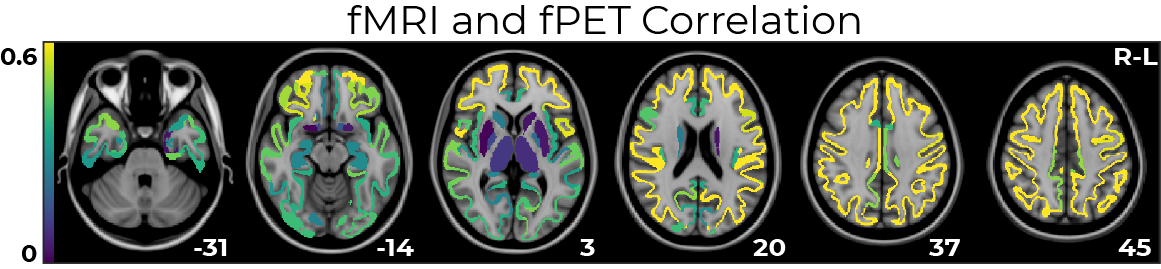
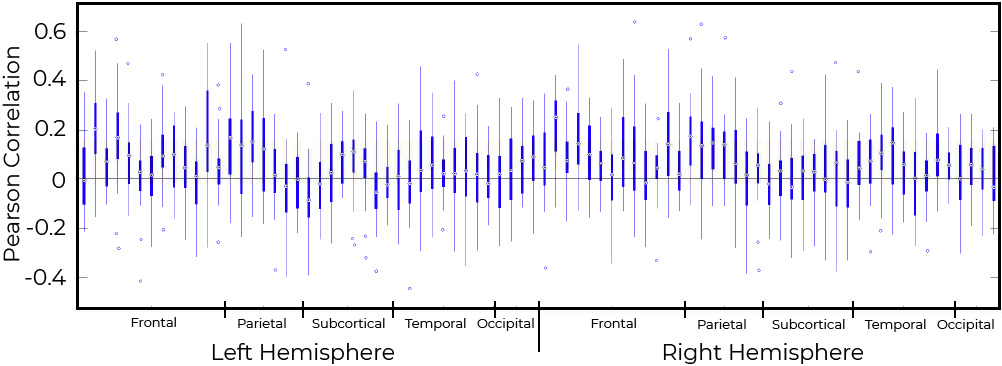
fPET-fMRI connectivity correlations were higher in superior regions (Pearson coefficient ~ 0.6, Figure 4), and lower in sub-cortical regions.
In general, fPET and static PET connectivity were not related (Figure 5). The inter-quartile range of subjects crossed the zero line for a majority of regions.
Discussion
Metabolic FDG-fPET and haemodynamic BOLD-fMRI resting-state connectivity were simultaneously acquired and compared. FDG-fPET and BOLD-fMRI connectivity was spatially varied, with moderate similarity in superior cortex, and low similarity in sub-cortical regions. This pattern of results highlights the complementary strengths of these methods. Given the poor correlation between fPET and static PET connectivity, caution should be taken when interpreting previous studies.14fPET is a nascent field and is undergoing rapid development. Further work developing and optimizing filtering methods and infusion techniques may decrease the between-subject and between-block variance observed.
Conclusion
Metabolic connectivity has been proposed as a putative biomarker for neurodegenerative disease, however, studies to date have used static FDG-PET connectivity across-subjects. Thus, development of single-subject FDG-fPET metabolic connectivity provides opportunities for biomarker development and exploration of clinical insights. With simultaneously acquired data, we have shown that metabolic and haemodynamic connectivity show important similarities and differences in their connectivity profiles. A multimodal approach allows us to revisit previous findings and potentially isolate vascular and haemodynamic confounders from neural activity.Acknowledgements
We would like to thank the volunteers for their time and willingness to participate in this study. We would also like to thank the technical staff, Richard McIntyre and Alexandra Carey, for helping collect the data and design and administer a complex protocol.References
1. Horwitz B, Duara R, Rapoport SI. Intercorrelations of Glucose Metabolic Rates between Brain Regions: Application to Healthy Males in a State of Reduced Sensory Input. J Cereb Blood Flow Metab. 1984;4(4):484-499. doi:10.1038/jcbfm.1984.73
2. Moeller JR, Strother SC, Sidtis JJ, Rottenberg DA. Scaled Subprofile Model: A Statistical Approach to the Analysis of Functional Patterns in Positron Emission Tomographic Data. J Cereb Blood Flow Metab. 1987;7(5):649-658. doi:10.1038/jcbfm.1987.118
3. Di X, Biswal BB, Alzheimer’s Disease Neuroimaging Initiative. Metabolic brain covariant networks as revealed by FDG-PET with reference to resting-state fMRI networks. Brain Connect. 2012;2(5):275-283. doi:10.1089/brain.2012.0086
4. Di X, Gohel S, Thielcke A, Wehrl HF, Biswal BB, The Alzheimer’s Disease Neuroimaging Initiative. Do all roads lead to Rome? A comparison of brain networks derived from inter-subject volumetric and metabolic covariance and moment-to-moment hemodynamic correlations in old individuals. Brain Struct Funct. 2017;222(8):3833-3845. doi:10.1007/s00429-017-1438-7
5. Savio A, Fünger S, Tahmasian M, et al. Resting-State Networks as Simultaneously Measured with Functional MRI and PET. J Nucl Med. 2017;58(8):1314-1317. doi:10.2967/jnumed.116.185835
6. Villien M, Wey H-Y, Mandeville JB, et al. Dynamic Functional Imaging of Brain Glucose Utilization using fPET-FDG. NeuroImage. 2014;100:192-199. doi:10.1016/j.neuroimage.2014.06.025
7. Tustison NJ, Avants BB, Cook PA, et al. N4ITK: improved N3 bias correction. IEEE Trans Med Imaging. 2010;29(6):1310-1320. doi:10.1109/TMI.2010.2046908
8. Avants BB, Epstein CL, Grossman M, Gee JC. Symmetric diffeomorphic image registration with cross-correlation: evaluating automated labeling of elderly and neurodegenerative brain. Med Image Anal. 2008;12(1):26-41. doi:10.1016/j.media.2007.06.004
9. Cox RW. AFNI: Software for Analysis and Visualization of Functional Magnetic Resonance Neuroimages. Comput Biomed Res. 1996;29(3):162-173. doi:10.1006/cbmr.1996.0014
10. Jenkinson M, Bannister P, Brady M, Smith S. Improved Optimization for the Robust and Accurate Linear Registration and Motion Correction of Brain Images. NeuroImage. 2002;17(2):825-841. doi:10.1006/nimg.2002.1132
11. Jamadar SD, Ward PGD, Carey A, et al. Radiotracer Administration for High Temporal Resolution Positron Emission Tomography of the Human Brain: Application to FDG-fPET. JoVE J Vis Exp. 2019;(152):e60259. doi:10.3791/60259
12. Desikan RS, Ségonne F, Fischl B, et al. An automated labeling system for subdividing the human cerebral cortex on MRI scans into gyral based regions of interest. NeuroImage. 2006;31(3):968-980. doi:10.1016/j.neuroimage.2006.01.021
13. Fischl B, Salat DH, Busa E, et al. Whole Brain Segmentation: Automated Labeling of Neuroanatomical Structures in the Human Brain. Neuron. 2002;33(3):341-355. doi:10.1016/S0896-6273(02)00569-X
14. Yakushev I, Drzezga A, Habeck C. Metabolic connectivity. Curr Opin Neurol. 2017;30(6):677-685. doi:10.1097/WCO.0000000000000494
Figures