0637
MRI-assisted high temporal resolution dynamic FDG-PET imaging for assessing brain functions1Monash University, Clayton, Australia, 2IITB Monash Research Academy, Mumbai, India, 3Indian Institute of Technology, Bombay, Mumbai, India, 4Monash Biomedical Imaging, Clayton, Australia, 5Turner Institute for Brain and Mental Health, Clayton, Australia
Synopsis
Simultaneous positron emission tomography (PET) and magnetic resonance imaging (MRI) provide complementary structural and functional information. Recent developments in continuous infusion functional PET (fPET) have shown promising results to track dynamic changes in brain metabolism. Although fPET provides opportunities to investigate functional metabolism in the brain, the temporal resolution still remains a major challenge compared to functional MRI (fMRI). In this work, we use anatomical MRI information modeled as a Bowsher prior to improve the sensitivity of fPET at higher temporal resolution. We validate our MRI-assisted fPET analysis framework using both in-silico and in-vivo experiments.
Introduction
Conventional 18-F-fluorodeoxyglucose (FDG) - positron emission tomography (PET) based on bolus injection of radiotracer offers only a static snapshot of brain metabolism a narrow time-window to track the metabolic dynamics at the beginning of the scan.1 Recently, continuous infusion-based functional PET (fPET) with dynamic PET image reconstruction was introduced to improve the temporal dynamics of the metabolic measurements.1,2 Several studies report usage of fPET to isolate task related glucose metabolism,1,3,4 and resting-state brain metabolic networks.5 However, fPET suffers from low temporal resolution (> 1 minute) due to radiotracer dosage and instrumentation limitations. Previous studies, leveraging MRI anatomical knowledge, showed improvement of static low-dose PET image quality using dictionaries,6,7 and deep learning-based solutions.8 A recent study involving an improved version of anatomical MRI-based Bowsher prior, applied to static PET, showed better bias-variance characteristics compared to other gradient-based priors.9 To date, MRI-assisted PET image quality improvement has not been applied and validated for fPET studies. Instead, standard Gaussian smoothing (with large kernel size) is used for denoising, resulting in over-smoothed images and partial volume effects.We hypothesized that MRI anatomical information modeled as a Markov Random Field (MRF) based Bowsher prior can assist in improving fPET image quality by delineating anatomical boundaries as well as suppressing noise in the fPET images, and consequently increase the sensitivity of fPET in detection of brain metabolism. Using a simulated visual task-based experiment we analyze and compare the performance of the approach in combination with independent component analysis (ICA) of fPET spatio-temporal data matrices. The performance of the MR assisted method is also validated using in-vivo data.
Methods
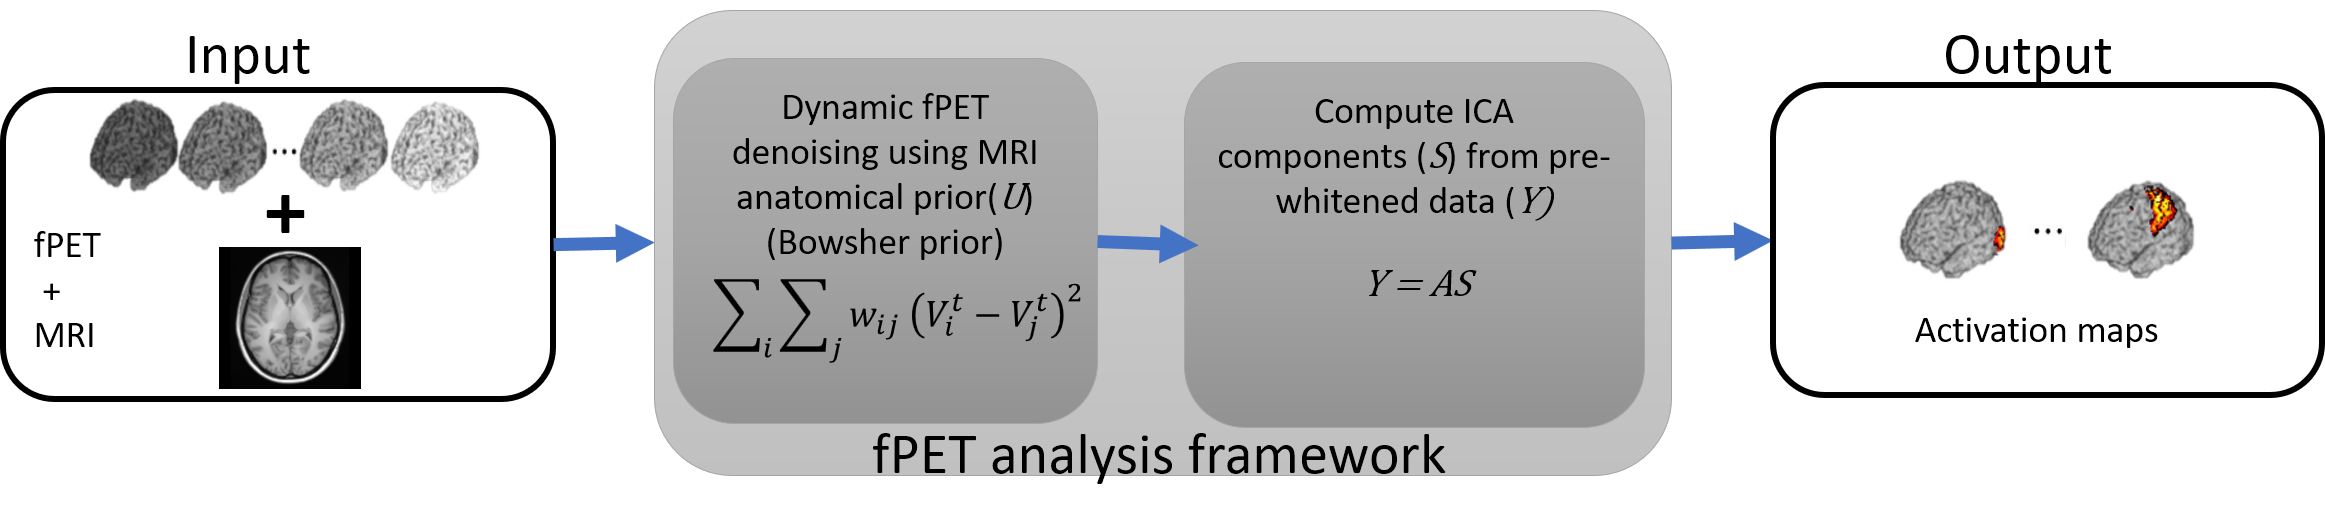
The analysis framework is summarized in Figure 1.Bowsher prior from MRI. Let $$$U$$$ and $$$\{V^t\}_{t=1}^{T}$$$ denote the MRI anatomical image and $$$T$$$ frames from the dynamic fPET sequence, respectively. We formulate our denoising problem to obtain the denoised $$$t$$$th frame as:
$$\arg \min_{X^t} D(V^t,X^t) + \alpha R(U,X^t)$$.
Here, $$$D(.)$$$ and $$$R(.)$$$ denote the $$$l_2$$$ norm-based data-consistency term and Bowsher prior term (weighted by scalar $$$\alpha$$$), respectively. The prior $$$R(U,X^t) := \sum_i \sum_j w_{ij} (X^t_i - X^t_j)^2$$$, where $$$w_{ij} \forall i,j$$$s is computed from the MRI image $$$U$$$, such that $$w_{ij}= \begin{cases} 1 ,& \text{if } j \in \mathcal{W_i} \\ 0, & \text{otherwise}\end{cases}.$$ The set $$$\mathcal{W}_i$$$ consists of the closest (in terms of absolute intensity difference) $$$q$$$ out of $$$N$$$ immediate neighbors of voxel $$$i$$$ in the MRI image.
Spatial ICA. The set of denoised images, $$$\{\widehat{X^t}\}_{t=1}^T$$$, are re-arranged into a spatio-temporal matrix $$$Y$$$ and pre-whitened before performing ICA. While columns of $$$Y$$$ represent the time-series of a single voxel, the rows represent measurements at different voxels. The ICA algorithm decomposes $$$Y$$$ into independent components, $$$S$$$, and corresponding mixing matrix $$$A$$$, such that $$$Y = AS$$$. Here, both the unknowns $$$A$$$ and $$$S$$$ are estimated by an iterative process.10 The independent components,$$$S$$$, represent brain metabolic activation.
Data Preparation
Simulation data. We generated a synthetic dynamic fPET simulation consisting of 90 frames using a simulated MNI template T1 weighted MRI image. Task-based brain activation was simulated using the two-tissue compartment model.5In vivo data. We collected fPET and T1-weighted MRI datasets from five healthy subjects (ethics approved) using a 3T Siemens mMR scanner. The data included 10-minute resting, 10-minute visual stimulation using a checkerboard pattern and another 10-minute resting periods for each subject. The PET list-mode data were binned to yield frames with temporal resolution of 60 and 30 seconds. Standard OP-OSEM (3 iterations, 21 subsets) reconstruction with corrections was carried out using vendor provided software.
Results and Discussion
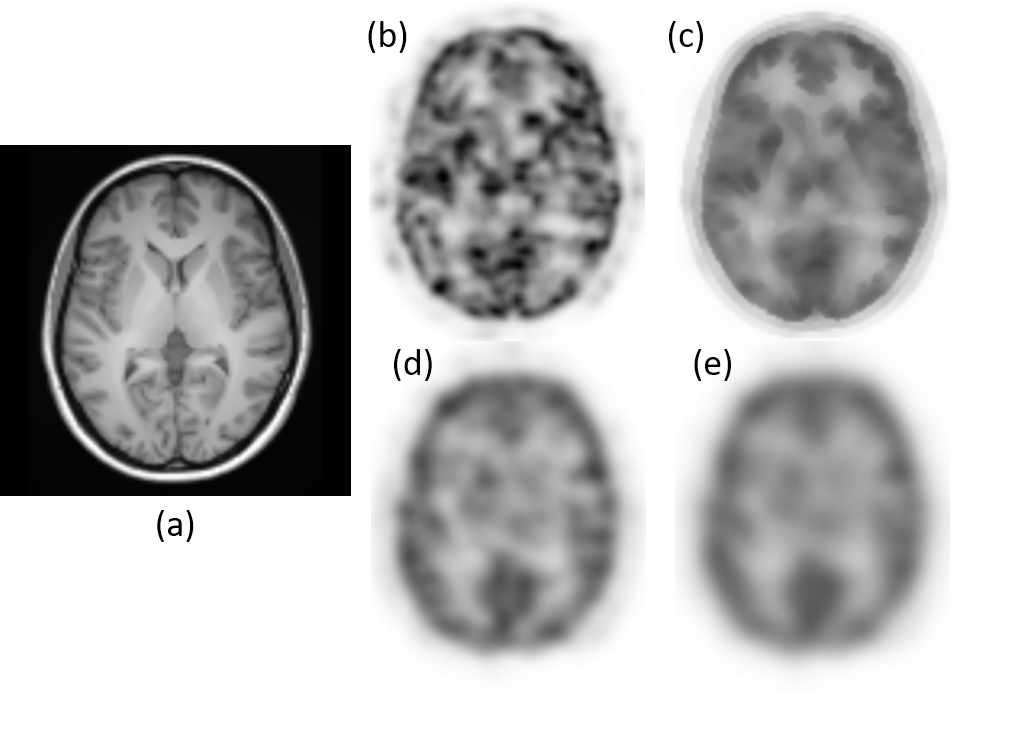
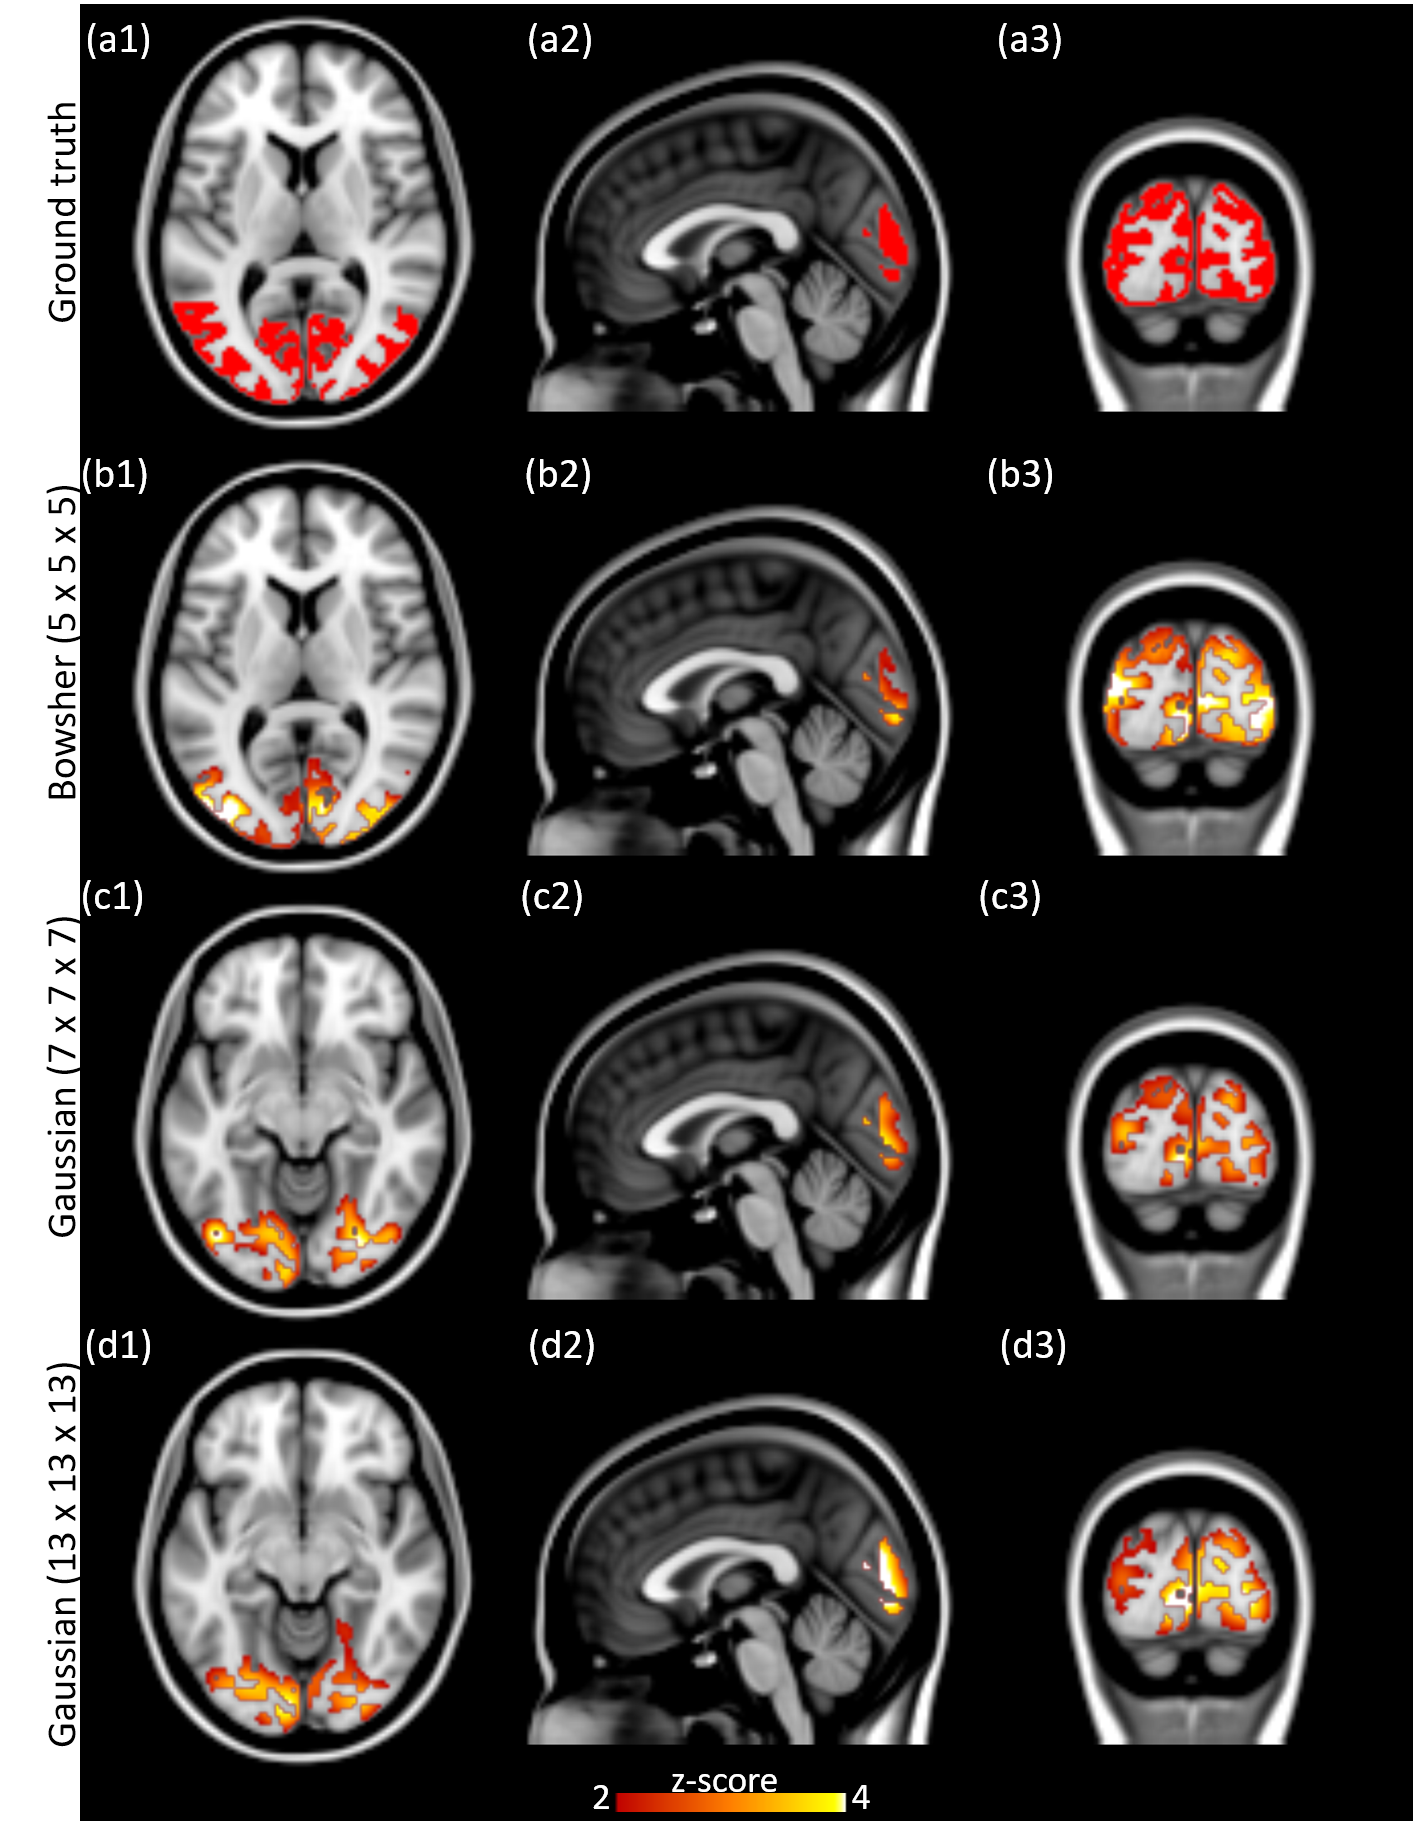
Bowsher prior processed fPET images. The processed fPET images using different methods are shown in Figure 2. The Bowsher-prior based fPET image (Figure 2 (c)) shows well defined anatomical boundaries and reduction of noise. In contrast, the Gaussian smoothed fPET images (Figure 2 (d) - (e)) show reduced image resolution and strong partial volume effects.Simulated data. The ICA components corresponding to the simulated visual cortex activation are shown in Figure 3. Compared with the ground truth activation maps (Figure 3 (a1) - (a3)), the Bowsher-prior based fPET images (Figure 3 (b1) – (b3)) with an isotropic kernel size of 5 mm is able to identify correct brain activation. In contrast, the Gaussian smoothed fPET images, even with larger kernel sizes of 7 mm isotropic (Figure 3 (c1) – (c3)) and 13 mm isotropic (Figure 3 (d1) – (d3)) show larger errors in estimation of activated regions in the visual cortex.
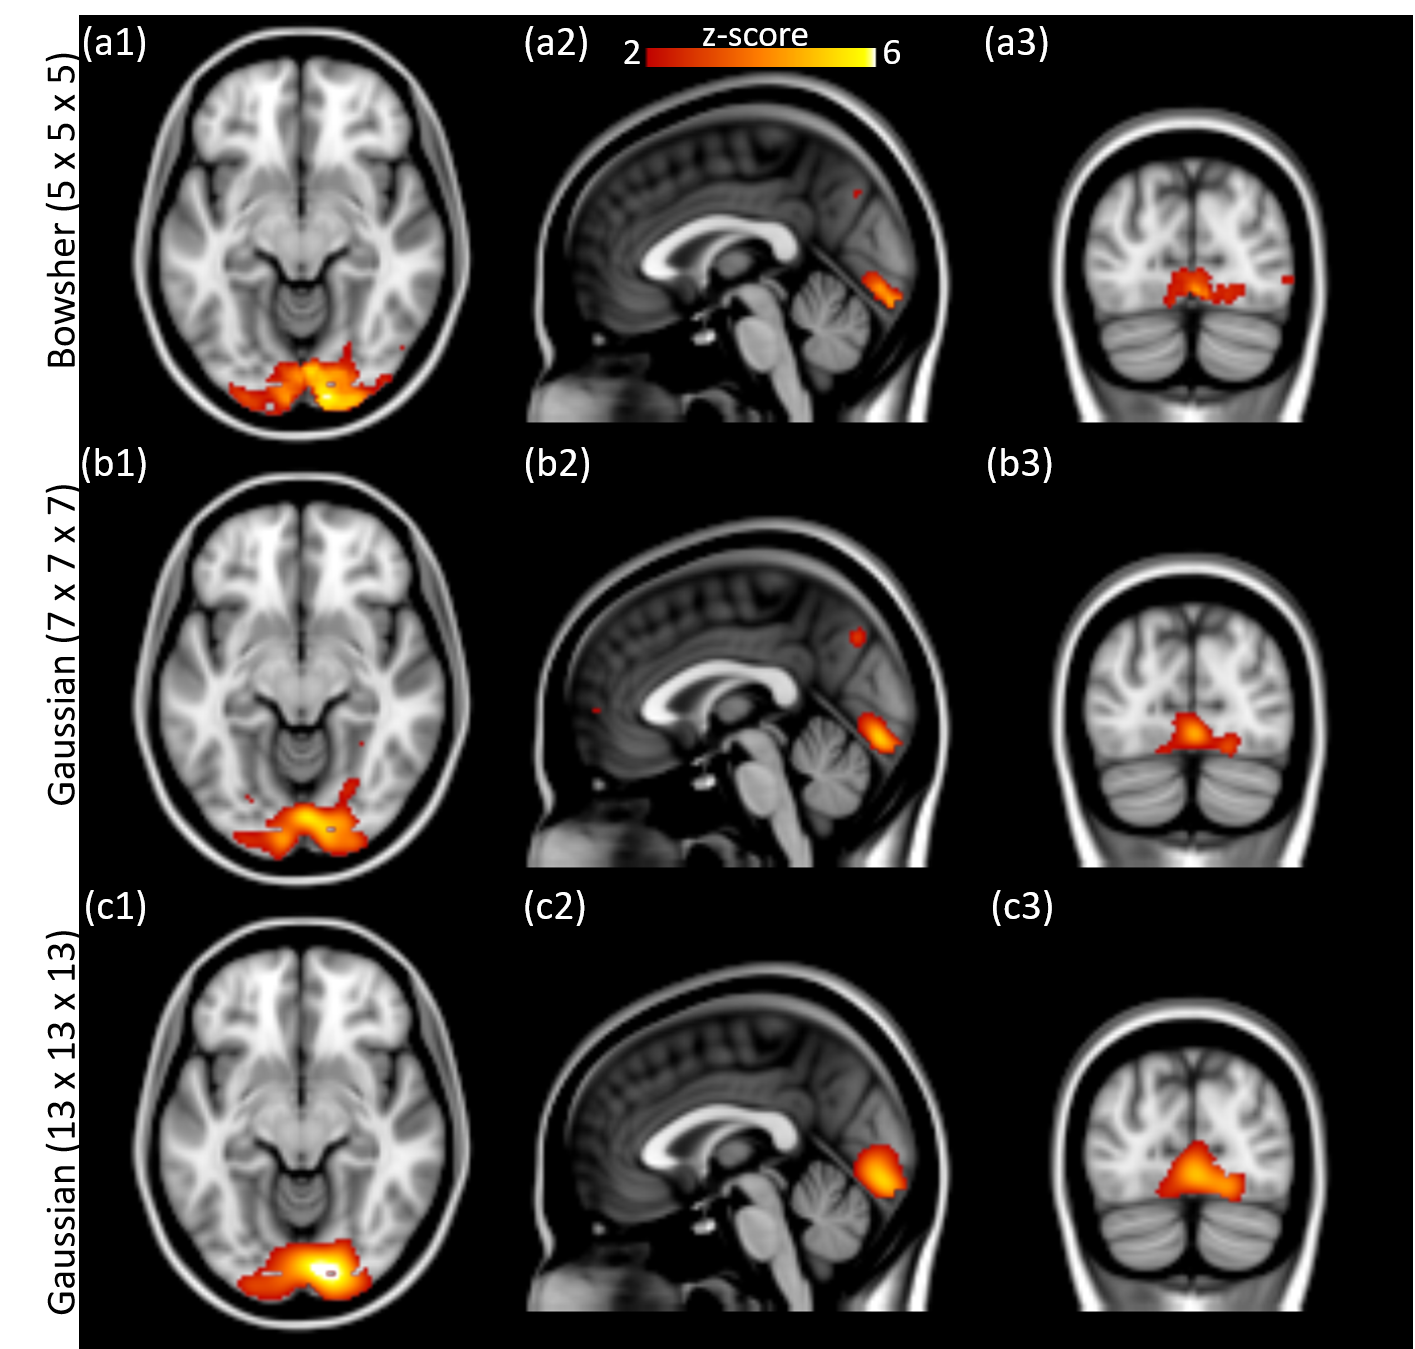
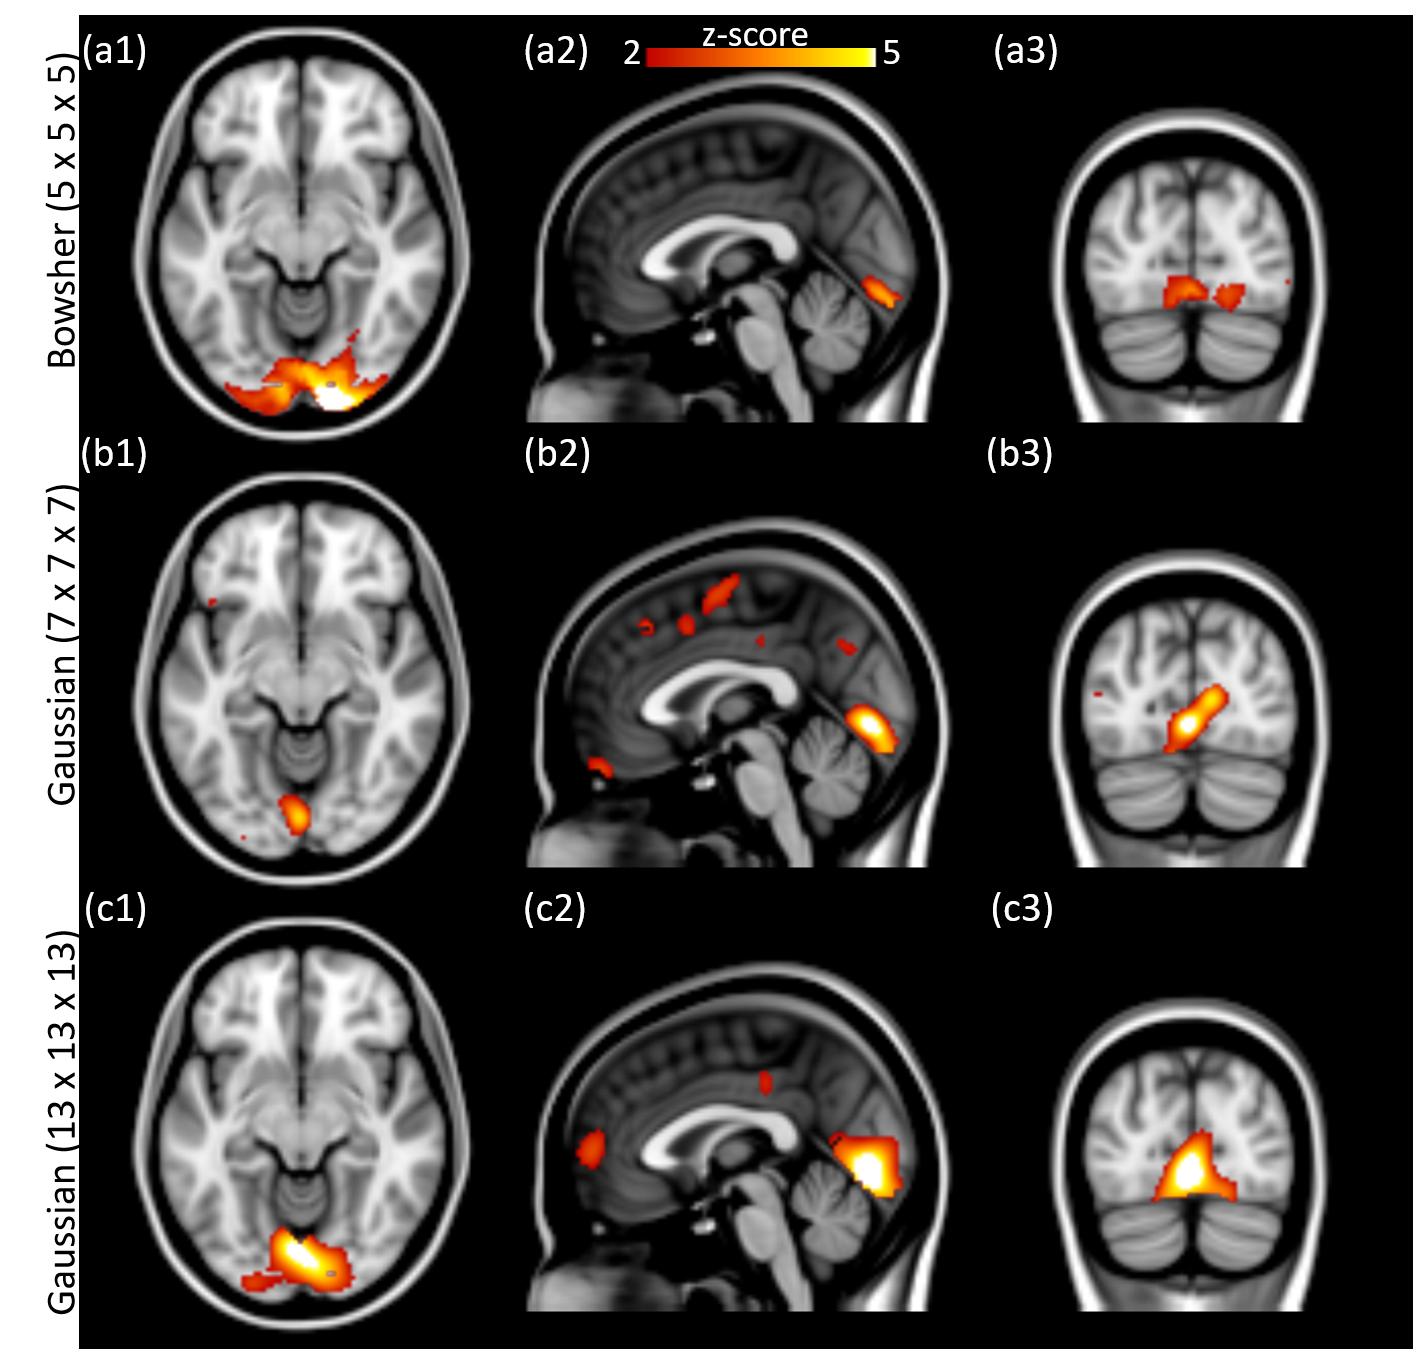
In-vivo data. ICA components of the processed fPET images with temporal resolution of 60 and 30 seconds are shown in Figures 4 and 5, respectively. At higher temporal resolution (30 seconds), as the Gaussian smoothing kernel increases, a larger activation region is identified and seems to encompass surrounding regions of the visual cortex. On the other hand, the independent components from the Bowsher prior based results indicate accurate activation regions even at higher temporal resolution, consistent with our simulation study.
Conclusion
This work proposes an MRI-assisted fPET analysis framework using anatomical information from MRI to improve fPET image quality. Using in-silico and in-vivo experiments, we observe that the MRI-assisted fPET analysis method significantly improves the sensitivity to identify task related brain metabolic activation even using very low-dose PET at high temporal resolution.Acknowledgements
No acknowledgement found.References
[1] Villien, Marjorie, et al. "Dynamic functional imaging of brain glucose utilization using fPET-FDG." Neuroimage 100 (2014): 192-199.
[2] Chen, Zhaolin, et al. "From simultaneous to synergistic MR‐PET brain imaging: A review of hybrid MR‐PET imaging methodologies." Human brain mapping 39.12 (2018): 5126-5144.
[3] Rischka, Lucas, et al. "Reduced task durations in functional PET imaging with [18F] FDG approaching that of functional MRI." NeuroImage 181 (2018): 323-330.
[4] Jamadar, Sharna D., et al. "Simultaneous task-based BOLD-fMRI and [18-F] FDG functional PET for measurement of neuronal metabolism in the human visual cortex." NeuroImage 189 (2019): 258-266.
[5] Li, Shenpeng, et al. "Analysis of continuous infusion functional PET (fPET) in the human brain." bioRxiv (2019): 778357.
[6] Mehranian, Abolfazl, et al. "PET image reconstruction using multi-parametric anato-functional priors." Physics in Medicine & Biology 62.15 (2017): 5975.
[7] Sudarshan, Viswanath P., Zhaolin Chen, and Suyash P. Awate. "Joint PET+ MRI patch-based dictionary for Bayesian random field PET reconstruction." International Conference on Medical Image Computing and Computer-Assisted Intervention. Springer, Cham, 2018.
[8] Kim, Kyungsang, et al. "Penalized PET reconstruction using deep learning prior and local linear fitting." IEEE transactions on medical imaging 37.6 (2018): 1478-1487.
[9] Schramm, Georg, et al. "Evaluation of parallel level sets and Bowsher’s method as segmentation-free anatomical priors for time-of-flight PET reconstruction." IEEE transactions on medical imaging 37.2 (2017): 590-603.
[10] Hyvarinen, Aapo. "Fast ICA for noisy data using Gaussian moments." ISCAS'99. Proceedings of the 1999 IEEE International Symposium on Circuits and Systems VLSI (Cat. No. 99CH36349). Vol. 5. IEEE, 1999.
Figures