0635
Label-free Tracking of Transplanted Mesenchymal Stem Cells Using manCEST MRI
Yue Yuan1, Congxiao Wang1, Jia Zhang1, and Jeff W.M. Bulte1
1The Russell H. Morgan Department of Radiology and Radiological Science, The Johns Hopkins University School of Medicine, Baltimore, Maryland, USA., Baltimore, MD, United States
1The Russell H. Morgan Department of Radiology and Radiological Science, The Johns Hopkins University School of Medicine, Baltimore, Maryland, USA., Baltimore, MD, United States
Synopsis
Human mesenchymal stem cells (hMSCs) overexpress high-mannose-type (HM) N-glycans on their membrane surface. Taking advantage of the five exchangeable hydroxyl groups on mannose that provide CEST MRI contrast, we present a label-free method for tracking hMSCs in vivo. The mannose-sensitive CEST (manCEST) signal of hMSCs was clearly distinguishable from the surrounding host tissue and stood out against several other transplanted cell lines tested.
Introduction
Compared to most normal cells and cancer cells, high-mannose-type (HM) N-glycans are enriched in human embryonic and mesenchymal stem cells (MSCs)1. Due to the presence of five exchangeable hydroxyl groups on mannose, we hypothesized that MSCs transplanted in the brain may exhibit an enhanced, mannose-sensitive (man)CEST MRI signal compared to surrounding host cells. This would allow non-invasive tracking of stem cells in a “label-free” manner, avoiding three major issues with tracking of “labeled” cells: 1) Potential adverse effects of label on cell survival or function; 2) Limitations of long-term cell tracking due to cell division and dilution of label; and 3) Need for regulatory approval of label for clinical use and associated cost of GMP production.Methods
In vitro studies: Galanthus nivalis lectin (GNL) was used as a mannose-specific lectin2 to assess mannose expression on four cell lines: human MSCs (hMSCs), human astrocytes (hAstros), human glial-restricted progenitor cells (hGRPs), and normal human prostate cells (RWPE1). Cells were incubated with 20 µg/mL fluorescein (FITC)-GNL (FL-1241, Vector) at 4°C for 30 min. FACS analysis was performed using a Becton Dickinson LSR II flow cytometer. In vivo studies: 6 to 8-weeks old female immunodeficient rag2−/− mice were anesthetized with isoflurane and placed on a stereotactic frame (BENCHmarkTM) with a burr hole drilled 0 mm caudal and 2 mm lateral to bregma. Using a Hamilton syringe, 2 μL of unlabeled cell suspension (1.5×10⁸ cells per mL in PBS) was injected into the striatum 3 mm at a rate of 0.2 μL/min. CEST MRI was performed 1 day after cell transplantation using an 11.7 T Bruker horizontal bore scanner. A modified RARE sequence (TR/TE=5,500/3.7 ms, RARE factor=16, 1 mm slice thickness, FOV=1.6×1.5 cm, matrix size=96×64, resolution=0.17×0.23, NA=2 and a saturation pulse B1=2.4 µT) was used. Images were obtained with saturation frequencies from -5 ppm to +5 ppm.Results
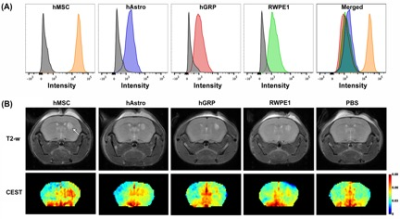
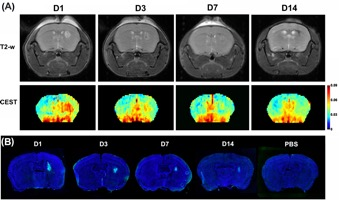
Flow cytometry analysis of FITC-GNL-labeled and unlabeled cells are shown in Fig. 1A. The highest mannose expression was found in hMSCs. One day after cell transplantation, hMSCs exhibited an in vivo CEST signal that was >2-fold higher than the mice transplanted with the other three cell lines (Fig. 1B). Serial CEST MRI was obtained over 14 days to track the transplantation of hMSCs in mice brain. As can be seen in Fig. 2A, the manCEST contrast of transplanted hMSCs reduced gradually from day 1 to day 14, which was validated with fluorescein-labeled GNL staining (Fig. 2B).Conclusion
On the basis of the high abundance of high mannose (HM) N-glycans on hMSCs, we developed manCEST MRI as a novel mannose-sensitive technique for in vivo imaging of transplanted hMSCs. To the best of our knowledge, this is the first cell tracking study that uses native, unlabeled cells, without the need of any cellular modification or manipulation. While this new concept is still in its developmental proof-of-principle stage, we anticipate our label-free approach to be easily translatable for clinical stem cell therapy.Acknowledgements
This project was supported by the Pearl and Yueh-Heng Yang Foundation.References
1. Heiskanen, A. et al. Glycoconjugate J. 26, 367-384 (2009).
2. Hoorelbeke, B. et al. Retrovirology 8, 10 (2011).
Figures

Figure
1. (A) Flow
cytometry of FITC-GNL-labeled cells (colored curves) and unlabeled cells (gray
curves). Merged flow diagram on the rights shows a comparison of the different
mannose expression levels, with hMSCs having the highest mannose content. (B) In vivo T2-weighted and
manCEST MRI 1 day after
cell transplantation in the right striatum (arrow top left panel). Right panel
shows PBS injection as control group. CEST MR images are shown for 1.0 ppm,
i.e., the saturation-selective frequency of the five hydroxyl groups on each
mannose molecule.

Figure
2. (A) Longitudinal T2-weighted and manCEST MRI of immunodeficient rag2−/− mice
after hMSC transplantation. (B) Fluorescein
labeled GNL-staining of brain tissue sections from mice transplanted with
hMSCs, sacrificed at different time points corresponding with the time frame of
imaging.