0633
Assessing tumor cell death in vivo using 2H-labeled fumarate and deuterium magnetic resonance spectroscopic imaging
Friederike Hesse1, Vencel Somai1,2, Flaviu Bulat1, Felix Kreis1, and Kevin Brindle1,3
1Cancer Research UK Cambridge Institute, Cambridge, United Kingdom, 2Department of Radiology, University of Cambridge, Cambridge, United Kingdom, 3Department of Biochemistry, University of Cambridge, Cambridge, United Kingdom
1Cancer Research UK Cambridge Institute, Cambridge, United Kingdom, 2Department of Radiology, University of Cambridge, Cambridge, United Kingdom, 3Department of Biochemistry, University of Cambridge, Cambridge, United Kingdom
Synopsis
Monitoring tumor responses to treatment using metabolic imaging can give an early indication of outcome. We show here that Deuterium Metabolic Imaging (DMI) with 2H-labelled fumarate can be used to detect early evidence of cell death following drug treatment in a pre-clinical murine lymphoma model. 2H spectra were acquired from tumors with a time resolution of 5 min, following a bolus injection of 2H-labelled fumarate. Within 48 h of etoposide treatment the rate of tumor malate production from the labelled fumarate increased significantly. Increased levels of labelled malate were also evident in spectroscopic images of the tumors.
Introduction
Cell death is an important imaging target for assessing early tumor treatment response and the effectiveness of therapy. The degree of tumor cell death can be a predictive indicator of patient outcome. Traditionally, imaging modalities available in the clinic, such as CT, PET-CT and MRI have focused on detecting late changes in tumor size rather than evaluating early changes in tumor physiology or metabolism. Here we investigated whether fast deuterium MRI can be used to detect cell death and assess early tumor treatment response using a new imaging biomarker, 2H-fumarate. Fumarate is hydrated in a reaction catalyzed by the enzyme fumarase to produce malate1. Loss of plasma membrane integrity during cell necrosis results in fumarate rapidly gaining access to the enzyme and an increased rate of malate production2. Previously this has been assessed in vivo by using 13C magnetic resonance spectroscopic imaging to measure the rate of tumor malate production following intravenous injection of hyperpolarized[1,4-13C]fumarate3.Methods and materials
EL4 lymphoma-bearing mice were imaged using a fast 3D deuterium MRI pulse sequence with a time resolution of 5 minutes, and a spatial resolution of 3 x 3 x 9 mm, following a bolus injection of [2,3-2H2] fumarate, before and 48 h after treatment with a chemotherapeutic drug (etoposide at 67 mg/kg). Experiments on EL4 cells in vitro were conducted on a 14.1 T high-resolution NMR spectrometer and experiments on tumors in vivo using a 7.0 T horizontal bore magnet.Results
As early as one minute after 2H-fumarate addition, etoposide-treated EL4 cells showed malate production, which was greater than that in untreated controls (Figure 1). A fast, chemical shift imaging sequence was used to assess conversion of [2,3-2H2]fumarate to [2,3-2H2]malate in implanted EL4 tumors in vivo following a bolus injection of labelled fumarate (1g/kg) to tumor-bearing mice. Within 48 h of drug treatment the malate/fumarate ratio increased significantly from 0.034 ±0.06 to 0.33 ±0.11 (p=0.04, n=3).Discussion
Deuterium metabolic imaging (DMI) with [2,3-2H2]fumarate has great potential for quantitative assessment of tumor cell death in vivo. Compared to hyperpolarized 13C-labeled substrates, 2H-labeled metabolites are relatively easy to synthesize and at lower cost. However, image acquisition times are longer, and resolution is lower. Nevertheless, the first 2H MR experiments in a clinical setting have been conducted recently following oral administration of [6,6-2H2] glucose to glioma patients to investigate tumor glycolytic and TCA cycle activities.4Conclusion
Tumor malate production from [2,3-2H2]fumarate increased significantly within 48 h of drug treatment, demonstrating the potential of DMI for assessing tumor cell death and the early responses of tumors to treatment.Acknowledgements
No acknowledgement found.References
- Clatworthy, M. & Kettunen, M. Magnetic resonance imaging with hyperpolarized fumarate allows detection of early renal acute tubular necrosis. Proc. Natl. Acad. Sci.109, 13374–13379 (2012).
- Neves, A. A. & Brindle, K. M. Imaging Cell Death. J. Nucl. Med.55, 1–4 (2014).
- Gallagher, F. A. et al.Production of hyperpolarized [1,4-13C2]malate from [1,4-13C2]fumarate is a marker of cell necrosis and treatment response in tumors. Proc. Natl. Acad. Sci.106, 19801–19806 (2009).
- De Feyter, H. M. et al.Deuterium metabolic imaging (DMI) for MRI-based 3D mapping of metabolism in vivo. Sci. Adv.4, eaat7314 (2018).
Figures
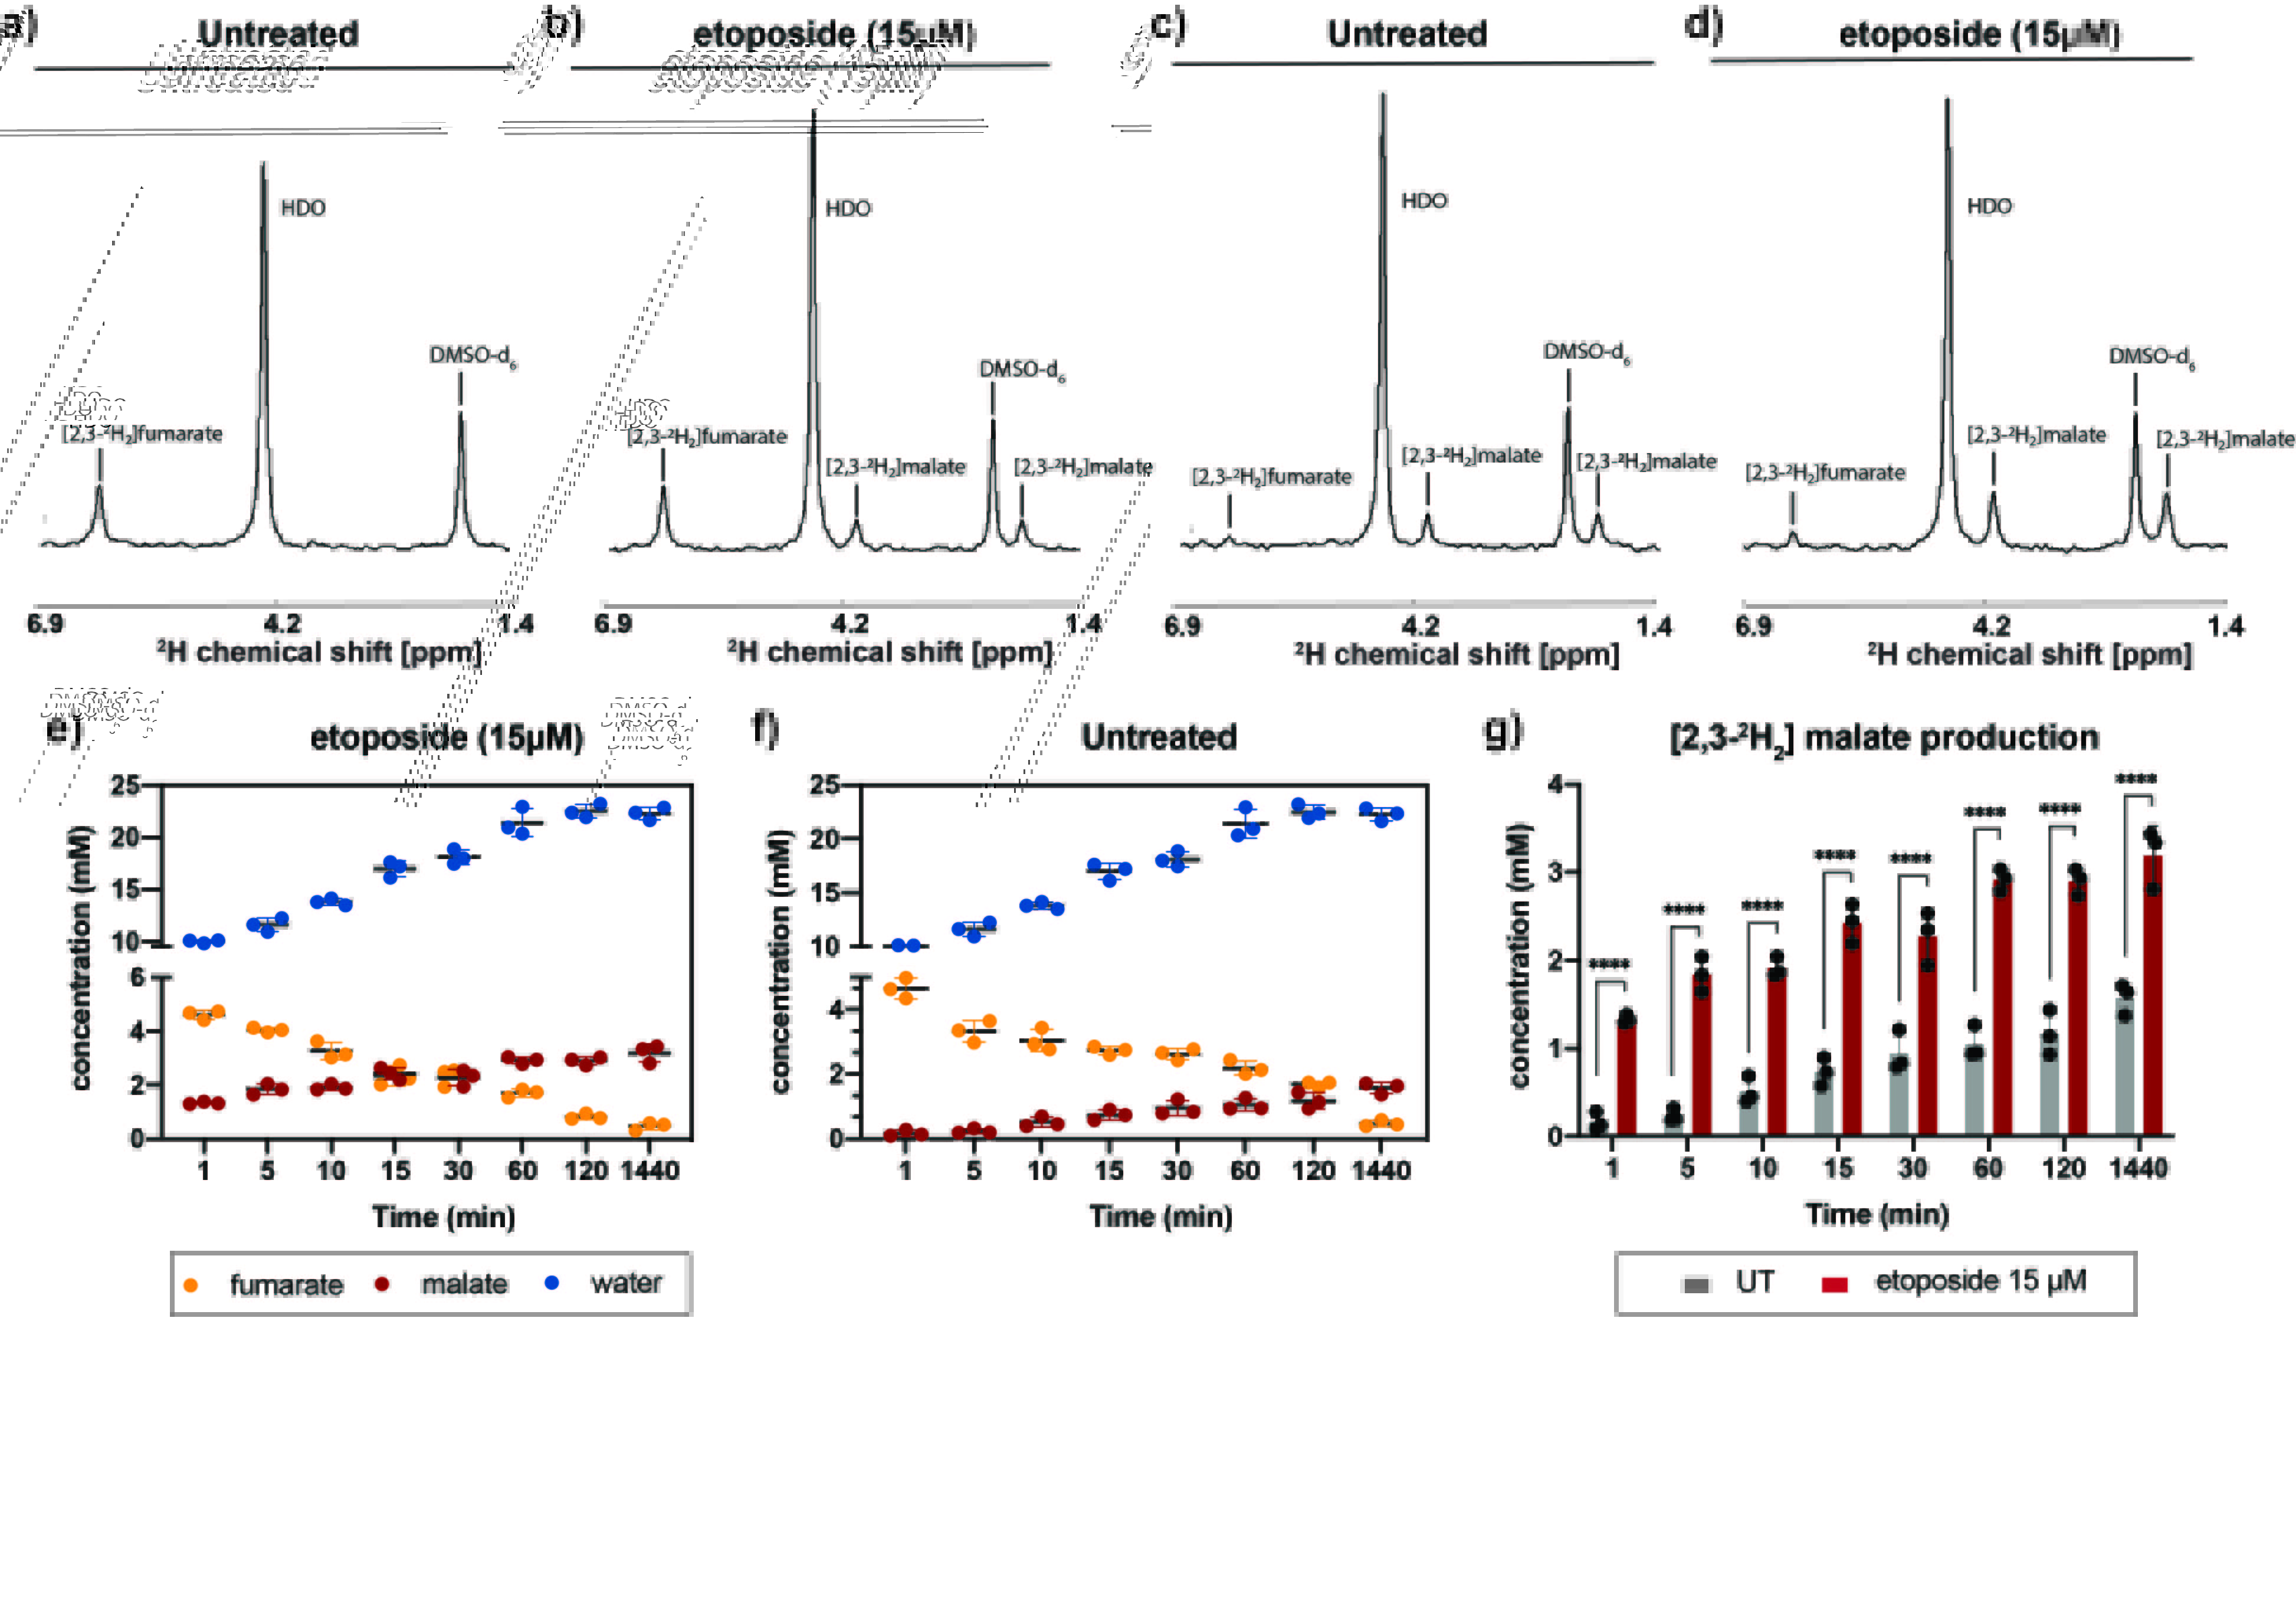
Figure 1: a-d) 2H NMR spectra of murine lymphoma (EL4) cell culture medium. a) Medium from untreated cells and b) cells treated for 24 h with etoposide, 3 minutes after the addition of fumarate. c-d) Medium from untreated cells and b) cells treated for 24 h with etoposide, 24 h after the addition of fumarate. e-f) Deuterated fumarate, malate and water concentrations in e) medium from etoposide-treated and f) untreated cells. g) Malate production in untreated and etoposide-treated EL4 cell suspensions (n=3 biological replicates). Error bars show the standard error.
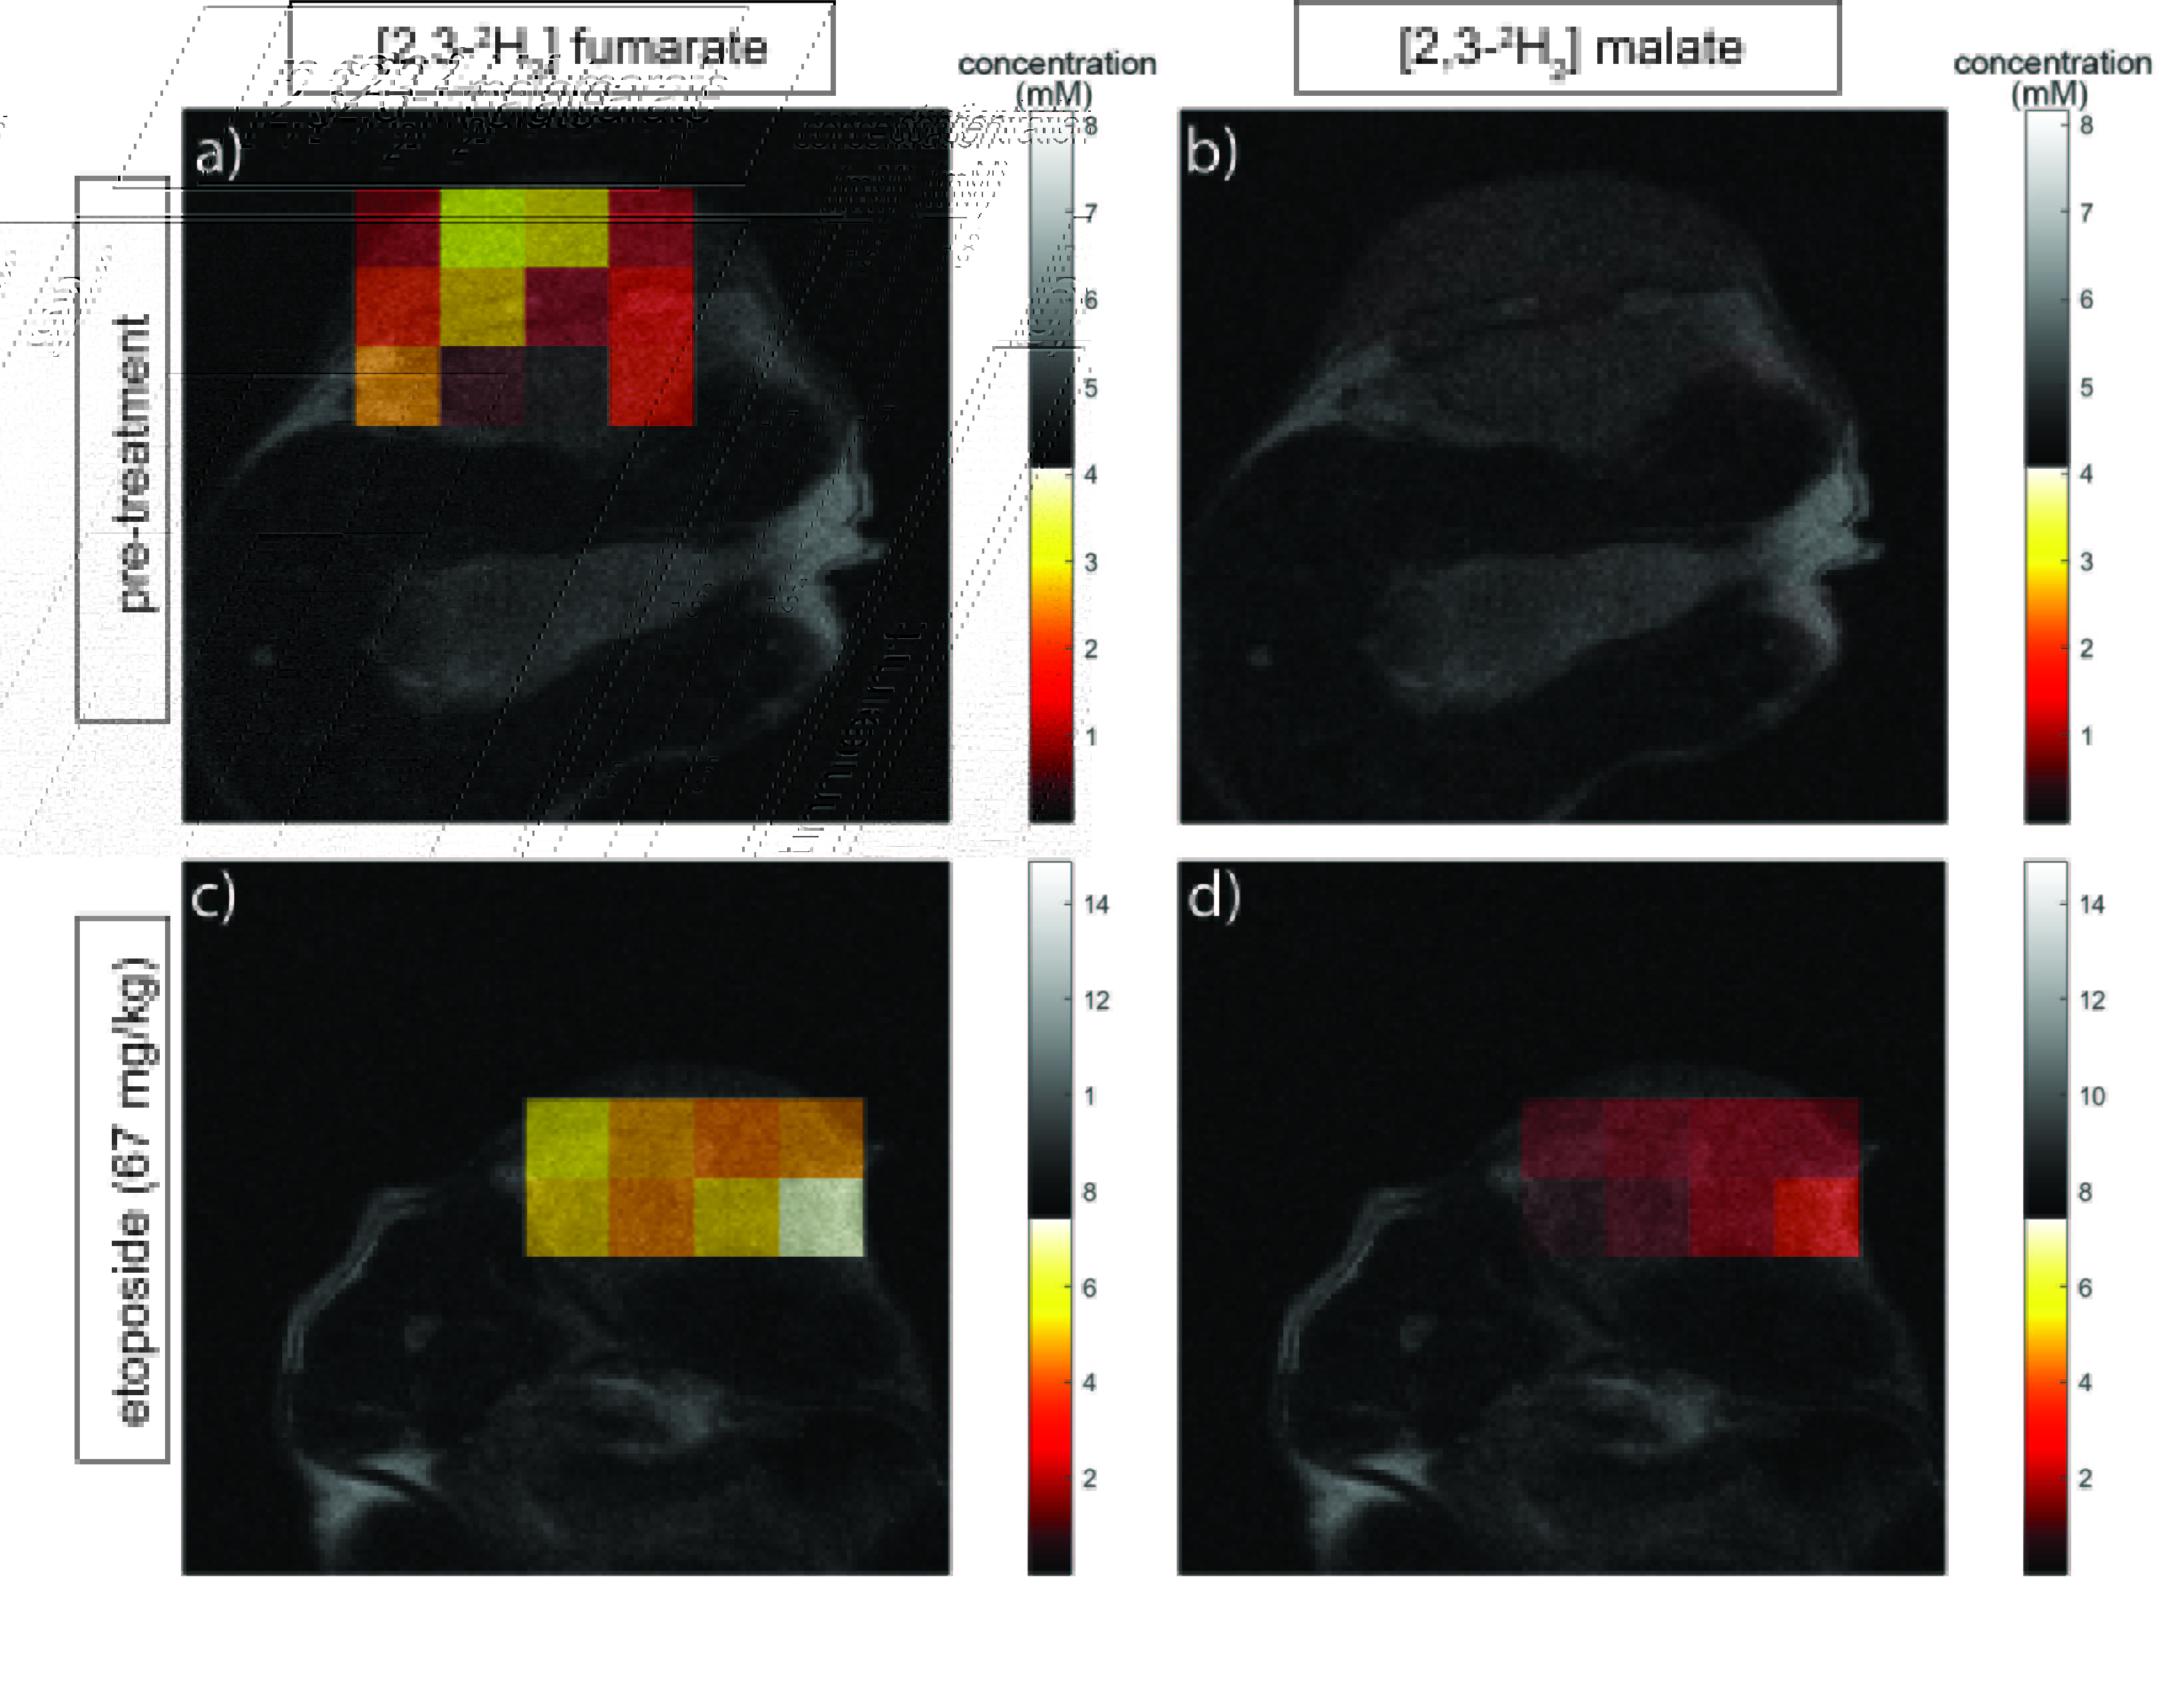
Figure 2: Metabolite concentration maps derived from summed 3D CSI images acquired over a period of 60 min following [2,3-2H2]fumarate injection into EL4 tumor-bearing mice. The color code represents concentration (in mM) derived from the ratios of the peak amplitudes in the malate and fumarate maps to peak amplitudes in an initial HDO map and corrected for the number of 2H labels per molecule and for signal saturation. Concentration maps of a) fumarate pre-treatment; b) malate pre-treatment; c) fumarate 48 h post-treatment; d) malate 48 h post-treatment.