0630
Non-invasive Detection of M1 Activation in Macrophages using Hyperpolarized 13C MRS of Pyruvate and DHA at 1.47 Tesla1Physical Therapy and Rehabilitation Science, University of California, San Francisco, San Francisco, CA, United States, 2Radiology and Biomedical Imaging, University of California, San Francisco, San Francisco, CA, United States
Synopsis
The immune system plays an essential role in various diseases, and macrophage activation patterns can vary greatly - impacting intervention. We propose that 13C Magnetic Resonance Spectroscopy (MRS) of hyperpolarized [1-13C] Pyruvate and [1-13C] Dehydroascorbic acid (DHA) can differentiate between non-activated and M1 classically activated macrophages at the clinically-relevant field strength of 1.47T. In M1-activated macrophages we report increased HP Lactate from Pyruvate, and increased HP Ascorbic Acid from DHA compared to Control cells. This study is a first in differentiating between activated and non-activated macrophages with HP probes at this field strength and could become a powerful translational tool.
Introduction
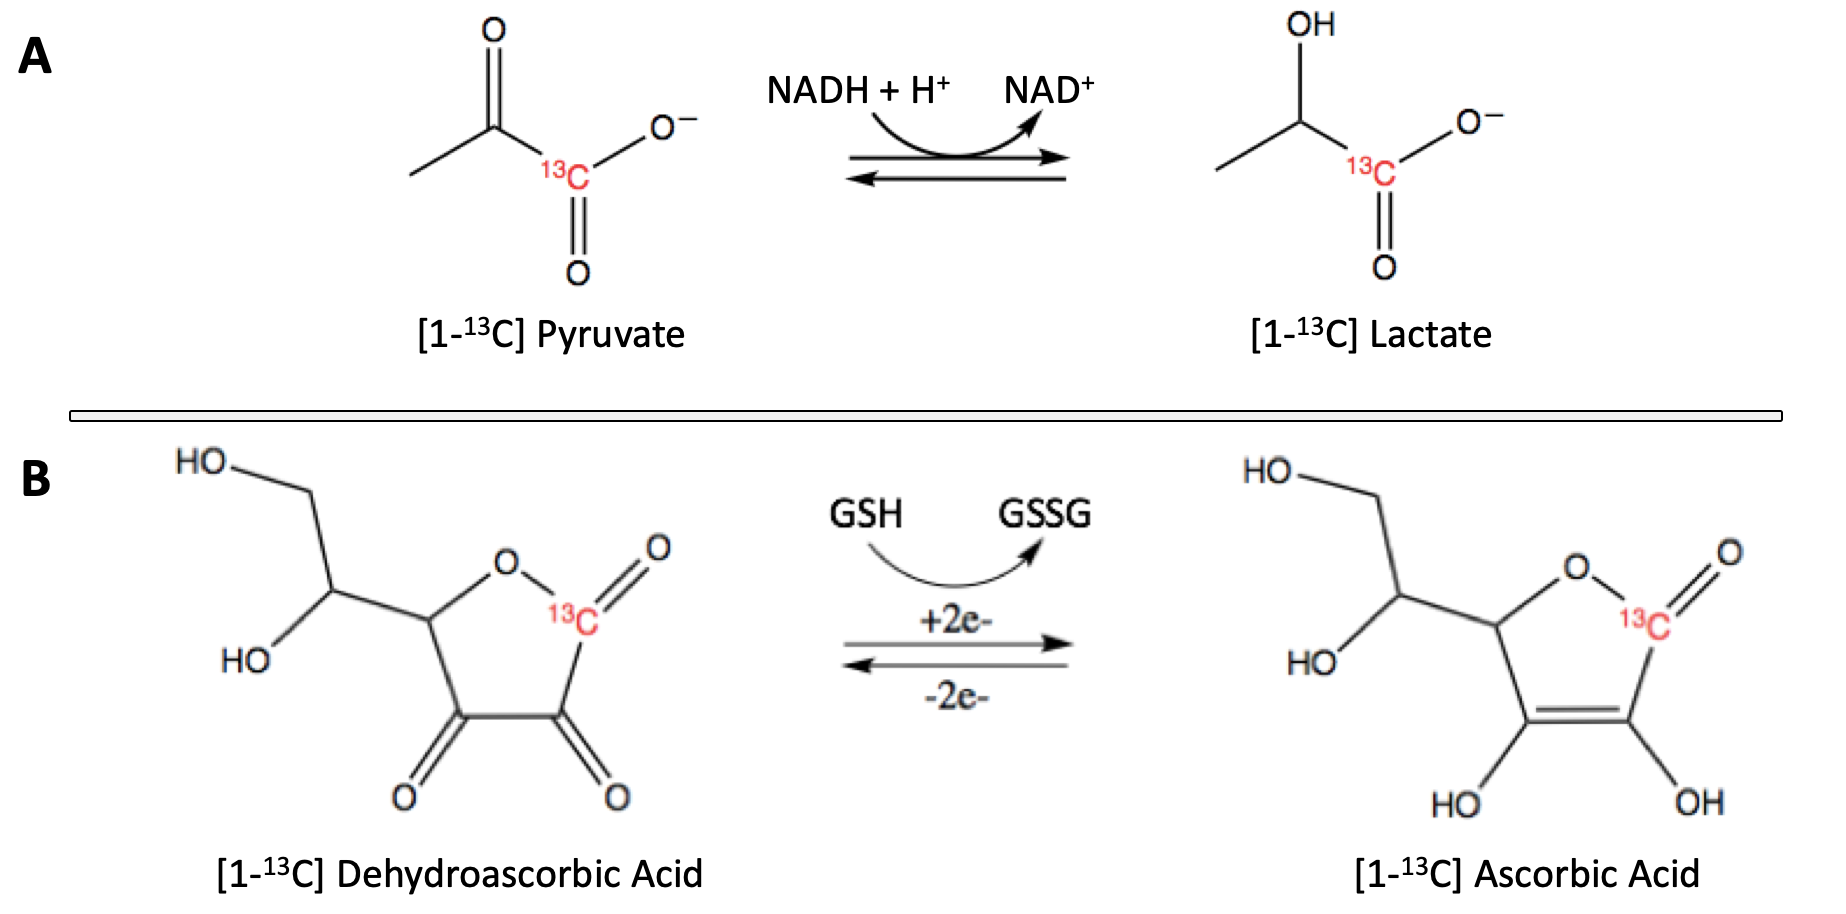
Macrophage activation is closely tied with neuroinflammation in several diseases.1 Accurate determination of macrophage activation state in vivo (pro-inflammatory M1 vs. anti-inflammatory M22) would be of high interest as it could lead to effective treatments and interventions. However, such assessment remains challenging. Importantly, upon activation, macrophages appear to undergo metabolic reprogramming, thus opening the door to using metabolic imaging strategies to monitor M1/M2 activation. Compared to quiescent macrophages, a recent study reported increased hyperpolarized (HP) [1-13C] Lactate production in M1-activated macrophages at high field strength.3 Interestingly, M1-activated macrophages also produce reactive oxygen species (ROS), increasing surrounding oxidative stress (OS).4 HP [1-13C] Dehydroascorbic acid (DHA) has been previously used to monitor OS.5,6 Here we hypothesize that 13C Magnetic Resonance Spectroscopy (MRS) of HP [1-13C] Pyruvate (Figure 1A) and [1-13C] DHA (Figure 1B) can detect M1 activation of macrophages at the clinically-relevant field strength of 1.47 Tesla.Methods
Cell Culture: J774a.1 macrophages (ATCC) were grown in DMEM containing 10% FBS and 5% Penicillin/Streptomycin (UCSF). M1 activation was achieved with 100ng/mL lipopolysaccharide (LPS) treatment for 24 hours. All passages used were ~4 – 14 to reduce the risk of genetic drift.Spectrophotometric Assays: ROS levels and Lactate Dehydrogenase (LDH) enzyme activity were measured using spectrophotometric assays (Abcam and custom-made, respectively) on M1-activated cells (n = 3) and Controls (n = 3). ROS data was reported as fold-change from Control. LDH data was normalized to protein concentration quantified by Bradford assay (Thermofisher).
MR Acquisitions: 24uL of [1-13C] Pyruvate (15M) or 25uL of [1-13C] DHA (2.2M) was polarized for 1h on a Hypersense dDNP polarizer (Oxford Instruments), then dissolved in 4.5mL or 3.5mL buffer to yield a final solution of 80mM or 15.72mM, respectively. Within 20s post-dissolution, approximately 400uL of HP [1-13C] Pyruvate or [1-13C] DHA was injected into a 5mm NMR tube containing a slurry of ~20 million cells in DMEM (n = 3 Control vs M1-activated for Pyruvate, and n = 4 Control vs M1-activated for DHA). Hyperpolarized spectra were then acquired on a 1.47T Oxford Pulsar NMR system using: FA = 20°, TR = 3s, total acquisition 5 minutes. Analysis was performed with Mestrenova (Mestrelab) software on the summed spectra. Signal to noise ratios (SNR) were calculated for probes and products. Data are reported as mean ± standard deviation, and are normalized to cell number and final height of injection.
High resolution 1H NMR of Extracts: M1-activated (n = 2) and Control (n = 2) J774a.1 metabolites were extracted using methanol/chloroform. The resultant extracts were reconstituted in 400uL D2O and scanned on an 800Mhz NMR system (Bruker) with a 1D NOESY sequence and NS = 384. Analysis was performed with Mestrenova, and reported as mean ± standard deviation normalized to cell number and TSP.
Statistical analyses: HP SNR data were tested with a paired t-test between M1-activated and non-activated n pairs. ROS and LDH assays were tested with unpaired t-tests. All tests were performed with Prism 8 (GraphPad).
Results
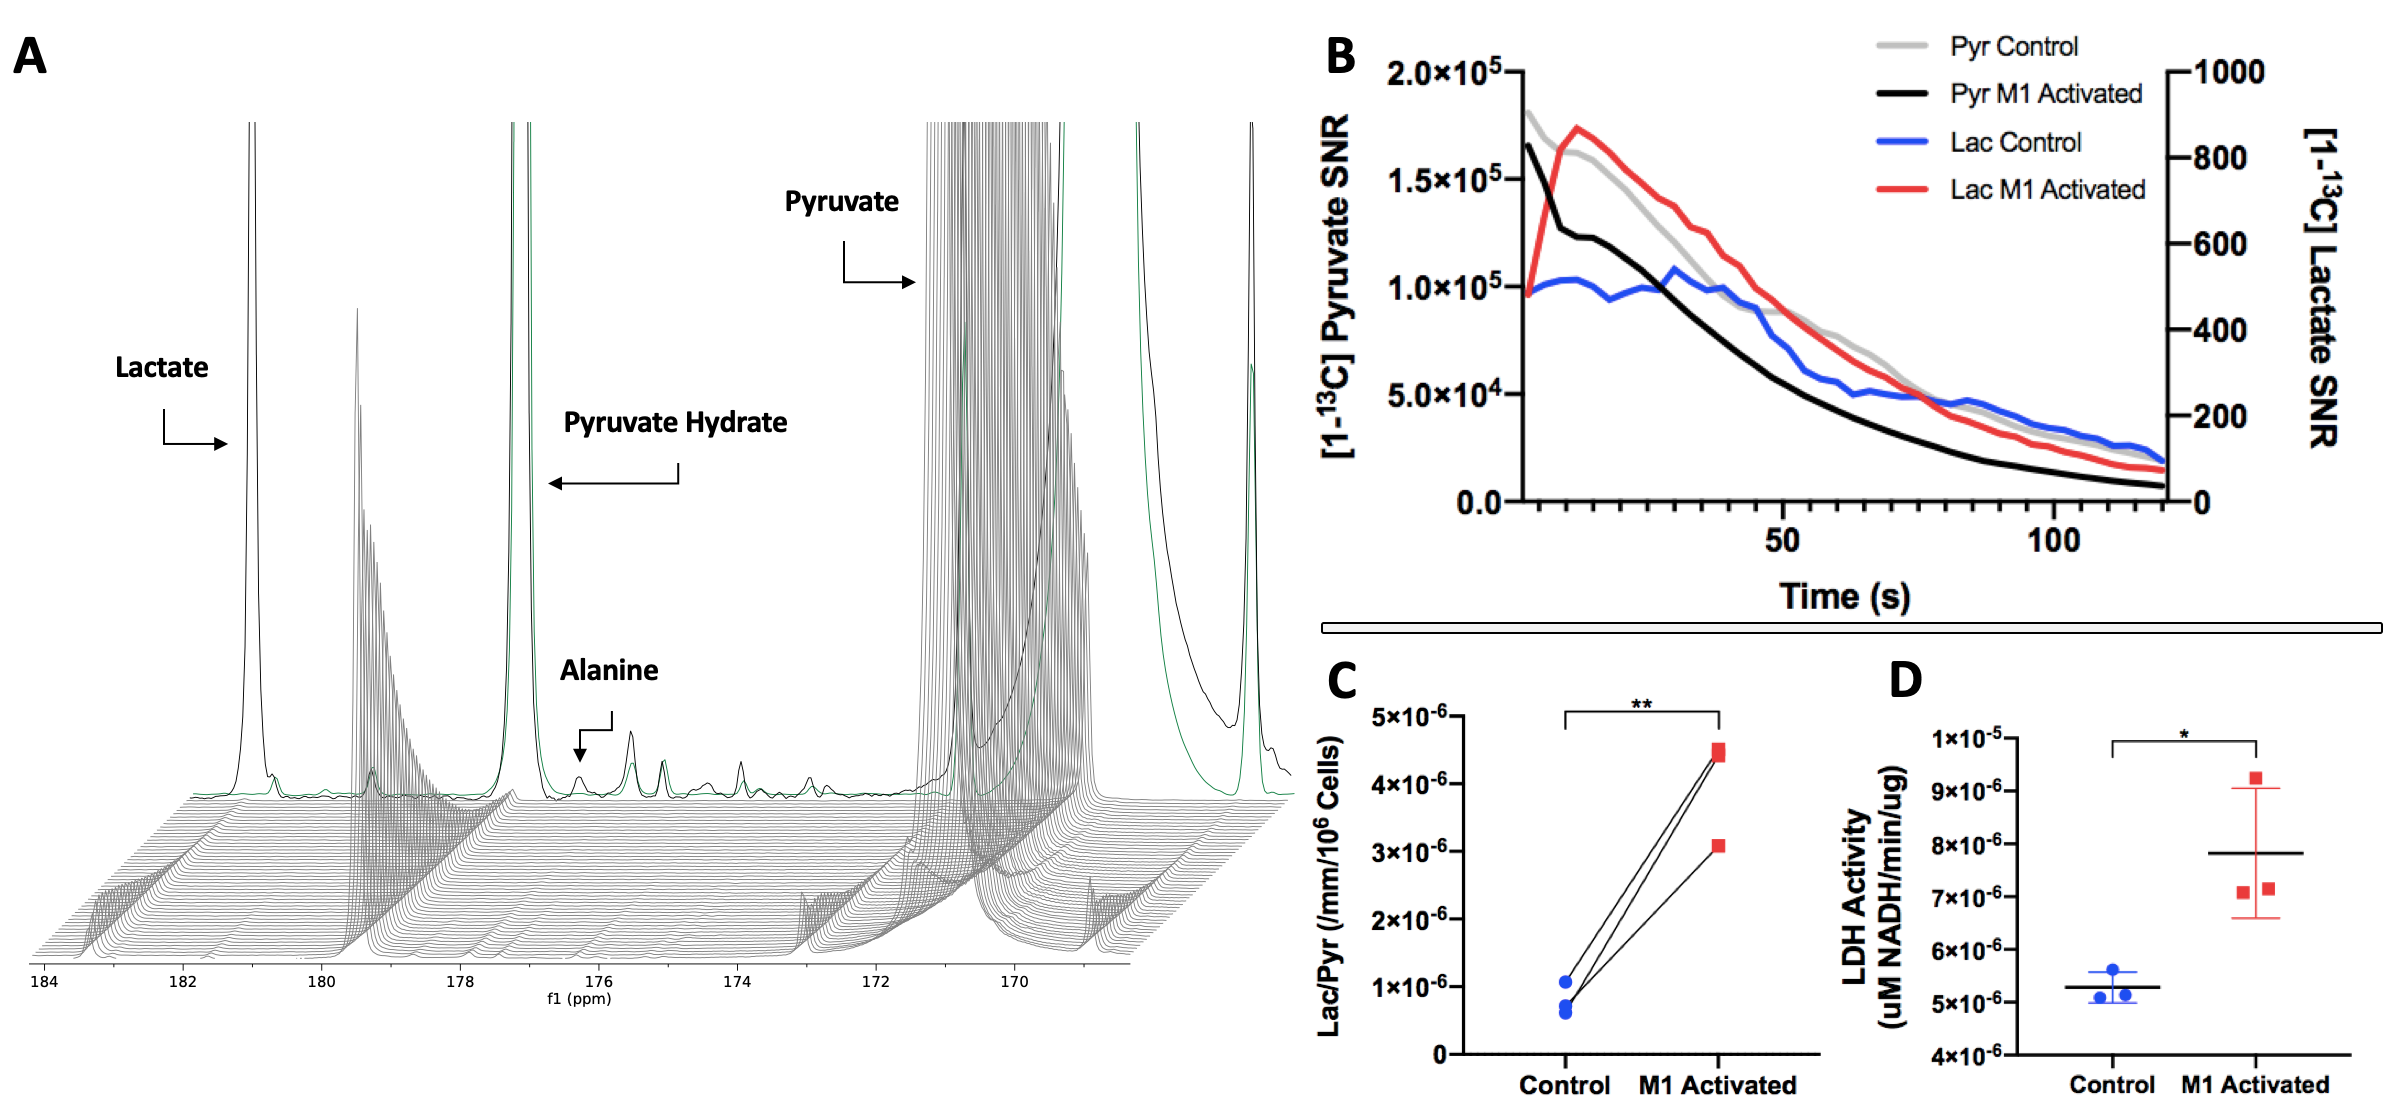
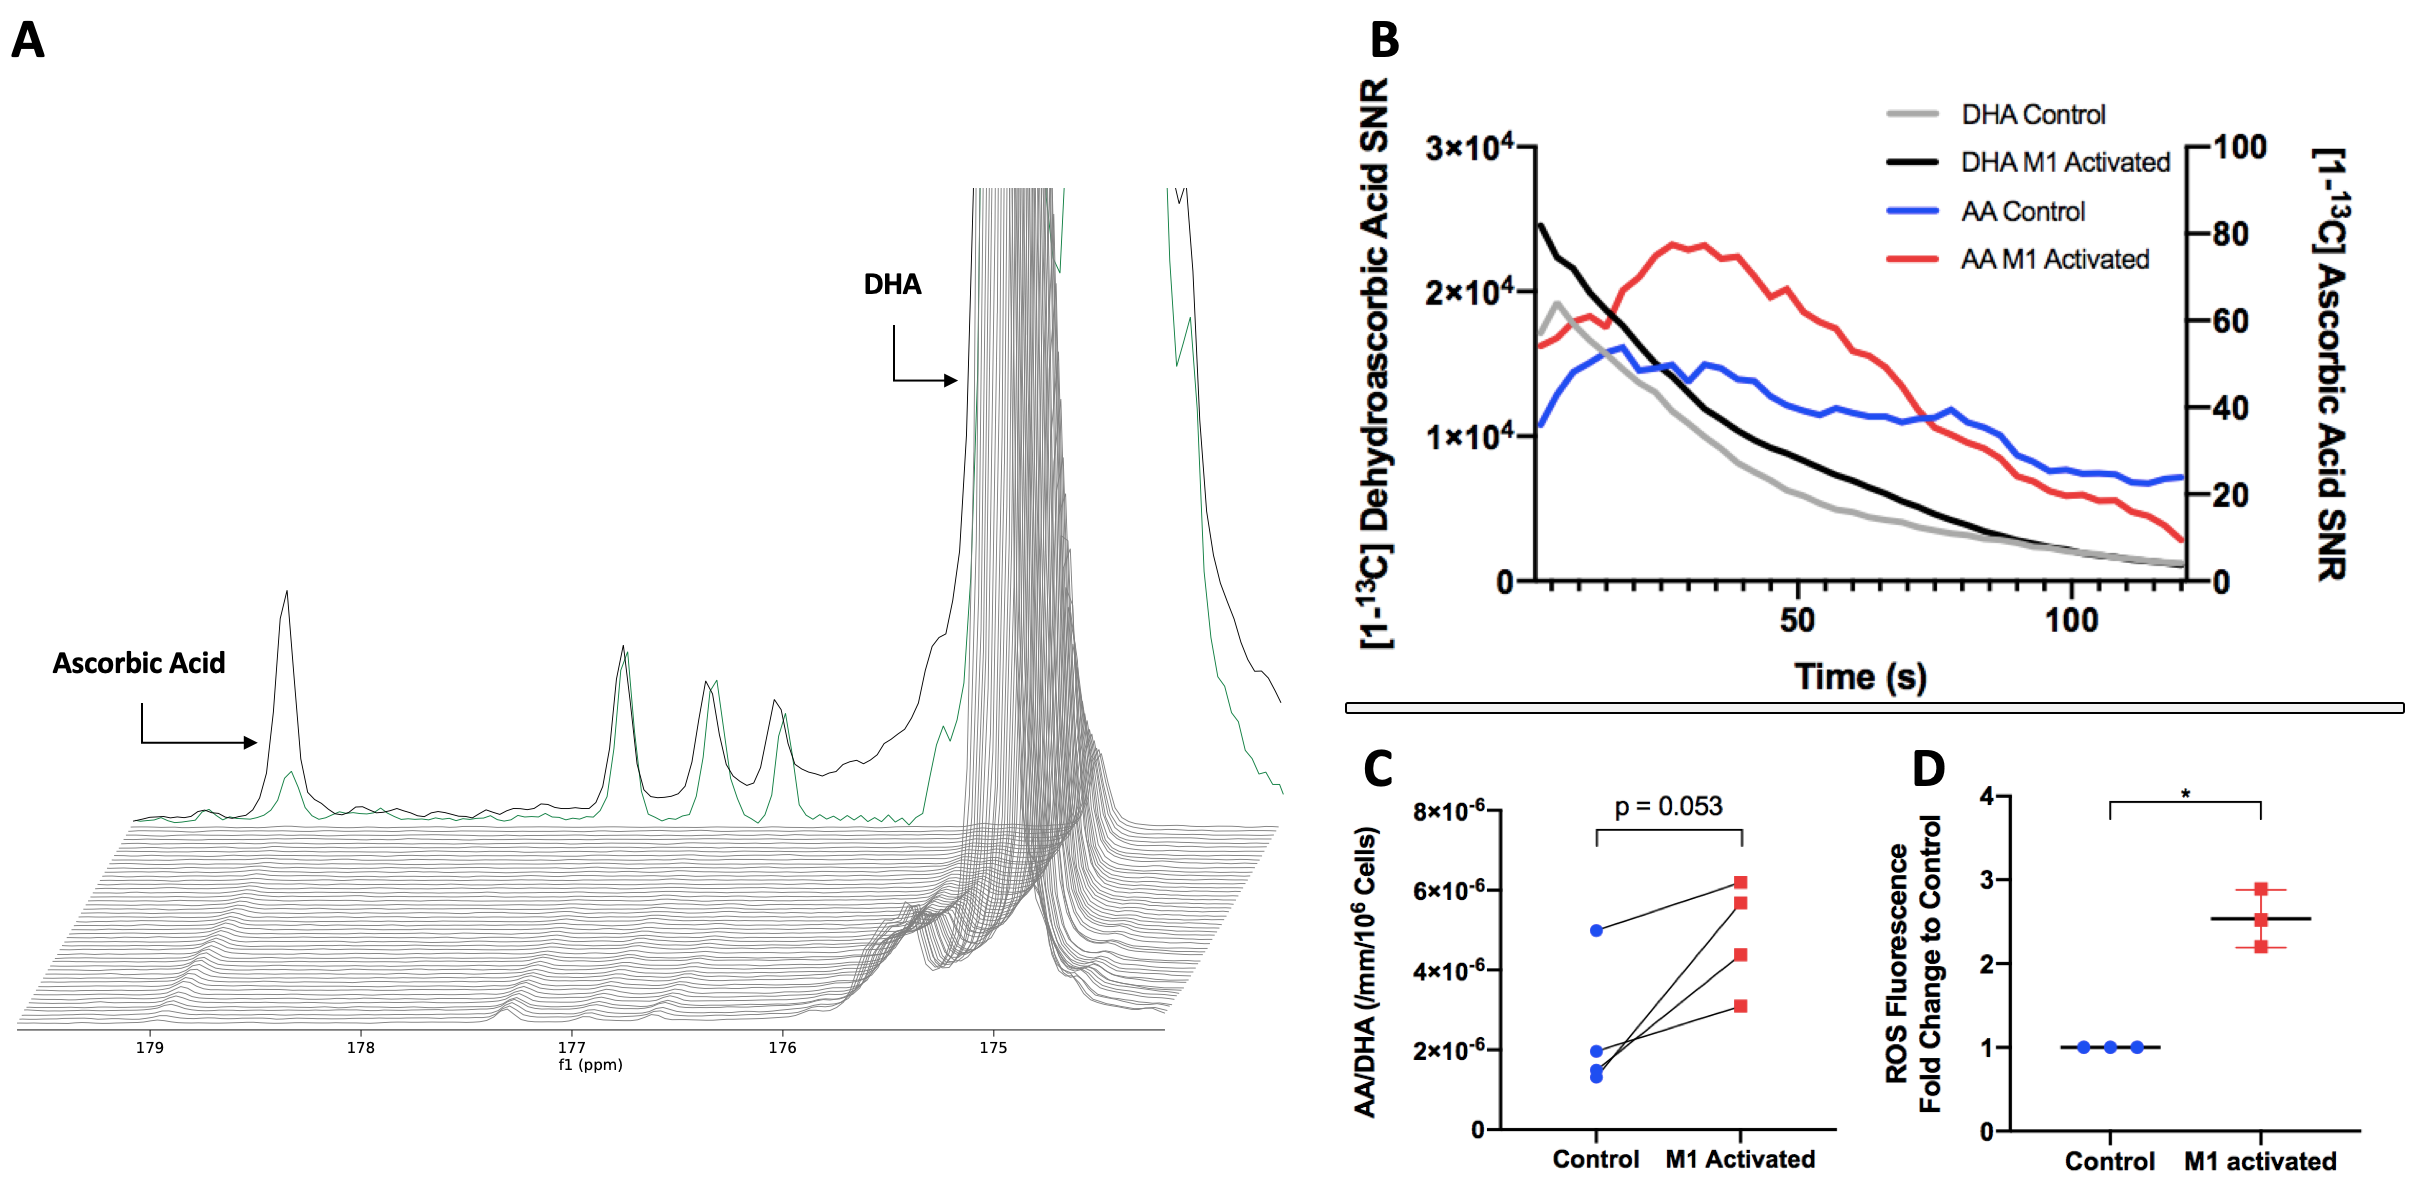
Upon injection of HP [1-13C] Pyruvate to M1-activated and Control macrophages, HP [1-13C] Lactate production could be detected at 183.3ppm, with Pyruvate shown at 171.1ppm (Figure 2A). The buildup of Lactate is observed as Pyruvate signal decays (Figure 2B). Upon quantification, our results show that HP Lactate-to-Pyruvate ratio was increased by 401% with M1 activation (p=0.018, 4.00x10⁻⁶ for M1-activated cells vs. 7.99x10⁻⁷ for Control cells) (Figure 2C). Interestingly, the increase in HP Lactate-to-Pyruvate ratio was associated with an 48% increase in LDH enzyme activity (p=0.025, 7.82x10⁻⁶ µM NADH/min/µg for M1-activated vs. 5.28x10⁻⁶ µM NADH/min/µg for Controls) (Figure 2D).Upon injection of HP [1-13C] DHA, HP [1-13C] Ascorbic Acid (AA) production could be detected at 178.8ppm in M1-activated and Control macrophages, with DHA at 175ppm (Figure 3A). AA signal gradually builds up as the signal from DHA decays (Figure 3B). Upon quantification, our results show that the AA/DHA SNR was unexpectedly increased by 98% in M1-activated cells compared to Control (p=0.053, 4.84x10⁻⁶ in M1-activated vs. 2.44x10⁻⁶ in Control) (Figure 3C). M1-activated macrophages also exhibited a 2.5-fold increase in ROS compared to Control, in line with their activation state (p=0.016) (Figure 3D).
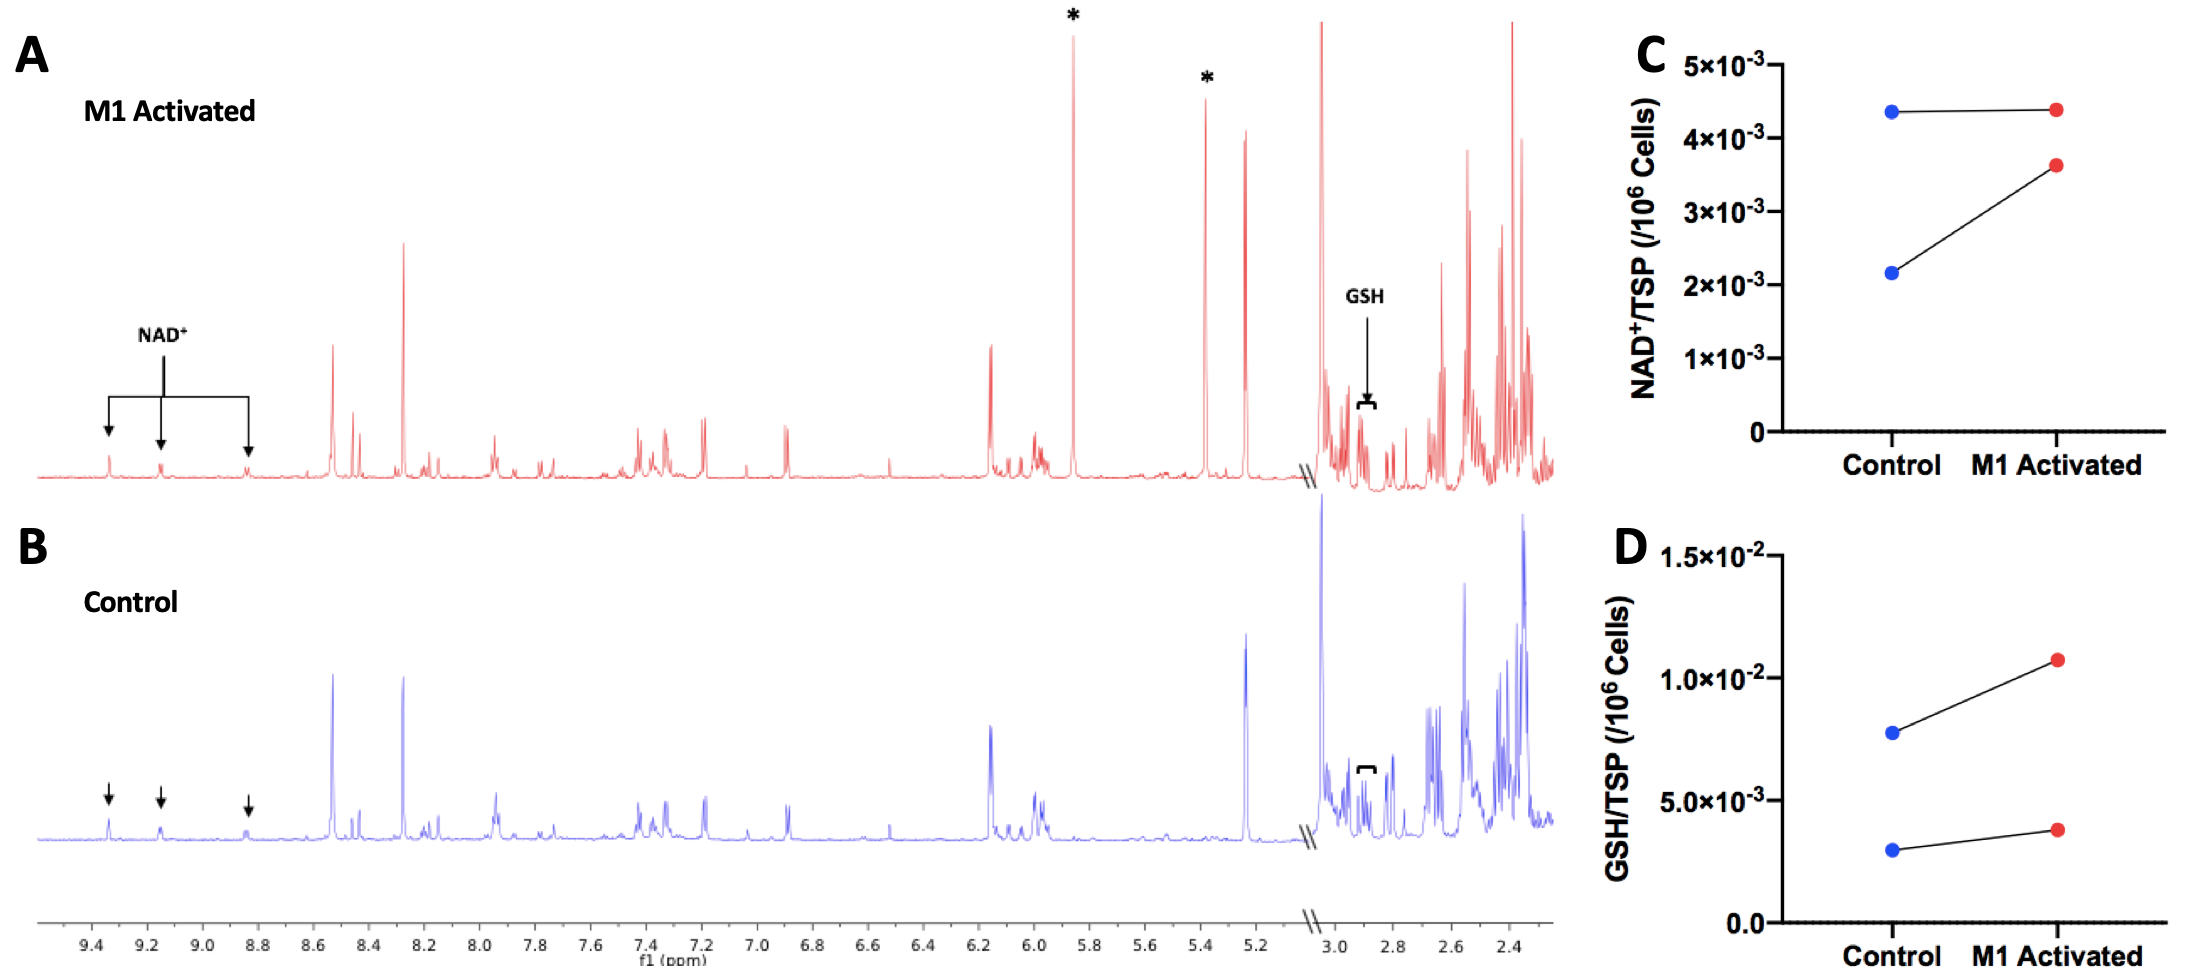
On 1H NMR of extracts, NAD+ and GSH resonances could be observed in M1-activated (Figure 4A) and Control macrophages (Figure 4B). Itaconate resonances at 5.35ppm and 5.82ppm confirmed M1-activation by LPS. There was no significant difference in NAD+ levels between groups (Figure 4C), though GSH levels exhibited an increasing trend for activated macrophages compared to Control (Figure 4D). The increased GSH seen in this n = 2 preliminary data may explain the observed increase in DHA to AA conversion, but will need to be investigated further.
Conclusions
This study demonstrates the potential of 13C MRS of HP [1-13C] Pyruvate and HP [1-13C] DHA to differentiate between M1-activated and non-activated macrophages at 1.47 Tesla. A significant increase in HP Lactate and AA production in M1-activated macrophages was successfully detected at this clinically relevant field. Future work in progress includes increasing repeats to reach a fully powered study, and investigating the mechanisms behind the observed increased in LDH and AA production in M1-activated macrophages.Acknowledgements
This work was supported by research grants: NIH R01NS102156, Cal-BRAIN 349087, NMSS research grant RG-1701-26630, Hilton Foundation – Marilyn Hilton Award for Innovation in MS Research #17319. Dana Foundation: The David Mahoney Neuroimaging program, NIH Hyperpolarized MRI Technology Resource Center #P41EB013598.References
1. National Academies of Sciences, Engineering, and Medicine. Biomarkers of Neuroinflammation: Proceedings of a Workshop. National Academies Press, 2017; 4.
2. Martinez F.O., GordonS. The M1 and M2 Paradigm of Macrophage Activation: Time for Reassessment. F1000Prime Rep., 2014; 6: 13.
3. Sriram R., Nguyen J., Santos J., et al. Molecular Detection of Inflammation in Cell Models using Hyperpolarized 13C-pyruvate. Theranostics. 2018; 8(12): 3400-3407.
4. Rendra E., Riabov V., Mossel D.M., et al. Reactice Oxygen Species (ROS) in Macrophage Activation and Function in Diabetes. Immunobiology, 2019; 224(2): 242-253.
5. Keshari K.R., Kurhanewicz J., Bok R., et al. Hyperpolarized 13C Dehydroascorbate as an Endogenous Redox Sensor for in Vivo Metabolic Imaging. Proc Natl Acad Sci USA, 2011; 108(46): 18606-18611.
6. Bohndiek S.E., Kettunen M.I., Hu D., et al. Hyperpolarized [1-13C]-Ascorbic and Dehydroascorbic Acid: Vitamin C as a Probe for Imaging Redox Status in Vivo. Journal of the American Chemical Society, 2011; 133(30): 11795-11801.
Figures