0629
MRI Investigation of Adoptive T Cell Transfer and Microbleeds during Vesicular Stomatitis Virus Infection of the Brain1National Institute of Neurological Disorders and Stroke, National Institutes of Health, Bethesda, MD, United States
Synopsis
A method to label non-phagocytic CD8 T cells with a micron-sized iron oxide particle (MPIO) has been developed which enables MRI single cell detection. Adoptive transfer of T cells showed therapeutic effects in mice causing less bleeding after intranasal virus infection. MPIO-labeled CD8 T cells entered the brain and the combination of labeled T cells and blood made sites of microbleeds easily detectable by MRI. The ability to track individual immune cells by MRI should open new possibilities for early detection of inflammation as well as to monitor the rapidly expanding field of immune cell therapies.
Inflammatory processes influence most neurological disorders. The interactions between the immune system and the CNS and the pathways by which the immune cells infiltrate into the brain differ depending on the disorder. Immune cell infiltration into the brain can be helpful but can also be harmful. To address the questions of where and how CNS immune responses first develop, the degree of vessel damage, and the consequences of immune cell infiltration, MRI single cell tracking through the whole brain may be very useful.
Efficiently labeling non-phagocytic T cells with enough MRI contrast agent to detect single cell remains a challenge for MRI cell tracking studies. Here, we have developed a T cell labeling technique by using a micron-sized iron oxide particle (MPIO), which provides high sensitivity to MRI1,2. These labeled T cells were used to investigate CD8 T cell response after infection with the neurotrophic vesicular stomatitis virus (VSV). In particular, the relation of T cell infiltration and microbleeds caused by VSV infection were studied.
METHODS:
Bioconjugation of MPIO and OT-1 CD8 T cell labeling. We made a cationic MPIO-NH2-anti-CD3-antibody to label T cells. CD8 T cells were incubated with MPIO at the ratio of 1:5 overnight. During FACS, anti-streptavidin was used to identify the cellular location of MPIO.
Animal model and adoptive T cell transfer. For intranasal VSV infection, 20 μL containing 7x10⁴ PFU in PBS were pipetted into both nostrils. Post infection day (PID) 6 is the encephalitis peak time. 500,000-800,000 MPIO-labeled T cells were administered into mice through tail vein on PID 4 or 6. MRI studies were conducted during middle-peak stage (PID 4-6) or peak-late stage (PID 6-11).
MRI study. MRI experiments were done on an 11.7-T animal scanner. 3D gradient echo sequences were used for acquisitions. For in-vivo imaging, the following parameters were: isotropic resolution=75 μm, TE/TR=10/30 ms, FA=10°. For ex-vivo imaging: isotropic resolution=50 μm, TE/TR 20/40 ms, FA=15°.
RESULTS:
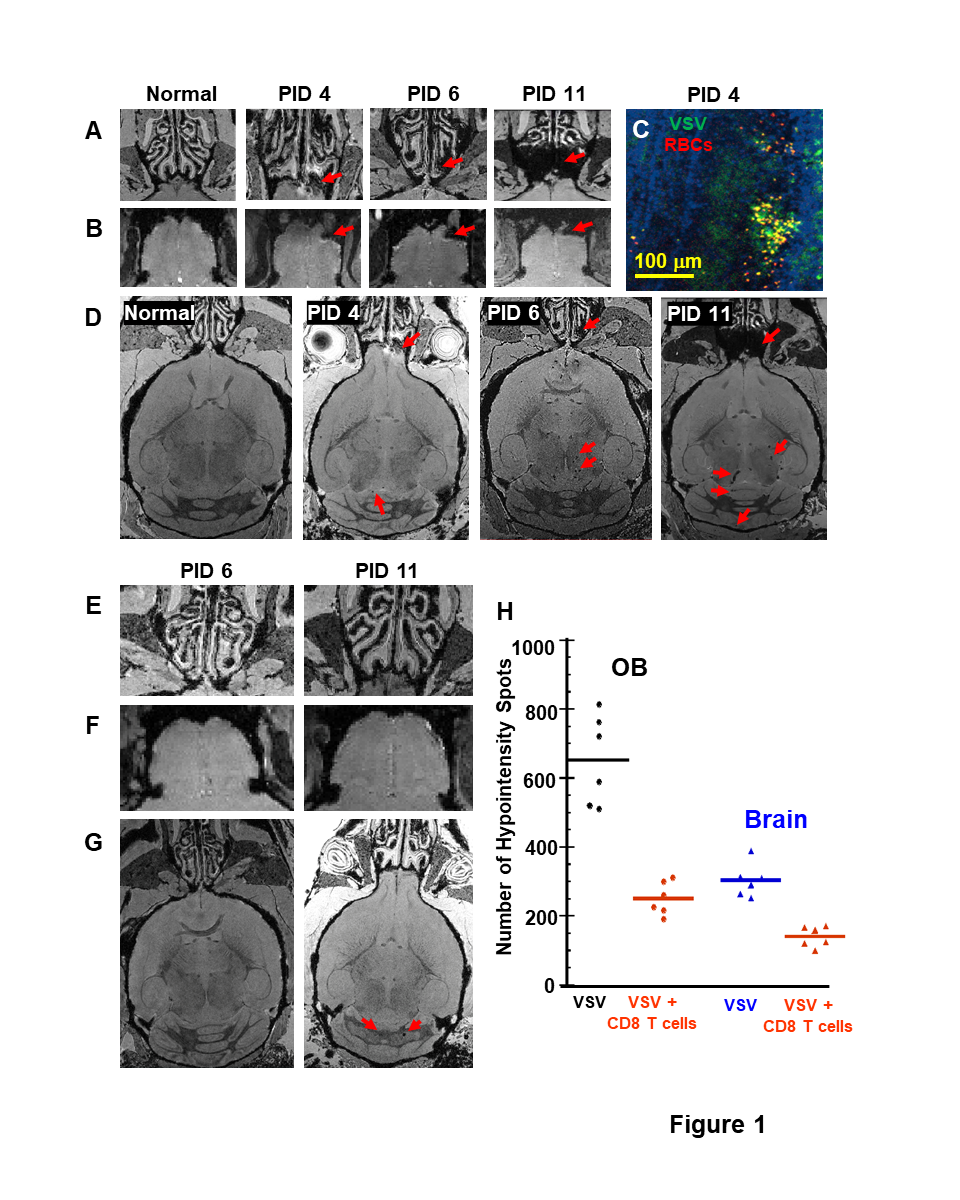
MRI detected bleeding in the turbinates (Fig 1A) and OB (Fig 1B) from PID 3-4. IHC confirmed VSV invading OB and the resulting bleeding in the glomerular layer and external plexiform layer (EPL) on PID 4 (Fig 1C). Bleeds in the midbrain and hindbrain were also detected (Fig 1D). Adoptive CD8 T cell transfer had a therapeutic effect and significantly reduced the bleeding (Fig 1E-G). Decreases of hypointensity spots in the OB and the brain upon T cell transfer on PID 11 are shown in Fig 1H.
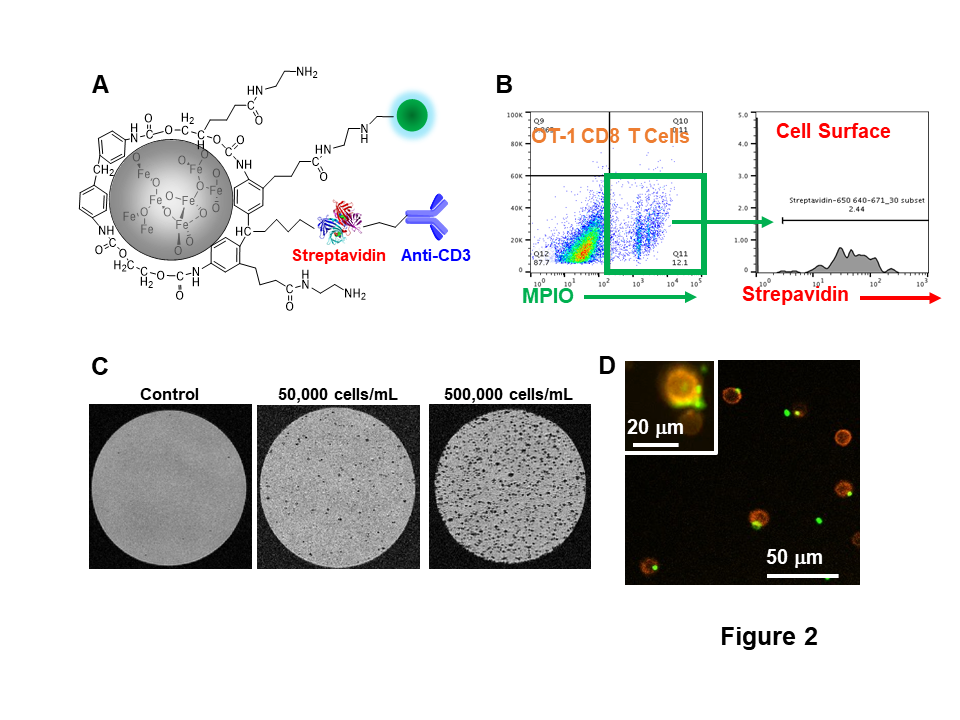
To study the CNS infiltration of CD8 T cells and its consequences during neuroinflammation, we modified MPIO particles (Fig 2A) to label T cells. As shown by flow cytometry analysis, T cell labeling efficiency is ~12% and the majority of MPIOs are localized inside the cells (Fig 2B). MPIO-labeled T cells show MR sensitivity enabling single cell detection (Fig 2C) with some T cells containing more than one MPIO (Fig 2D).
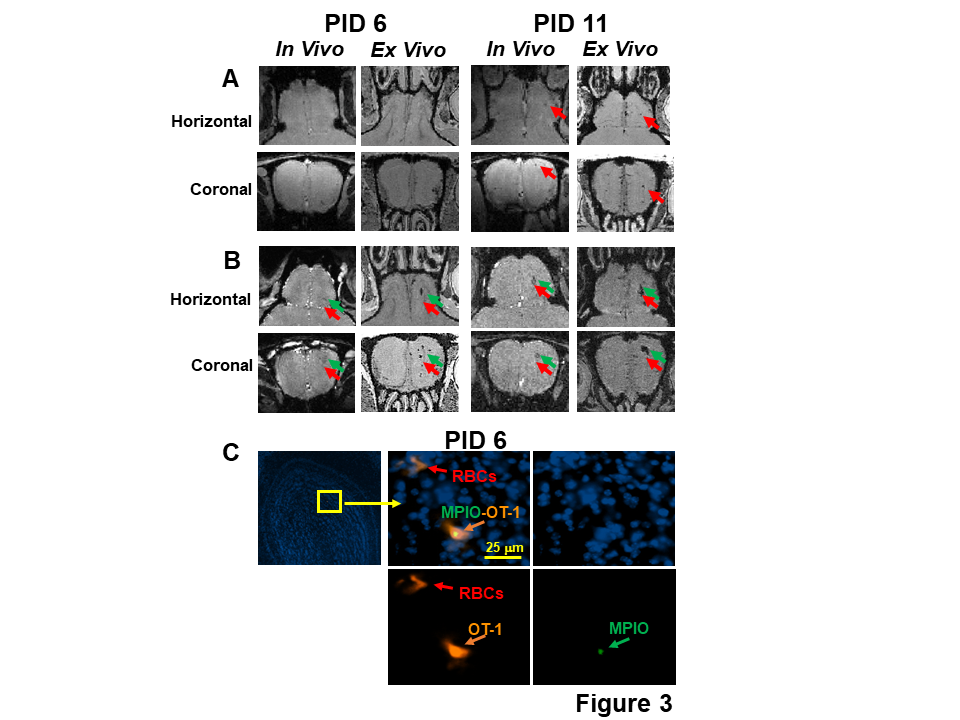
On PID 6, hypointensity spots were observed in the EPL and mitral cell layer (MCL) of the mice infused with MPIO-labeled CD8 T cells (Fig 3B), but there seemed to be much fewer in the controls infused with unlabeled CD8 T cells (Fig 3A). IHC verified that MPIO labeled-T cells were present in the MCL on PID 6. RBCs co-localized with CD8 T cells (Fig 3C). Similarly, on PID 11, significantly more hypointensity spots were observed in the EPL and MCL of the mice transferred with MPIO-labeled T cells than in the controls (Fig 3A,B).
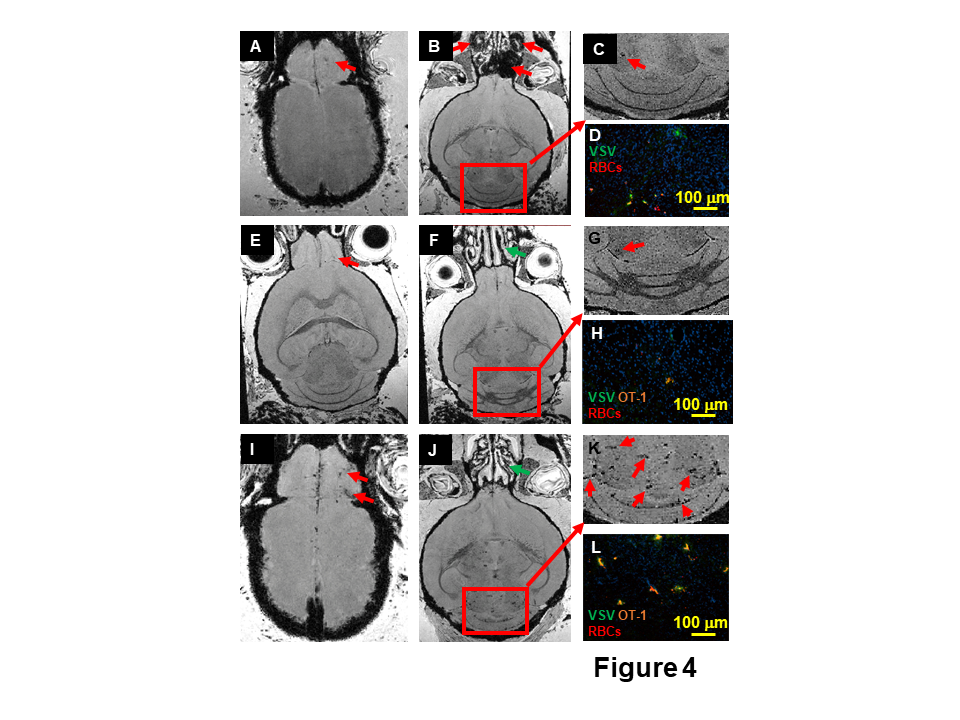
To study the relation of T cell infiltration and microbleeds, 3,000,000 CD8 T cells were transferred. This large dose of T cell reduced bleeding at the turbinates (Fig 4J). However this large dose caused more bleeding in the OB (Fig 4I) and hindbrain (Fig 4J,K). IHC study confirmed that there was a large amount of CD8 T cells, RBCs, and VSV in the cerebellum (Fig 4L). This indicates that care must be used when setting infused T cell doses.
DISCUSSION:
In the OB and hindbrain, wherever T cells were detected, microbleeds were observed. A late stage bleeding site indicates an early stage of T cell infiltration site (Fig 3A,B). Due to the similarity in contrast at this stage we cannot distinguish microbleeds from T cells. Increasing sensitivity to microbleeds may be an approach to detecting early signs of neuroinflammation after VSV infection. Future studies will determine at an early stage, PID 1-4, whether it is possible to detect T cell infiltration without the presence of microbleeds.
CONCLUSION:
Using MRI, we detected bleeding in the turbinates and brain from PID 4 in this viral brain infection model. CD8 T cells reduced turbinates bleeding and protected the brain. However, an overdose of CD8 T cells caused intensive T cell infiltration and bleeding at the OB and cerebellum. MRI and IHC studies showed that T cell CNS infiltration is associated with microbleeds. The combination of MRI contrast from MPIO-labeled T cells and microbleeds may provide an approach for early detection of neuroinflammation. In addition to understanding timing and routes of T cell entry into the brain, MRI T cell tracking may also be helpful for optimizing cell therapies, e.g. CAR T-cell therapy.
Acknowledgements
This research was supported by the Intramural Research Program of the National Institutes of Health, National Institute of Neurological Disorders and Stroke.References
1. Shapiro EM, Skrtic S, Sharer K, Hill JM, Dunbar CE, and Koretsky AP. MRI detection of single particles for cellular imaging. Proc Natl Acad Sci U S A. 2004;101(30):10901-6.
2. Pothayee N, Cummings DM, Schoenfeld TJ, Dodd S, Cameron HA, Belluscio L, et al. Magnetic resonance imaging of odorant activity-dependent migration of neural precursor cells and olfactory bulb growth. Neuroimage. 2017;158:232-41.
Figures