0628
mGLUR5 and GABAA Receptor’s Association with fMRI BOLD Signals in the Default Mode Network as Assessed via Simultaneously recorded PET/MR data1Institute of Neuroscience and Medicine 4 (INM-4), Forschungszentrum Jülich, Jülich, Germany, 2Department of Psychiatry, Psychotherapy and Psychosomatics, RWTH Aachen University, Aachen, Germany, 3JARA – BRAIN – Translational Medicine, Aachen, Germany, 4Department of Psychiatry, Psychotherapy and Psychosomatics, University of Zurich, Zürich, Switzerland, 5Department of Electrical and Computer Engineering, McMaster University, Hamilton, ON, Canada, 6Institute of Neuroscience and Medicine 5 (INM-5), Forschungszentrum Jülich, Jülich, Germany, 7Department of Nuclear Medicine, RWTH Aachen University, Aachen, Germany, 8Institute of Neuroscience and Medicine 11 (INM-11), Forschungszentrum Jülich, Jülich, Germany, 9Department of Neurology, RWTH Aachen University, Aachen, Germany
Synopsis
fMRI-BOLD signals reflect the synaptic activity and glucose energy metabolism in the brain. This study investigated the association between excitatory (mGLUR5), inhibitory (GABAA) neuroreceptors, and glucose metabolism using PET imaging with resting-state fMRI for the first time. The significantly higher mGLUR5 and GABAA neuroreceptor availability and glucose metabolism within the DMN and its correlations show a possible association between increased energy requirements and neuronal activity in the DMN. Further correlations with fMRI measurements show that higher energy demand is utilised for higher functional connectivity, and consecutively higher connectivity within the DMN is more strongly associated with inhibitory receptors.
Introduction
Evidence suggests that the energy demands associated with synaptic currents and neuronal activity in the synapses are reflected in functional magnetic resonance imaging (fMRI) blood oxygenation dependent (BOLD) signals1–3. Neuronal activity is mainly regulated by the inhibitory GABA and excitatory glutamate neurotransmitters, and the influence of these neurotransmitters on the fMRI-BOLD signal is well reported4,5. Although previous studies have suggested links between the fMRI-BOLD signal and neurotransmitters, the use of positron emission tomography (PET) to investigate the association at a neuroreceptor level remains unexplored. Here, the association between glucose metabolism and fMRI-BOLD with the excitatory (mGluR5) and inhibitory (GABAA) neuroreceptors is investigated using simultaneous PET/MR within the prominent resting-state (RS) network, known as the default mode network (DMN)6.Methods
Data AcquisitionThe data presented in this study were acquired using three different PET radiotracers: [11C]ABP688 (ABP, targets mGluR5), [11C]Flumazenil (FMZ, targets GABAA) and [18F]FDG (FDG, for glucose metabolism). The radiotracer was injected as a bolus in the FDG study (10 males, 28 ± 4 years, 200 ± 30 MBq) and as a bolus plus infusion in the ABP (9 males, 23 ± 3 years, 407 ± 56 MBq, KBol = 61.79 min) and FMZ (10 males, 26 ± 3 years, 411 ± 18 MBq, KBol = 46.22 min) studies. PET data acquisition started in list mode simultaneously with the bolus tracer injection. RS-fMRI scans (eyes closed, 6 minutes) were started once the radiotracer had reached equilibrium in the brain. RS-fMRI data were acquired using a T2*-weighted echo planar imaging (EPI) sequence.
MR Data processing
Regional homogeneity (ReHo) and degree centrality (DC) measures for each subject were calculated using MATLAB based software packages (SPM12 and DPABI7) following the required pre-processing steps8. ReHo was computed considering 27 neighbouring voxels and DC was computed with a Pearson correlation cut-off of 0.25 (p = 0.001).
PET data:
PET data were iteratively reconstructed into 3 x 120 s frames (voxel size: 1.25 x 1.25 x 1.25 mm3). Smoothing (3 mm Gaussian filter) and motion correction were performed. Non-displaceable binding potential (BPND) was calculated for ABP and FMZ and a standardised uptake value (SUV) was calculated for FDG. fMRI and PET images were linearly standardised into Z-values, co-registered to the MNI152 (2×2×2 mm3) standard space, smoothed with a 3D Gaussian kernel size of 3 mm, and averaged across all subjects in each study.
DMN mask creation:
The DMN regions were identified using probabilistic independent component analysis9,10. A non-DMN region was created by subtracting DMN regions from the whole brain mask. Both DMN and non-DMN regions were binarized, and only the voxels within the grey matter region were considered as masks. The averaged fMRI and PET image values were extracted from the masks for each study.
Statistical Analysis:
A two-sample t-test with a significance level of 1% was performed for the comparison of BPND and SUV values within the DMN and non-DMN region. In order to elucidate the relationship of BPND with FDG SUV and RS-fMRI, Pearson linear correlation coefficients (r) were computed. The family-wise error rate (FWER), due to multiple comparisons, was controlled using a permutation test11.
Results
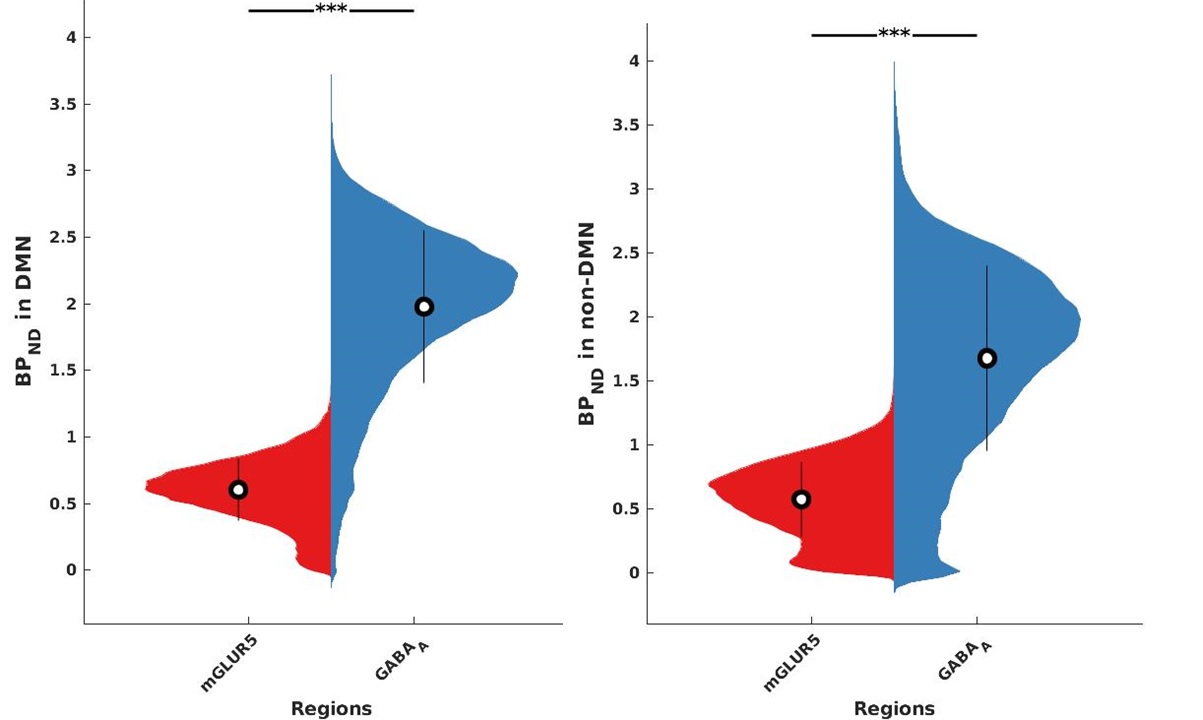
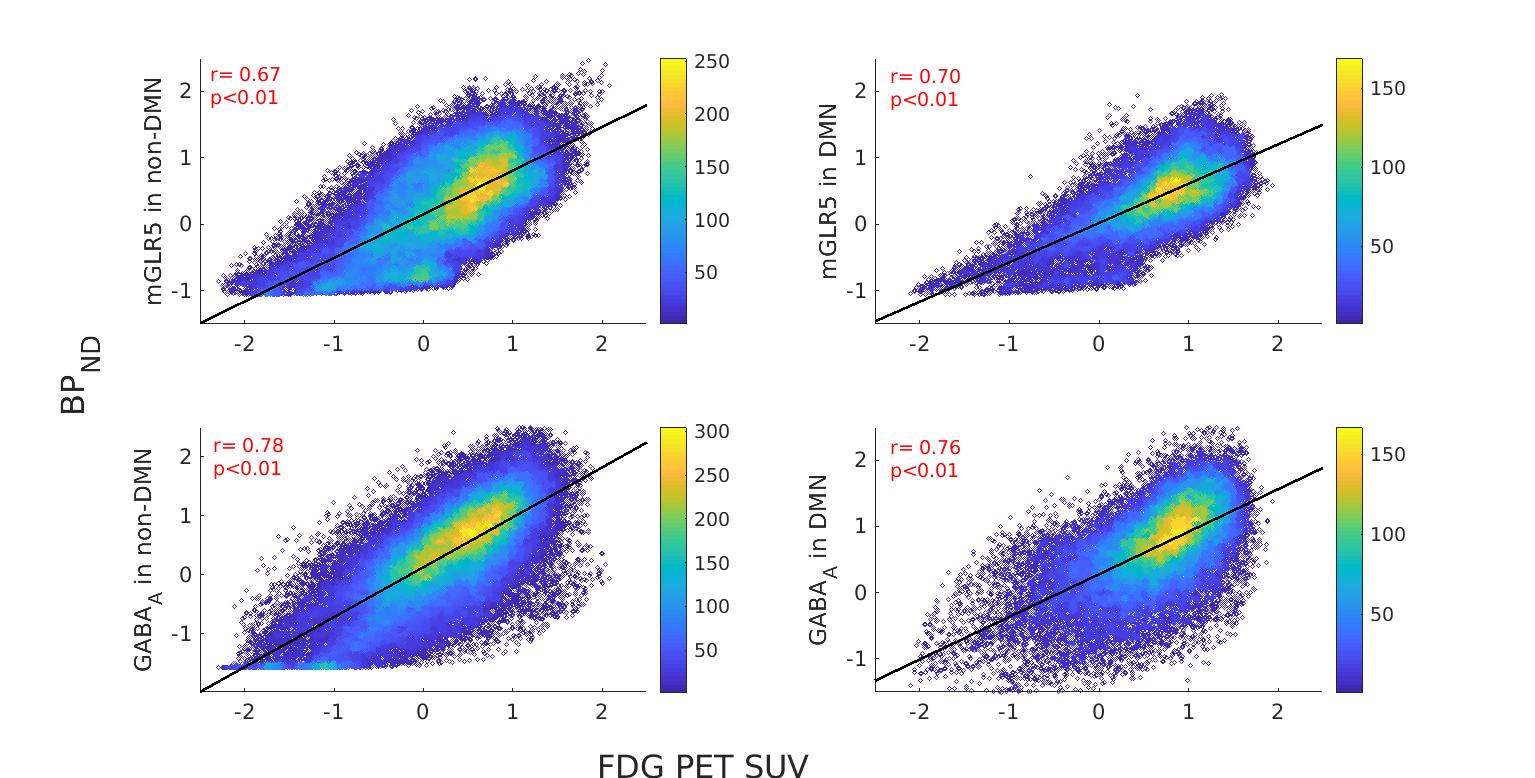
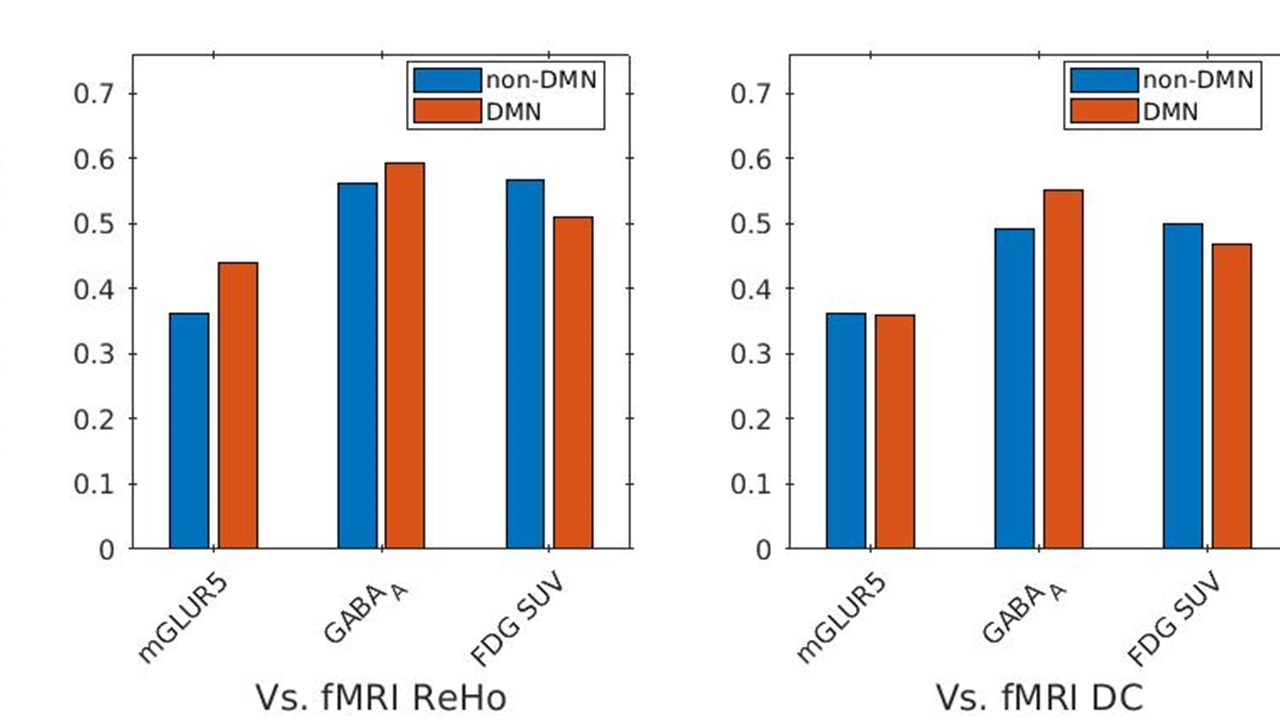
The receptor availabilities of GABAA, mGLUR5 and FDG-PET SUV are significantly (p<0.01) higher within DMN compared to the non-DMN regions. The BPND GABAA is significantly (p<.01) higher compared to mGLUR5 within DMN and non-DMN regions (Fig. 1).The Pearson linear correlation coefficients computed between BPND values and FDG SUV showed significant positive correlations (Fig. 2). The Pearson linear correlation coefficients computed between PET and fMRI values showed significant positive correlations within DMN as well as non-DMN GM regions (Fig. 3) with corrections for FWER.Discussions
GABAA is widely distributed in the human brain12, while mGluR5 is mainly distributed in the anterior cingulate, medial temporal lobe, putamen, and caudate13. This difference in the distribution of the receptors is exhibited in the results presented in Fig. 1. The results newly reported here showing the significantly higher binding availability of mGluR5 and GABAA during RS suggests higher excitatory and inhibitory neural transmission within the DMN regions compared to the rest of the brain. The DMN is considered to be active in the resting condition and requires considerably more energy14,15. This is reflected in the current finding showing higher FDG-PET SUV within the DMN regions. In addition, the RS-fMRI measures show a stronger correlation with FDG-PET SUV (Fig. 3), as reported previously6,16. This association shows that the higher energy demand in the brain is utilised for higher functional connectivity. Since the synaptic activity and the energy metabolism are tightly coupled17, the BPND also shows higher association with FDG-PET SUV (Fig. 3). The association between BPND of GABAA and fMRI measures in the DMN is higher compared to that of mGLUR5. This result emphasises the more inhibitory association of GABAA receptors with the RS-FMRI-BOLD signal in the brain18.Conclusions
Although the mGLUR5 and GABAA receptors only represent a small sample of all neuroreceptors, the results show possible associations and neurobiological mechanisms of BOLD with FDG, mGluR5 and GABAA. Applying this study paradigm to psychiatric patients may help in finding neurobiological mechanisms behind altered functional connectivity19.Acknowledgements
We gratefully thank Dr. Jorge Arrubla and Dr. Joerg Mauler for assistance in Trimodal human data acquisition. We thank Dr. Andreas Matusch for guidance with metabolite correction for PET imaging. We would like to acknowledge our gratitude to Claire Rick for proofreading the abstract. We thank Andrea Muren, Cornelia Frey, Silke Frensch, and Suzanne Schaden for their technical assistance. This study was in part supported by the EU FP7 funded project TRIMAGE (Nr. 602621).References
1. Attwell, D. & Laughlin, S. B. An energy budget for signaling in the grey matter of the brain. Journal of Cerebral Blood Flow and Metabolism 1133–1145 (2001).
2. Fukunaga, M. et al. Metabolic origin of BOLD signal fluctuations in the absence of stimuli. J. Cereb. Blood Flow Metab. (2008).
3. Logothetis, N. K., Pauls, J., Augath, M., Trinath, T. & Oeltermann, a. Neurophysiological investigation of the basis of the fMRI signal. Nature 412, 150–157 (2001).
4. Henning, A. et al. GABA concentrations in the human anterior cingulate cortex predict negative BOLD responses in fMRI. Nat. Neurosci. (2007).
5. Enzi, B. et al. Glutamate modulates resting state activity in the perigenual anterior cingulate cortex - A combined fMRI-MRS study. Neuroscience (2012).
6. Passow, S. et al. Default-Mode Network Functional Connectivity is Closely Related to Metabolic Activity. Hum Brain Mapp 36, 2027–2038 (2015).
7. Yan, C. G., Wang, X. Di, Zuo, X. N. & Zang, Y. F. DPABI: Data Processing & Analysis for (Resting-State) Brain Imaging. Neuroinformatics 14, 339–351 (2016).
8. Zuo, X. N. et al. Network centrality in the human functional connectome. Cereb. Cortex. 22, 1862–1875 (2012).
9. Smith, S. a., Levante, T. O., Meier, B. H. & Ernst, R. R. Computer Simulations in Magnetic Resonance. An Object-Oriented Programming Approach. J. Magn. Reson., Ser. A 106, (Academic Press, 1994).
10. Jenkinson, M., Beckmann, C. F., Behrens, T. E. J., Woolrich, M. W. & Smith, S. M. Fsl. Neuroimage 62, 782–790 (2012).
11. Groppe, D. M., Urbach, T. P. & Kutas, M. Mass univariate analysis of event-related brain potentials/fields I: A critical tutorial review. Psychophysiology 48, 1711–1725 (2011).
12. Waldvogel, H. J., Baer, K. & Faull, R. L. M. Distribution of GABAA Receptor Subunits in the Human Brain. in GABA and Sleep: Molecular, Functional and Clinical Aspects (eds. Monti, J. M., Pandi-Perumal, S. R. & Möhler, H.) 73–93 (Springer Basel, 2010).
13. Ametamey, S. M. et al. Human PET studies of metabotropic glutamate receptor subtype 5 with 11C-ABP688. J. Nucl. Med. (2007).
14. Shah, N. J. et al. Multimodal Fingerprints of Resting State Networks as assessed by Simultaneous Trimodal MR-PET-EEG Imaging. Sci Rep 7, 6452 (2017).
15. Raichle, M. E. The Brain’s Default Mode Network. Annu. Rev. Neurosci. (2013).
16. Aiello, M. et al. NeuroImage Relationship between simultaneously acquired resting-state regional cerebral glucose metabolism and functional MRI : A PET / MR hybrid scanner study. Neuroimage 113, 111–121 (2015).
17. Pellerin, L. & Magistretti, P. J. Glutamate uptake into astrocytes stimulates aerobic glycolysis: a mechanism coupling neuronal activity to glucose utilization. Proc. Natl. Acad. Sci. (1994).
18. Buzsáki, G., Kaila, K. & Raichle, M. Inhibition and Brain Work. Neuron (2007).
9. Kim, J. H. et al. In vivo metabotropic glutamate receptor 5 availability-associated functional connectivity alterations in drug-naïve young adults with major depression. Eur. Neuropsychopharmacol. (2019).
Figures