0627
Myelin-specific imaging using synchrotron X-ray scattering and comparison to MRI myelin-sensitive methods and histology1Radiology, Stanford University, Stanford, CA, United States, 2NYU School of Medicine, New York, NY, United States, 3Institute for Biomedical Engineering, ETH Zurich, Zurich, Switzerland, 4Swiss Light Source, Paul Scherrer Institute, Villigen, Switzerland, 5Psychology, University of Colorado Denver, Denver, CO, United States, 6Radiology, Johns Hopkins Medicine, Baltimore, MD, United States, 7Diagnostic Radiology & Nuclear Medicine, University of Maryland School of Medicine, Baltimore, MD, United States, 8National Synchrotron Light Source II, Brookhaven National Laboratory, Upton, NY, United States, 9Balgrist University Hospital, University of Zurich, Zurich, Switzerland, 10Center for Biomedical Imaging, NYU School of Medicine, New York, NY, United States, 11Institute of Pharmacology and Toxicology, University of Zurich, Zurich, Switzerland
Synopsis
Axonal myelination is an important indicator of brain development and is implicated in many neurologic diseases. However, MRI methods to probe myelin are sensitive but not specific. Small-angle X-ray scattering (SAXS) produces signal specific to myelin’s nanostructural periodicity. Here we apply the recently developed SAXS tensor tomography (SAXS-TT) to non-invasively retrieve myelin levels in mouse brains, and compare them to myelin-sensitive MRI methods. We demonstrate SAXS-TT myelin specificity i) using myelin histology, ii) on a dysmyelination model and iii) by selectively probing central and peripheral nervous system myelin. We propose SAXS-TT as quantitative tomographic method for validating MRI myelin-sensitive sequences.
Introduction
Axonal myelination is an important indicator of brain development and aging, and is associated with multiple neurological/neurodegenerative diseases. Yet, spatially resolved assessment of myelin levels remains a challenge. MRI methods sensitive to myelin include (quantitative) magnetization transfer (MT), T1- and T2-relaxation, and diffusion MRI (dMRI) metrics, among others. Myelin histology/immunohistochemistry remains the gold standard for assessing myelin levels, despite artifacts introduced during sample preparation, sectioning and staining. The recently developed small-angle X-ray scattering tensor tomography (SAXS-TT)1–3 provides a direct, non-destructive approach for myelin imaging, given its specificity to myelin’s nanostructure, i.e. its ~18nm layer periodicity. Here, we apply SAXS-TT on a mouse brain, retrieve myelin levels and compare these to myelin histology and myelin-sensitive MRI contrasts such as (quantitative) MT, T1-/T2-relaxation and dMRI parameters. We also demonstrate SAXS-TT myelin specificity, by studying a dysmyelination model (shiverer) against a control. Finally, we highlight SAXS-TT sensitivity to different myelin nanostructural arrangements, by selectively imaging central and peripheral nervous system myelin, exploiting their distinct periodicities.Methods
Experiments:a) Multimodal experiments on mouse brain:
MRI: A 5-month-old C57BL/6 mouse brain was MRI-scanned ex vivo on a 9.4T Bruker MRI scanner: i) dMRI: voxel-size=75μm iso, 200 q-space points, b-values=[1,2,3,4]ms/μm², ii) MT: voxel-size=150μm iso, offset=1500Hz, B1-amplitude=40μT, iii) quantitative MT: multi-parameter mapping4,5 using proton-density-weighted (PDw), magnetization-transfer-weighted (MTw) and T1-weigthed (T1w) scans at TEs=1.5-19.5ms every 1.5ms, TR=25ms, flip angle: MTw/PDw=6o, T1w=15o, iv) T1 mapping: voxel-size=75μm iso, TE=7.5ms, TR=[0.1,0.2,0.4,0.8,1,1.2,1.6,2,3]s, v) T2 mapping: voxel-size=75μm iso, TR=3s, 25 TEs=8.3-207.5ms every 8.3ms.
X-ray scattering: SAXS-TT was performed in the cSAXS beamline of the Swiss Light Source synchrotron, with voxel-size=150μm, Ephoton=16.3KeV, 267 projections, Fig. 1.
Myelin histology: half of the MRI- and SAXS-TT-scanned brain was dehydrated in increasing concentration ethanol baths, paraffin-embedded, microtome-sectioned in 310 consecutive 10-μm-thick sections, luxol-fast-blue stained, and brightfield-imaged at a resolution of 0.9μm/pixel.
b) SAXS-TT on control and dysmyelinated (shiverer) mouse brains
The extracted brains from one myelinated control (Rag2-/- ) and one shiverer (Rag2-/-sh-/-) 50-day-old mice were SAXS-TT-scanned in the LiX beamline of the NSLS-II synchrotron (voxel-size=120μm, Ephoton=16.3KeV, 180 projections).
Analysis:
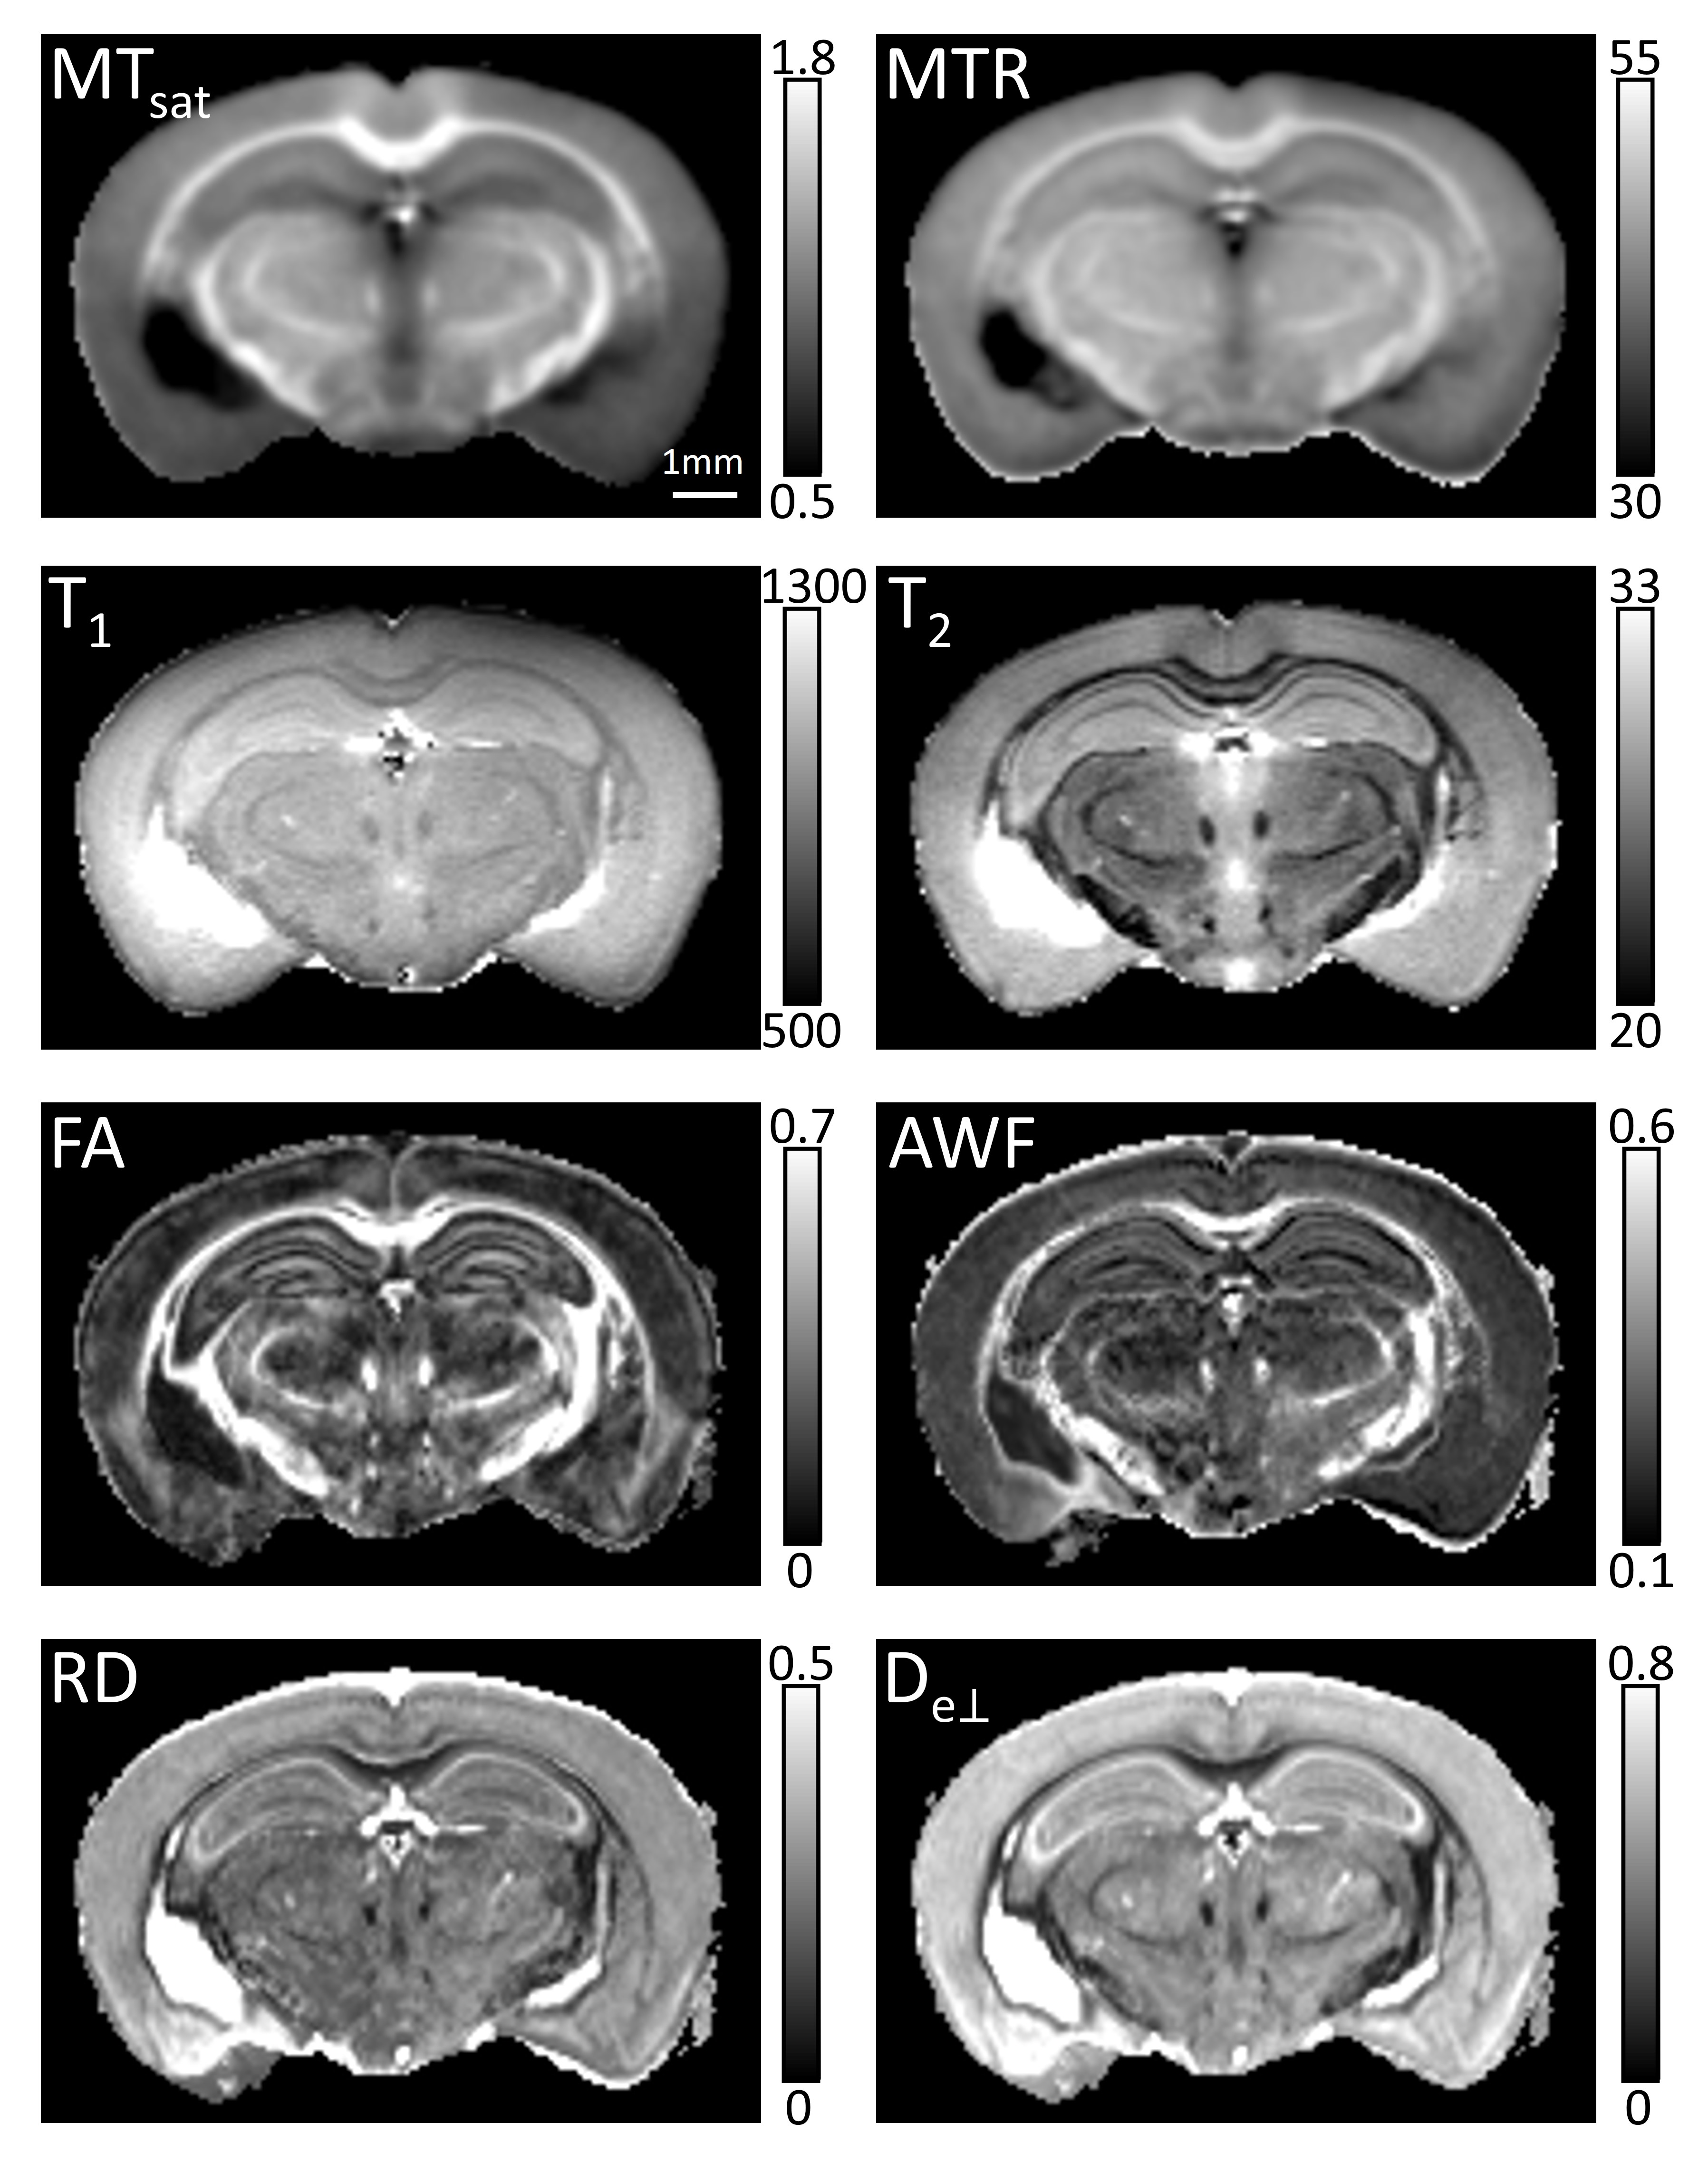
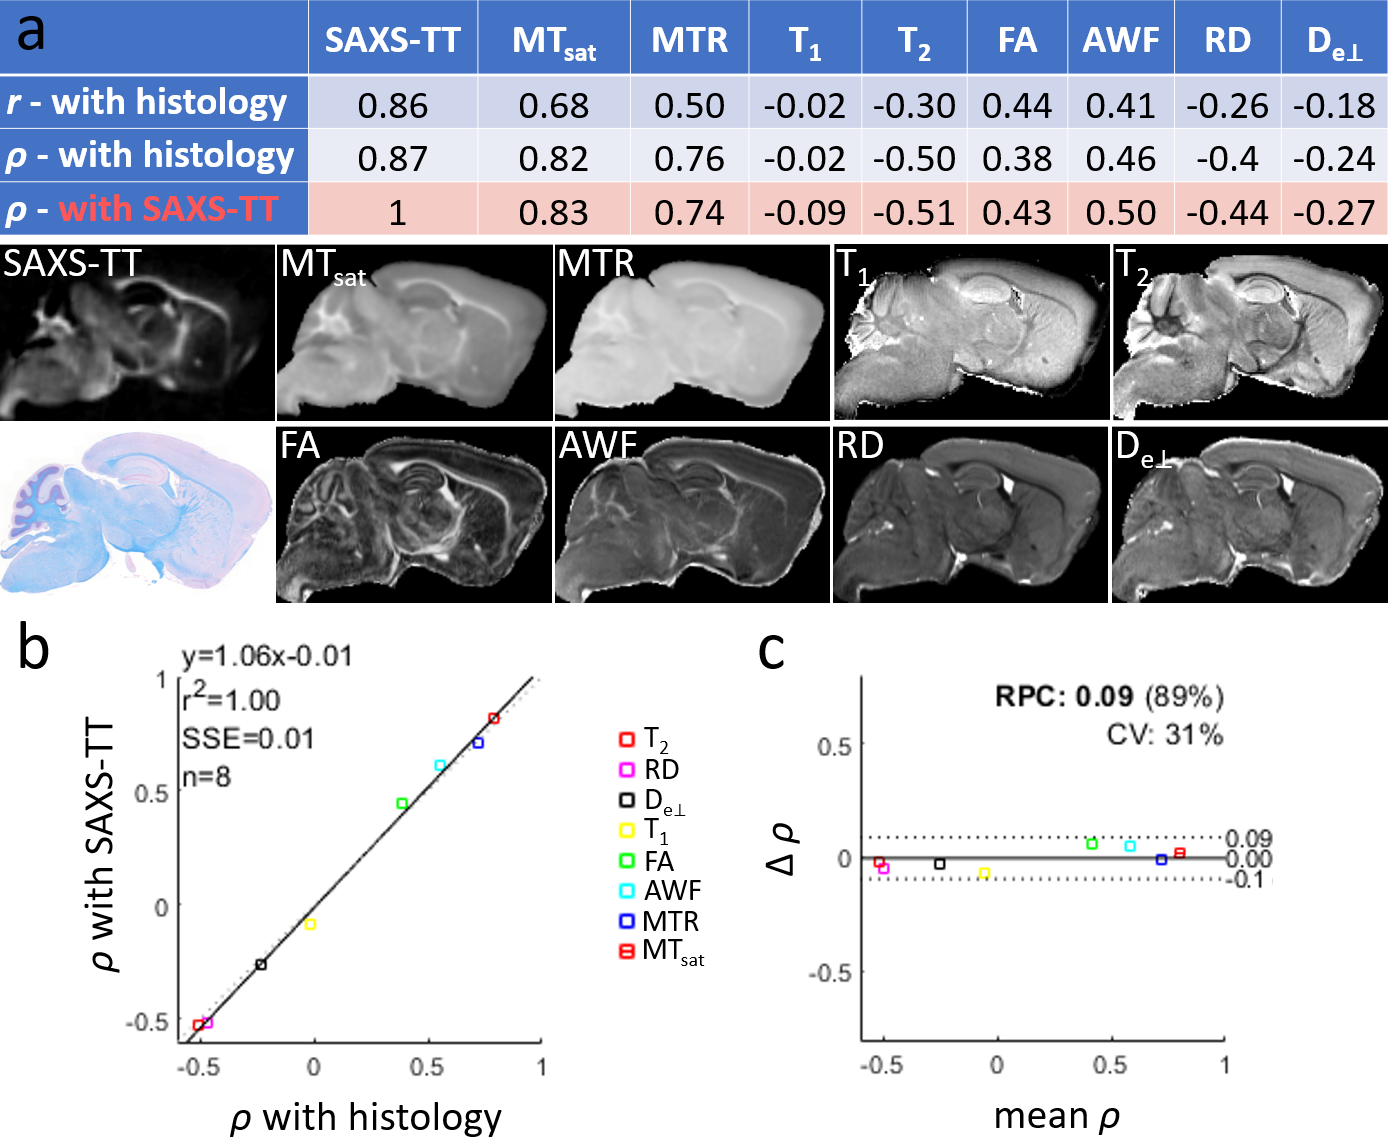
dMRI-based parameters (fractional anisotropy-FA, radial diffusivity-RD, axonal water fraction-AWF, extra-axonal perpendicular diffusivity-De⊥) were derived using the DESIGNER pipeline,6 that includes noise and artifact removal,7,8 and calculation of diffusion and kurtosis tensors, and white matter tract integrity9 (WMTI) parameters. MTR was calculated as (MTnopulse–MTpulse)/MTnopulse. MTsat was calculated according to 4,5 using the PDw, T1w and MTw scans. T1 and T2 maps were derived from mono-exponential fitting of the respective signals. For SAXS-TT, the myelin-specific signal was isolated (Fig. 6b), and tensor-tomographic reconstruction3 provided distribution of brain myelin levels. Histology sections were rigidly registered into a stack using Fiji.10 SAXS-TT and MRI datasets were non-linearly registered11 to the myelin histology dataset, down-sampled to 75μm. Pearson (r) and Spearman (ρ) correlations were performed over the entire hemisphere (362,303 voxels).
Results
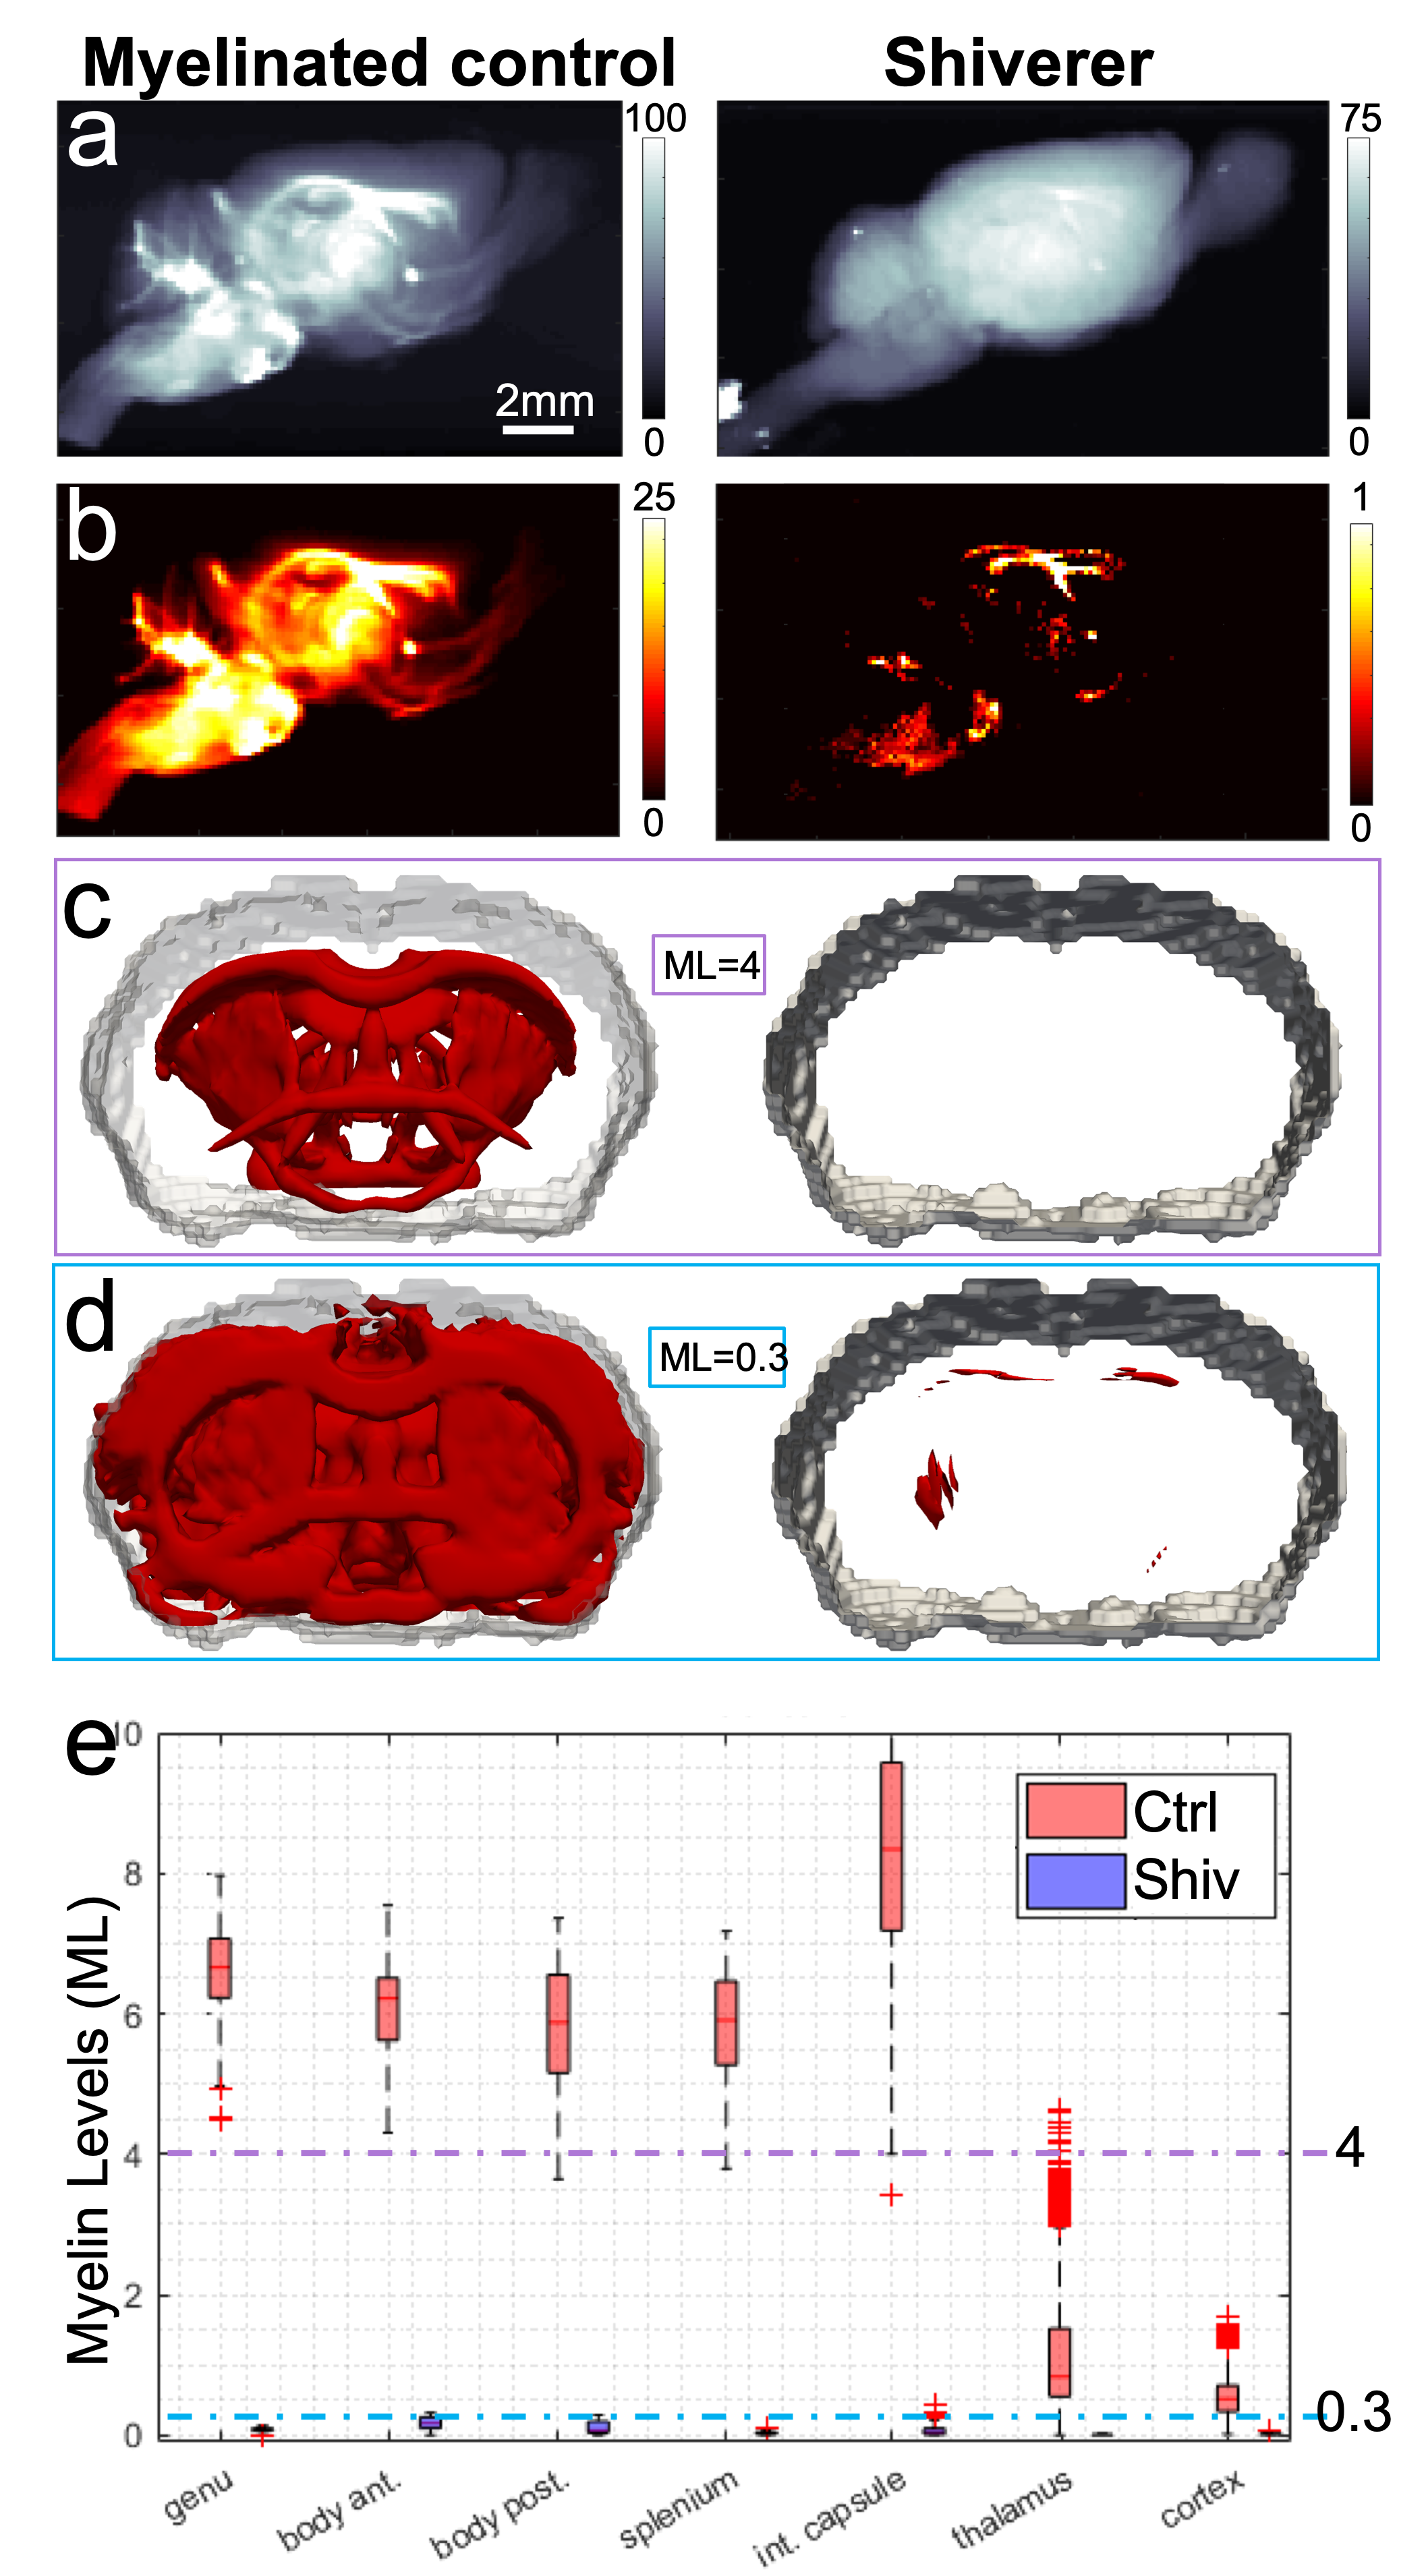
SAXS-TT whole mouse brain experiments resulted in a quantitative myelin map, Fig. 1d. A coronal section from the MRI-sensitive parameter maps is shown in Fig. 2. Correlations between histology and SAXS-TT/MRI myelin metrics are shown in Fig. 3a. All correlations are significant (p<0.0001) due to the high voxel number. The highest linear (Pearson) correlation is with SAXS-TT (rSAXS-TT=0.86), followed by MT parameters (rMTsat=0.68, rMTR=0.50), FA and AWF (rFA=0.44, rAWF=0.41). Similarly, SAXS-TT has the highest monotonic (Spearman) correlation (ρSAXS-TT=0.87) with histology, followed by MT parameters (ρMTsat=0.83, ρMTR=0.74), T2 and AWF (ρT2=-0.50, ρAWF=0.46). Since we are suggesting the use of SAXS-TT as a gold standard for assessing myelin levels, we also correlated all MRI metrics with SAXS-TT, Fig. 3a, third row. We assessed the equivalence of using SAXS-TT instead of histology as reference for MRI metrics, Fig. 3b-c, where we plot the Spearman correlations with SAXS-TT vs. the correlations with histology. We found a Pearson coefficient of r=1 (Fig. 3b) and a Bland-Altman reproducibility coefficient12 of 89% (Fig. 3c).Figure 4 shows the myelin maps for the control versus dysmyelinated mice, with the dysmyelinated brain displaying very low myelination levels. Figure 5 shows the separate SAXS-TT analysis of central and peripheral myelin, due to their distinct periodicities, with Fig. 5c,d illustrating the (peripheral) trigeminal nerve (green) synapsing with the brain (magenta) at the trigeminal nucleus, in a ball-socket fit.
Discussion
We show that SAXS-TT-derived myelin levels correlate highly with myelin histology, and produce similar correlation coefficients as histology against MRI metrics. Given SAXS-TT’s capability for tomographic and quantitative myelin analyses, this suggests its potential use as a gold standard in myelin imaging, and as reference for MR metrics, instead of histology, overcoming the need for sample preparation, sectioning and staining. We further demonstrate SAXS-TT specificity to myelin by studying a myelinated control versus a dysmyelination model, and show that SAXS-TT can also capture this very limited myelination stemming from the few myelin layers.13 Finally, we show that SAXS-TT is very sensitive to myelin nanostructure differences by clearly distinguishing between central and peripheral myelin, due to their distinct sheath periodicity (~16 vs. ~20nm). Overall, we present SAXS-TT as a non-invasive, myelin-specific imaging method, that can be used for validation of MRI myelin-sensitive metrics and quantitative (de-/re-)myelination investigations in the nervous system.Acknowledgements
Research was partly supported by Swiss National Science Foundation (SNSF) grant numbers P2EZP3_168920, P400PM_180773, 200021_178788, and by the National Institutes of Health (NIH) award numbers R01 NS088040 and P41EB017183.References
1. Liebi, M., Georgiadis, M., et al. Nanostructure surveys of macroscopic specimens by small-angle scattering tensor tomography. Nature 527, 349–352 (2015).
2. Liebi, M., Georgiadis, M., et al. Small-angle X-ray scattering tensor tomography: model of the three-dimensional reciprocal-space map, reconstruction algorithm and angular sampling requirements. Acta Crystallogr A Found Adv 74, 12–24 (2018).
3. Gao, Z., Guizar-Sicairos, M., et al. High-speed tensor tomography: Iterative Reconstruction Tensor Tomography (IRTT) algorithm. Acta Crystallogr. Sect. A Found. Adv. A75, (2019).
4. Helms, G., Dathe, H., Kallenberg, K. & Dechent, P. High-resolution maps of magnetization transfer with inherent correction for RF inhomogeneity and T1 relaxation obtained from 3D FLASH MRI. Magn Reson Med 60, 1396–1407 (2008).
5. Weiskopf, N., Suckling, J., et al. Quantitative multi-parameter mapping of R1, PD(*), MT, and R2(*) at 3T: a multi-center validation. Front. Neurosci. 7, 95 (2013).
6. Ades-Aron, B., Veraart, J., et al. Evaluation of the accuracy and precision of the diffusion parameter EStImation with Gibbs and NoisE removal pipeline. Neuroimage 183, 532–543 (2018).
7. Veraart, J., Novikov, D. S., et al. Denoising of diffusion MRI using random matrix theory. Neuroimage 142, 394–406 (2016).
8. Veraart, J., Fieremans, E. & Novikov, D. S. Diffusion MRI noise mapping using random matrix theory. Magn Reson Med 76, 1582–1593 (2016).
9. Fieremans, E., Benitez, A., et al. Novel white matter tract integrity metrics sensitive to Alzheimer disease progression. AJNR Am J Neuroradiol 34, 2105–2112 (2013).
10. Fiji. Register Virtual Stack Slices. http://imagej.net/Register_Virtual_Stack_Slices (2017).
11. Kroon, D.-J. Multimodality non-rigid demon algorithm image registration. https://www.mathworks.com/matlabcentral/fileexchange/21451-multimodality-non-rigid-demon-algorithm-image-registration (2010).
12. Klein, R. Bland-Altman and Correlation Plot. https://www.mathworks.com/matlabcentral/fileexchange/45049-bland-altman-and-correlation-plot (2019).
13. Walczak, P., All, A. H., et al. Human glial-restricted progenitors survive, proliferate, and preserve electrophysiological function in rats with focal inflammatory spinal cord demyelination. Glia 59, 499–510 (2011).
Figures