0620
MR Barcoding: Gradient-Free MRI Using B1-Selective Parallel Transmission1Vanderbilt University Institute of Imaging Science, Nashville, TN, United States, 2Department of Biomedical Engineering, Vanderbilt University, Nashville, TN, United States, 3Radiology, Case Western Reserve University, Cleveland, OH, United States
Synopsis
Conventional MR imaging uses linear B0 gradients for spatial encoding, which have high cost and bulk, and lead to patient discomfort via noise and PNS. We introduce MR Barcoding as a silent, low-profile, and low-cost replacement for B0 gradients. The technique is based on non-linear RF magnitude gradients synthesized by an array of conventional transmit coils, combined with B1+-selective Hadamard encoding pulses. A proof-of-principle simulation shows that a 64x64 image could be reconstructed using an MRF model and a sub-30s scan duration. Experimental results at 47.5 mT validate the encoding capabilities of the B1+-selective Hadamard encoding pulses.
Introduction
Conventional MR imaging uses linear B0 gradients for spatial encoding, which have high cost and bulk, and lead to patient discomfort via acoustic noise and peripheral nerve stimulation. A few spatial encoding methods have been proposed that use RF gradient coils [1-4], which would not suffer the drawbacks of B0 gradients, but these require linear RF amplitude or phase gradient coils or perform insufficient encoding. None enable quantitative MR imaging of T1 and T2 relaxation times. Here we propose a new RF spatial encoding method that combines B1+-selective excitations, MR fingerprinting (MRF) [5], and parallel transmission, to enable quantitative imaging.Methods
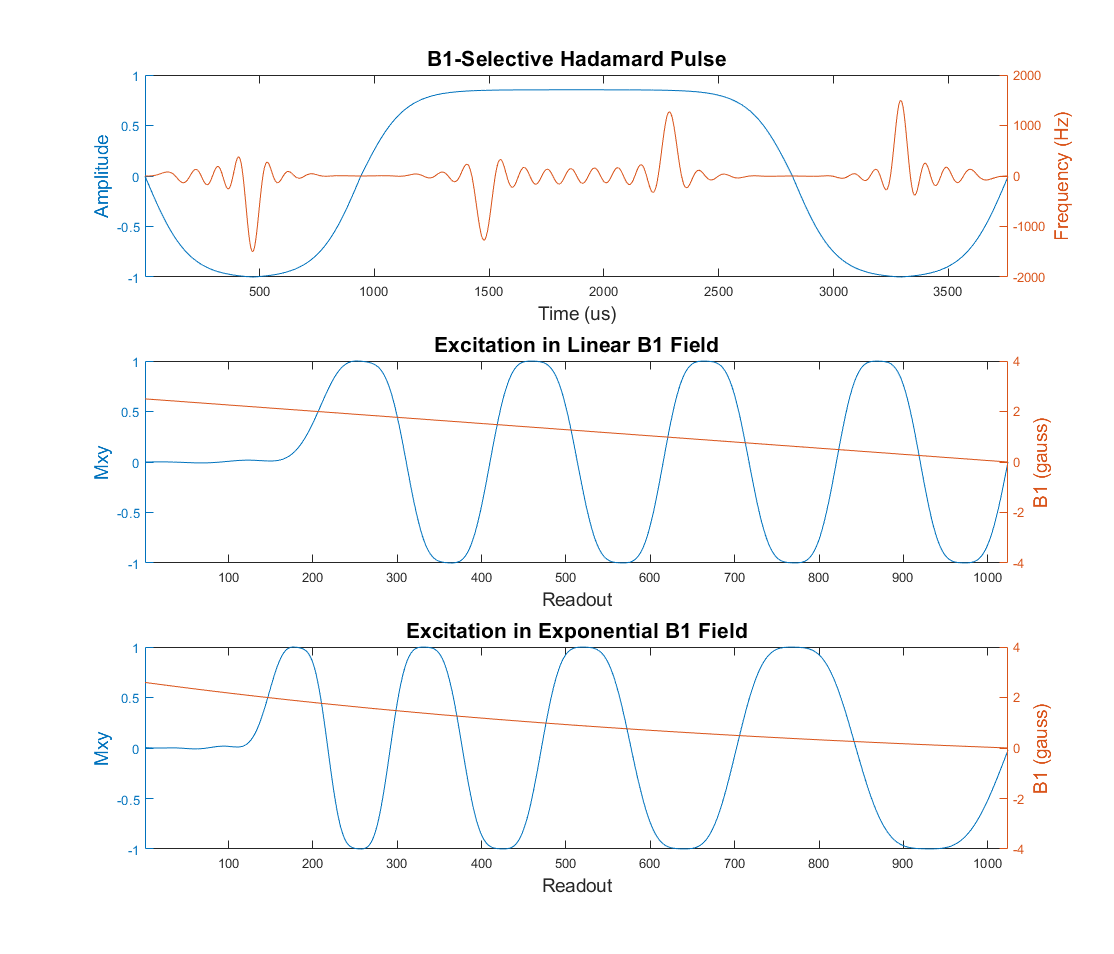
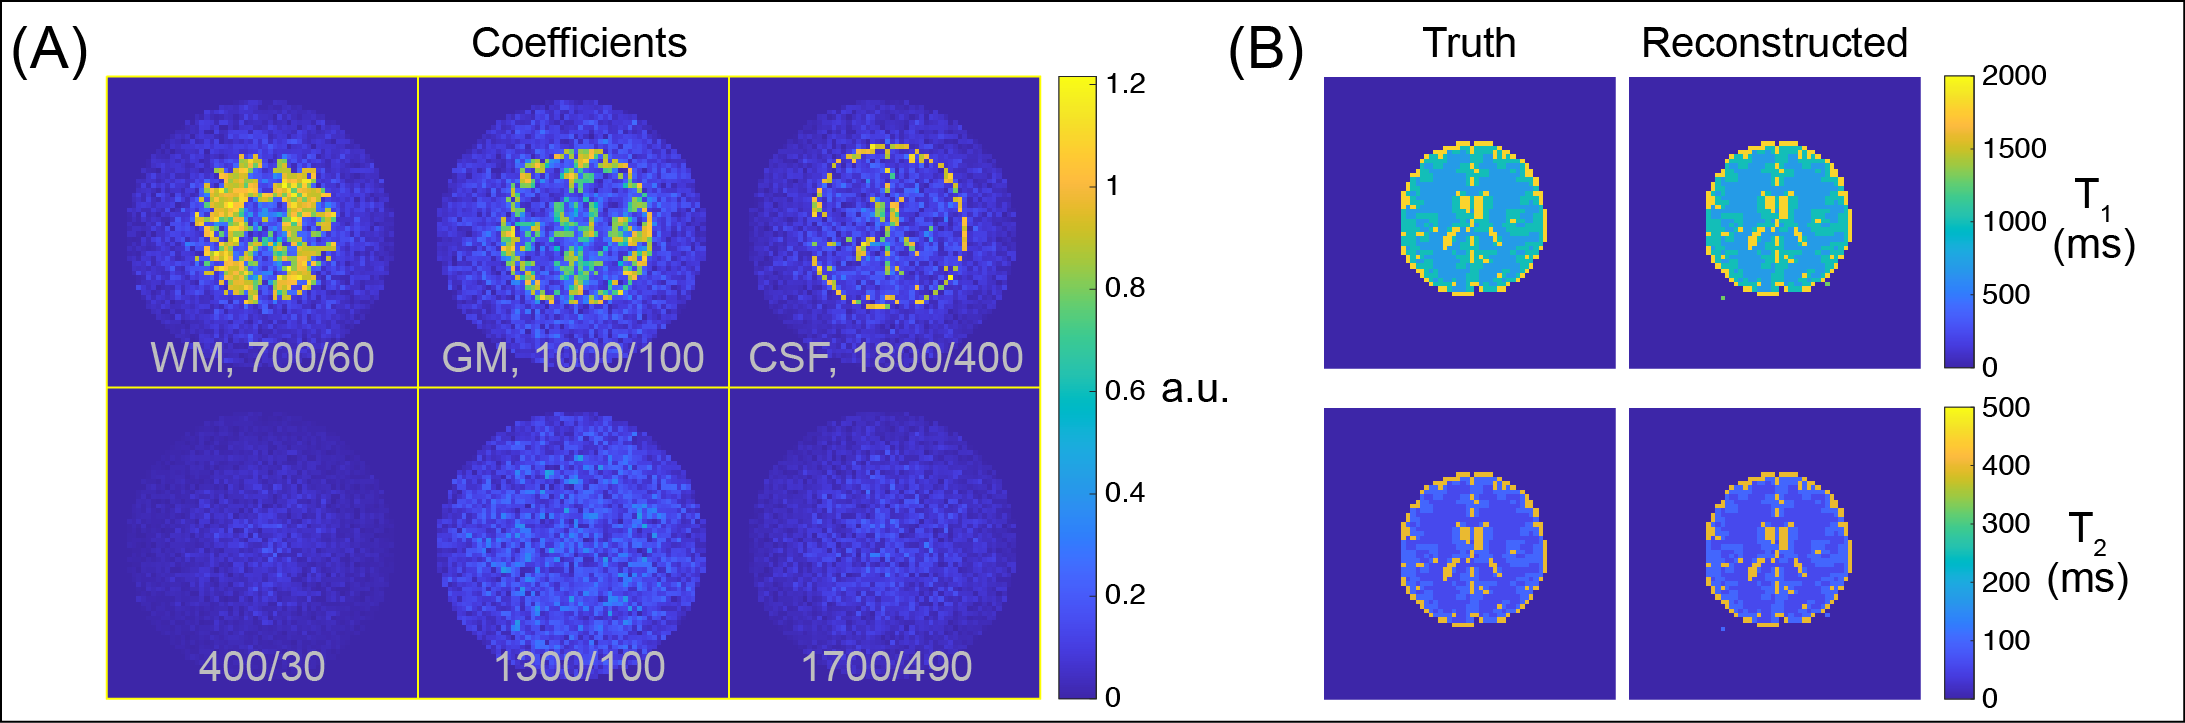
RF Pulse Design B1+-Selective pulses were designed using the Shinnar-Le Roux algorithm [6], with a Hadamard beta filter design [7]. To mitigate distortions due to limited amplifier bandwidth in the experiment, the pulses’ original constant AM waveforms were tanh-modulated, and the FM waveforms were VERSE’d onto the modulated AM waveforms. Figure 1 plots a pulse designed for encoding 8 sub-slices, and the Mx profile it excites as a function of B1+.Barcoding Proof-of-Principle A simulation was performed using the B1+/B1- maps of eight 15 cm-radius loops positioned circumferentially around a circular ROI. The maps were calculated by Biot-Savart, and the B1+ maps were scaled to 0-10 Gauss inside the ROI. Then a set of 64 coil modes were defined, including individual coils and sums and differences of three and four coils. A set of 32 B1+-selective Hadamard encoding excitation pulses (duration 3.8 ms) were designed to excite a slab between 0-8 Gauss with 32 sub-slices. A second set was designed with a half-slice shift, for a total of 64 pulses. This 64x64 = 4096 set of excitations were then used in an MRF Bloch simulation (TR = 4 ms, 2.5 cycles sinusoidal flip angle variation up to 90 degrees, inversion prep) to generate a dictionary of signal time courses at each spatial location for white matter (WM; T1/T2 = 700/60 ms), grey matter (GM; T1/T2 = 1000/100 ms), and cerebrospinal fluid (CSF; T1/T2 = 1800/400 ms), as well as three confounding signals with T1/T2 = 400/30, 1300/100, and 1700/490 ms. Brain WM, GM, and CSF masks and random noise were then used to generate signals for each receiver coil, and reconstruction was performed by dictionary matrix inverse.
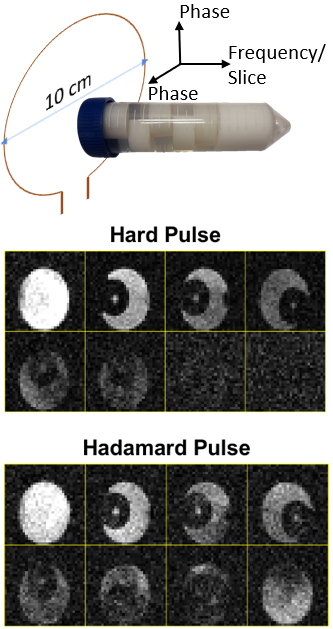
Encoding Pulse Validation Experiment To validate the B1+-selective Hadamard encoding pulses, a set of pulses were designed for 8 sub slices (Figure 1) to encode the long axis of a 10 cm-long mineral oil test tube phantom containing stacked circular disks at different radial positions (Figure 5, top). The sub slices were 0.25 gauss in width and spaced evenly between 0 and 2 Gauss. Data were acquired using a Tecmag Redstone MRI Console (Tecmag, Houston, Texas) with a single-turn 10 cm loop TR coil on a 47.5 mT whole-body permanent magnet. A 3D gradient-recalled echo sequence with a 10us hard pulse excitation was used to acquire reference images with parameters: TR = 75 ms, TE = 26 ms, Readout Bandwidth = 5 kHz, 128 readout points, and 31 by 31 phase encodes. This 3D scan was repeated using each Hadamard pulse for excitation, and the DC data were used to reconstruct the Hadamard-encoded images. A reference test tube phantom without structure was also excited with each Hadamard pulse to measure a calibrated reconstruction matrix.
Results
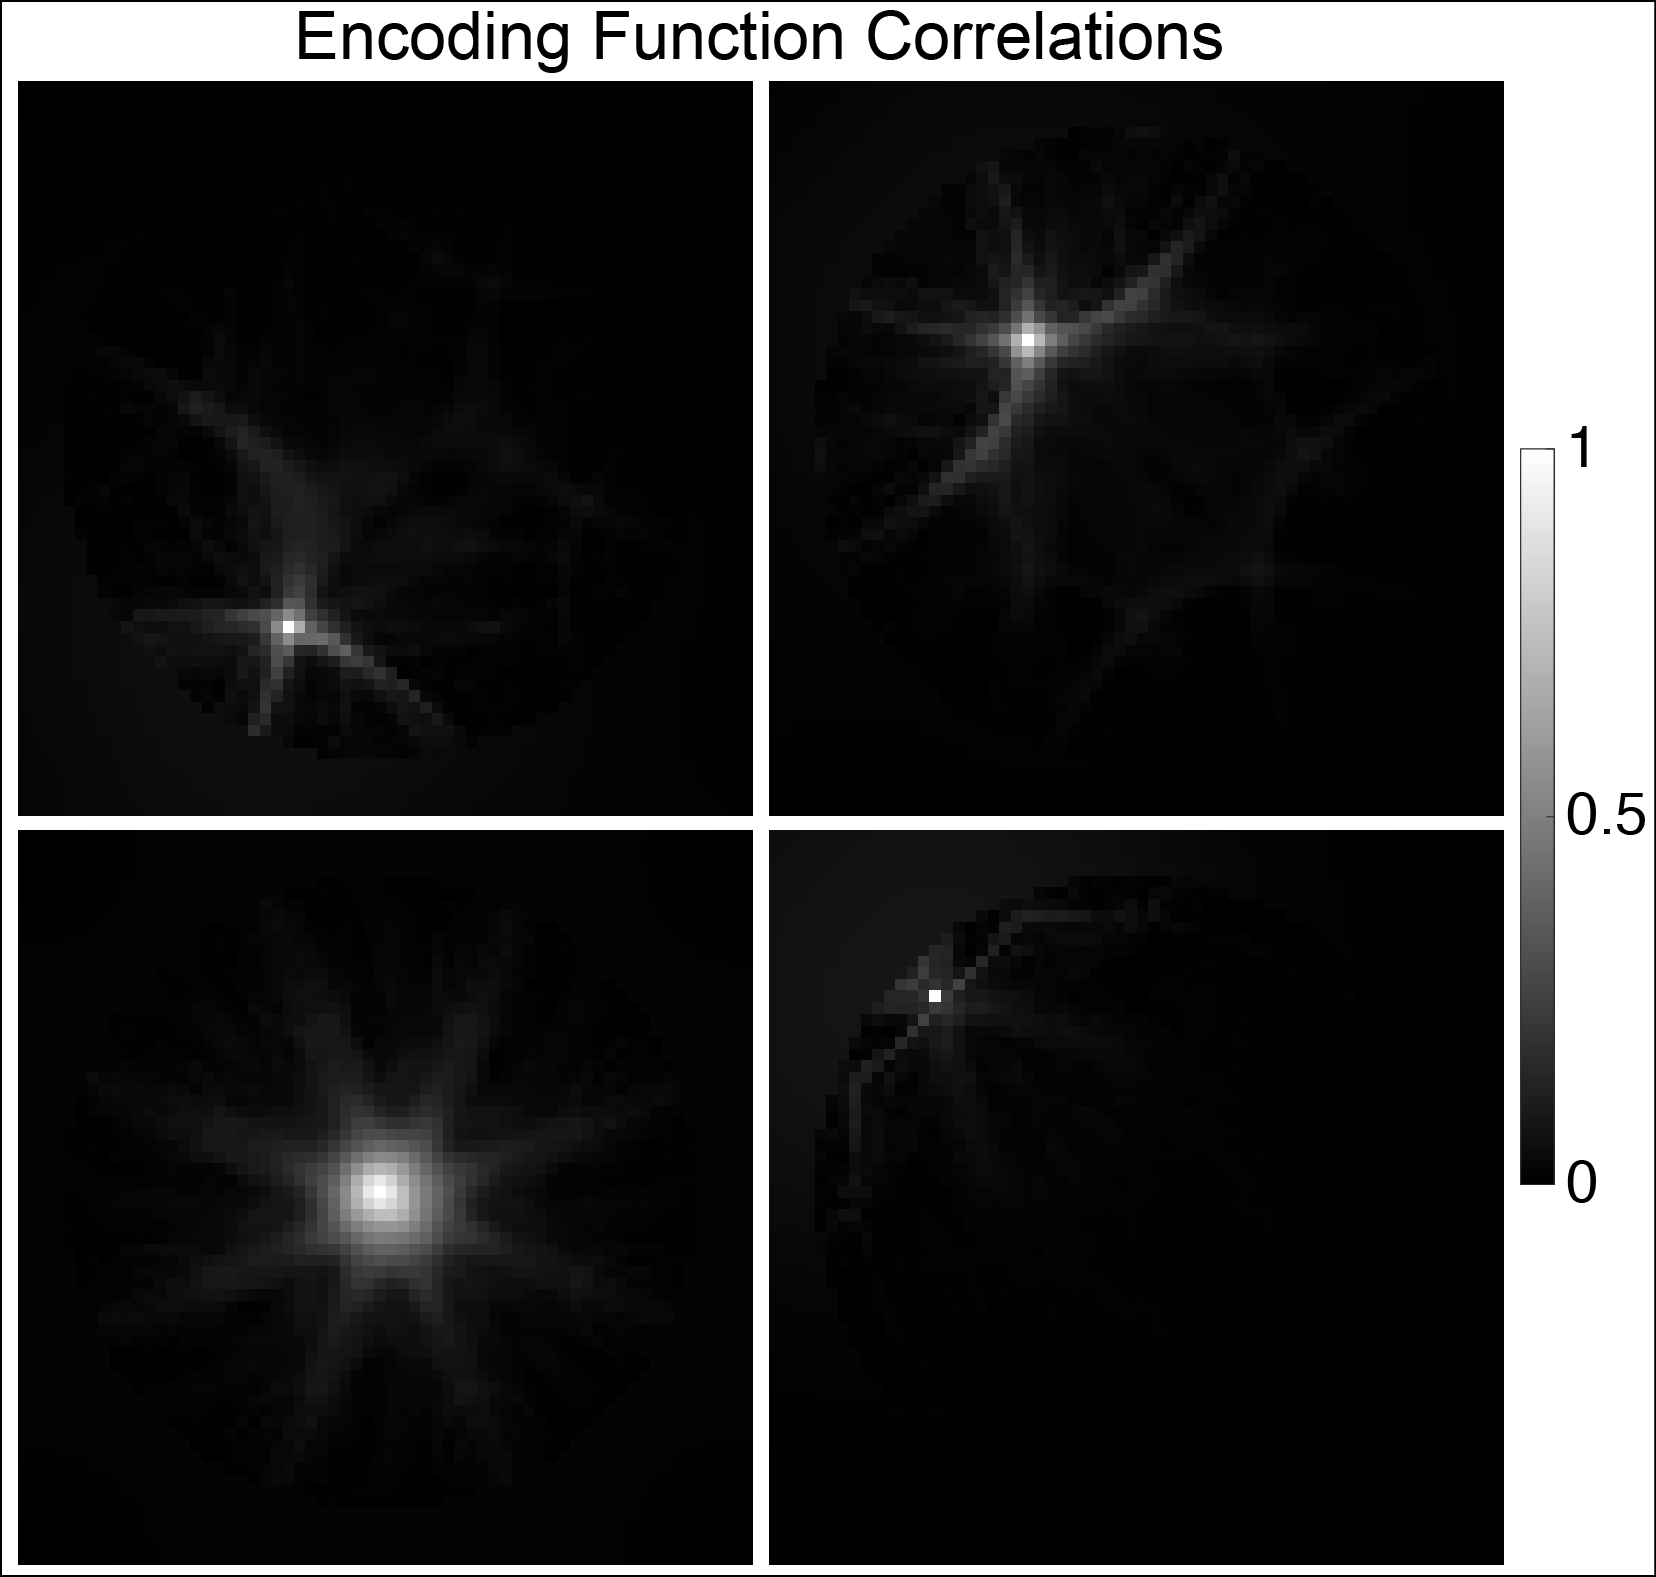
Barcoding Proof-of-Principle The GIF in Figure 2 shows the excitation patterns produced by each encoding pulse and mode. The patterns produce 0/pi phase oscillations over the excited slabs, with varying sub-slice widths, positions, and curvatures. Figure 3 shows signal correlation maps for four voxels at different radial and angular positions in the circular ROI, which reflect fine encoding resolution near the coils, where the B1+ fields change the fastest and the B1- fields overlap the least. Resolution in the middle can be improved by increasing the number of excited sub-slices or adding excitations with sub-slice shifts. Figure 4 shows reconstructed coefficient and T1/T2 maps. Only one voxel inside the brain was misclassified.Encoding Pulse Validation Experiment The phantom and coil setup for the experiment are shown at the top of Figure 5. The second row shows the hard pulse-excitation images that were obtained by summing images through the Hadamard-encoded slice widths. The third row shows the Hadamard-encoded images, which agree with the hard pulse images and have higher signal at deeper slices due to the uniform flip angles excited by the B1+-selective pulse.
Conclusion
MR Barcoding was introduced as a new encoding technique based on non-linear RF magnitude gradients synthesized by an array of conventional transmit coils, combined with B1+-selective Hadamard encoding pulses. Since it does not use B0 gradients, it would be silent. It has low RFPA bandwidth requirements, so it could be implemented with low-cost on-coil amplifiers [8]. It could be applied to achieve large cost reductions in very low field systems, or to enable much larger (~1 m-wide) bores at high field. A proof-of-principle simulation showed that a 64x64 image could be reconstructed using an MRF model and a sub-30s scan duration. Experimental results validated the encoding capabilities of the B1+-selective Hadamard encoding pulses.Acknowledgements
This work was supported by NIH Grant R01 EB 016695.References
[1] D. I. Hoult. Rotating frame zeugmatography. J Magn Reson, 33(1):183–197, 1979.
[2] D. Canet. Radiofrequency field gradient experiments. Prog Nuc Magn Reson Spect, 30:101–135, 1997.
[3] J. C. Sharp and S. B. King. MRI using radiofrequency magnetic field phase gradients. Magn Reson Med, 63(1):151–161, 2010.
[4] U. Katscher, J. Lisinski, and P. Boernert. RF encoding using a multielement parallel transmit system. Magn Reson Med, 63(6):1463–1470, 2010.
[5] D. Ma, V. Gulani, N. Seiberlich, K. Liu, J. L. Sunshine, J. L. Duerk, and M. A. Griswold. Magnetic resonance fingerprinting. Nature, 495:187–192, 2013.
[6] W. A. Grissom, Z. Cao, and M. D. Does. B1+-selective excitation pulse design using the Shinnar-Le Roux algorithm. J Magn Reson, 242:189–196, 2014.
[7] C. H. Cunningham and M. L. Wood. Method for improved multiband excitation profiles using the Shinnar-Le Roux transform. Magn Reson Med, 42(3):577–584, Sep 1999.
[8] N. Gudino, J. A. Heilman, M. J. Riffe, O. Heid, M. Vester, and M. A. Griswold. On-coil multiple channel transmit system based on class-D amplification and pre-amplification with current amplitude feedback. Magn Reson Med, 70(1):276—289, 2013.
Figures