0614
Improved 3D real-time MRI with Stack-of-Spiral (SOSP) trajectory and variable density randomized encoding of speech production1Ming Hsieh Department of Electrical and Computer Engineering, Viterbi School of Engineering, University of Southern California, Los Angeles, CA, United States, 2Department of Linguistics, Dornsife College of Letters, Arts and Sciences, University of Southern California, Los Angeles, CA, United States
Synopsis
3D real-time (RT) MRI is a useful tool in speech production research, as it enables full visualization of the dynamics of vocal tract shaping during natural speech. Limited spatial and temporal resolution, and a tradeoff between them, is however common in highly accelerated MRI. In this work, we demonstrate improved spatio-temporal resolution by using variable density randomized stack-of-spiral sampling and a constrained reconstruction. We can capture rapid movement of articulators, specifically lips and tongue body movements at both normal and rapid speech rates, yielding a substantial improvement over prior approaches in measuring fine details of human speech production.
INTRODUCTION
Real-time (RT) MRI has emerged as an efficient tool to understand the complex spatio-temporal coordination of vocal tract articulators during speech production1. Speech RT-MRI faces fundamental trade-offs between spatial resolution, temporal resolution, spatial coverage, signal-to-noise ratio (SNR), and artifacts, which are common to all fast MRI. Since 2004 2D mid-sagittal RT-MRI has been extensively applied to speech production research2 and is considered to be a standard and mature method. Recently, 3D RT-MRI has provided an opportunity to study the entire vocal tract volume in motion3. Lim et al.4 demonstrated the feasibility of 3D RT-MRI of natural speech, with full vocal tract coverage, 2.4×2.4×5.8 mm3 spatial resolution and 61ms temporal resolution. Inspired by this study, we explore and evaluate improved (k,t) data sampling strategies and constrained reconstruction options for 3D RT-MRI with improved spatio-temporal resolution during natural speech tasks.METHODS
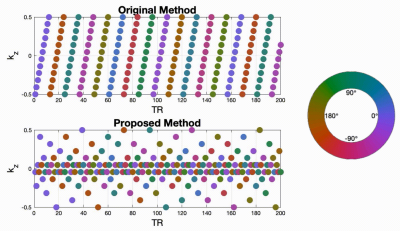
Data sampling and reconstructionFigure 1 illustrates a proposed sampling strategy compared to the prior work of Lim et al4. During each TR, we acquire one spiral arm in the $$$k_x$$$-$$$k_y$$$ plane to achieve 13-fold acceleration. A pseudo-golden angle increment is used in the $$$k_x$$$-$$$k_y$$$ plane, and Cartesian sampling is employed along the $$$k_z$$$ direction. In Lim's method4, $$$k_z$$$ steps are sampled in a linear order. Spiral patterns are tilted with a golden-angle increment after 12 phase encodings (corresponding to full $$$k_z$$$ sampling). In the proposed method, we applied a rotated a golden-angle in the $$$k_x$$$-$$$k_y$$$ plane for each phase encoding step. $$$k_z$$$ was sampled randomly according to a variable density function. Four other sampling schemes were also designed, which allowed pairwise comparisons for a single change of sampling strategy. Due to the space constraints, they are not shown here. Image reconstruction was performed by solving the following constrained optimization: $$ \underset{f(\mathbf{r},t)}{\mathrm{argmin}} \|A(f)-\mathbf{b}\|_{2}^2 + \lambda_1 \|TV(f)\|_1 + \lambda_2 \|D_t (f)\|_1$$ where $$$f(\mathbf{r},t)$$$ is the dynamic image time series to be reconstructed, and the vector $$$\mathbf{r}\in(x,y,z)$$$ represents image domain spatial coordinates. $$$\mathbf{b}$$$ is multi-coil k-t space measurement data. A refers to coil sensitivity encoding as well as Fourier operator along each time frame in 3D volume. Isotropic total variation (TV) and first-order finite difference ($$$D_t$$$) constraints were applied along spatial and temporal dimensions, respectively. Reconstruction was implemented in MATLAB using the Berkeley Advanced Reconstruction Toolbox5. The regularization parameters $$$\lambda_{1}$$$ and $$$\lambda_{2}$$$ were chosen visually based on image quality in sagittal views and time-intensity plots.
In-vivo Experiments
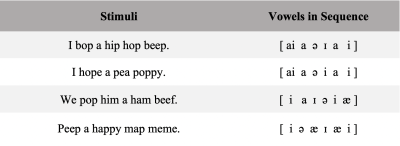
Experiments were performed on a 1.5 T Signa Excite HD scanner (GE Healthcare, Waukesha, WI), using the real-time imaging platform (RT-Hawk, Heart Vista Inc, Los Altos, CA) which allows interactive control of scan parameters. Experiments used the body coil for RF transmission and a custom eight-channel upper airway coil for signal reception. Two healthy adult volunteers were scanned. Speaker 1 (male native Chinese speaker, English as a second language) was scanned while reading the English stimuli: “/loo/-/lee/-/la/-/za/-/na/-/za/” repeated twice at a natural rate. Speaker 2 (male American English speaker) was scanned with a 3D sequence using the original and the proposed sampling patterns, as well as 2D three-slice sequences as reference6. The stimuli for Speaker 2 are listed in Table 1 and were each spoken twice, once at a natural rate and once at a speaking rate of approximately 1.5× the initial rate. All stimuli were read in the scanner using a mirror projector setup used for display7.
RESULTS
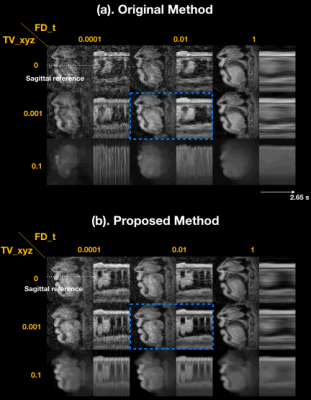
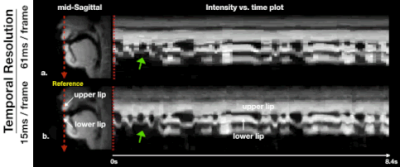
Figure 2 illustrates the impact of regularization parameters, and their selection. The spatial TV term $$$\lambda_{1}$$$ = 0.001 provides denoising as shown in the sagittal plane, but results in oversmoothing if chosen to be too large (e.g. $$$\lambda_{1}$$$ = 0.1). The temporal finite difference term $$$\lambda_{2}$$$ allows efficient suppression of noise-like undersampling artifact while recovering intensity changes over time ($$$\lambda_{2}$$$ = 0.01) but tends to oversmooth the motion as $$$\lambda_{2}$$$ increases ($$$\lambda_{2}$$$ = 1), as seen in the temporal plots. We observe that the proposed method preserves boundary sharpness and provides clear intensity changes in time (blue-dotted box) compared to the previous method, given the same regularization penalty ($$$\lambda_{1}$$$ = 0.001,$$$\lambda_{2}$$$ = 0.01). Parameter sweeps were performed on a much finer scale than shown in Figure 2. Based on visual image quality, we chose $$$\lambda_{1}$$$= 0.008, $$$\lambda_{2}$$$= 0.03. These parameters were used for all subsequent results.Figure 3 illustrates retrospective selection of temporal resolution with the proposed method. Better temporal resolution enables capturing rapid opening and closing of upper and lower lips (green arrows in (b)), while a relatively high SNR can be preserved with adequate temporal resolution shown in (a).
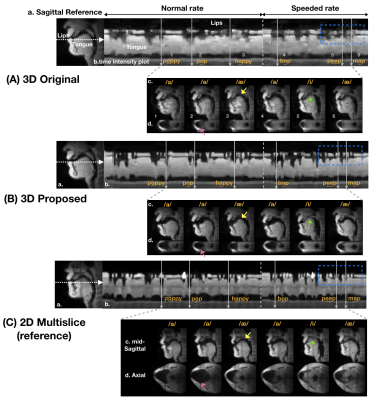
Figure 4 shows the stimuli results for the original 3D and proposed 3D methods, along with the interleaved 2D multi-slice method (reference). The sharp and clear boundaries in time intensity plots for the proposed method (blue-dotted box) indicate the significant visualization improvements. The shape of fast lip and tongue movements during natural utterances are captured using the proposed 3D technique.
CONCLUSION
We have demonstrated 3D RT-MRI of the vocal tract with improved spatio-temporal resolution achieved by using randomized variable density stack-of-spiral sampling, combined with a spatially and temporally constrained reconstruction. Improved capture and visualization of several speech tasks is achieved including notably during fast lip and tongue movements.Acknowledgements
This work was supported by NIH Grant R01DC007124 and NSF Grant 1514544.References
[1]. Lingala, S. G., Sutton, B. P., Miquel, M. E. & Nayak, K. S. Recommendations for real-time speech MRI. J. Magn Reson Imag. 2016;43:28–44.
[2]. Niebergall A, Zhang S, Kunay E, Keydana G, Job M, Uecker M, Frahm J. Real-time MRI of speaking at a resolution of 33 ms: Undersampled radial FLASH with nonlinear inverse reconstruction. Magn Reson Med. 2013;69:477–485.
[3]. Burdumy M, Traser L, Burk F, Richter B, Echternach M, Korvink JG, Hennig J, Zaitsev M. One-second MRI of a three-dimensional vocal tract to measure dynamic articulator modifications. J Magn Reson Imag. 2017;46:94-101.
[4]. Lim, Y. et al. 3D dynamic MRI of the vocal tract during natural speech. Magn Reson Med. 2019;81:1511–1520.
[5]. Tamir JI, Ong F, Cheng JY, Uecker M, Lustig M. Generalized magnetic resonance image reconstruction using the Berkeley advanced reconstruction toolbox. ISMRM Workshop on Data Sampling and Image Reconstruction, Sedona, AZ, 2016.
[6]. Kim, Y. C., Proctor, M. I., Narayanan, S. S. & Nayak, K. S. Improved imaging of lingual articulation using real-time multislice MRI. J. Magn Reson Imaging. 2012;35:943–948.
[7]. Lingala SG, Toutios A, Toger J, Lim Y, Zhu Y, Kim YC, Vaz C, Narayanan SS, Nayak KS. State-of-the-art MRI protocol for comprehensive assessment of vocal tract structure and function. In Proceedings of the Annual Conference of INTERSPEECH, San Francisco, CA, USA, 2016. pp. 475–479.
Figures
