0608
Magnetization transfer enhanced functional contrast for short TE fMRI1Donders Institute for Brain, Cognition and Behaviour, Radboud University Nijmegen, Nijmegen, Netherlands, 2Erwin L. Hahn Institute for Magnetic Resonance Imaging, University Duisburg-Essen, Essen, Germany
Synopsis
Magnetization-transfer can be used to suppress tissue signal but not blood. This sensitises the signal to CBV variations. By minimising TE we can maximise the sensitivity to CBV variation while minimising BOLD contrast. We implemented a short TE (7.5 ms) GE-EPI protocol with MT preparation, and performed a brain activation study on three healthy volunteers using a visual stimulus paradigm. Tissue suppression factors of typically 53% were achieved with MT-on. Both MT-on and -off conditions gave significant activation owing to residual BOLD contrast in MT-off. However, the group level contrast MT-on > MT-off gave standard activation maps with significant activation.
Purpose
Magnetization transfer (MT)1 generates unique contrast in magnetic resonance imaging (MRI) experiments and is an established technique for tissue suppression in time-of-flight angiography 2. As blood does not contain an appreciable pool of bound protons, its signal is unaffected by the phenomenon, contrary to the surrounding tissue. MT-weighted signal should hence be sensitised to CBV changes with maximal sensitivity at TE=0. In this abstract, we examine the use of MT-contrast for brain activation studies performed at short TE.Methods
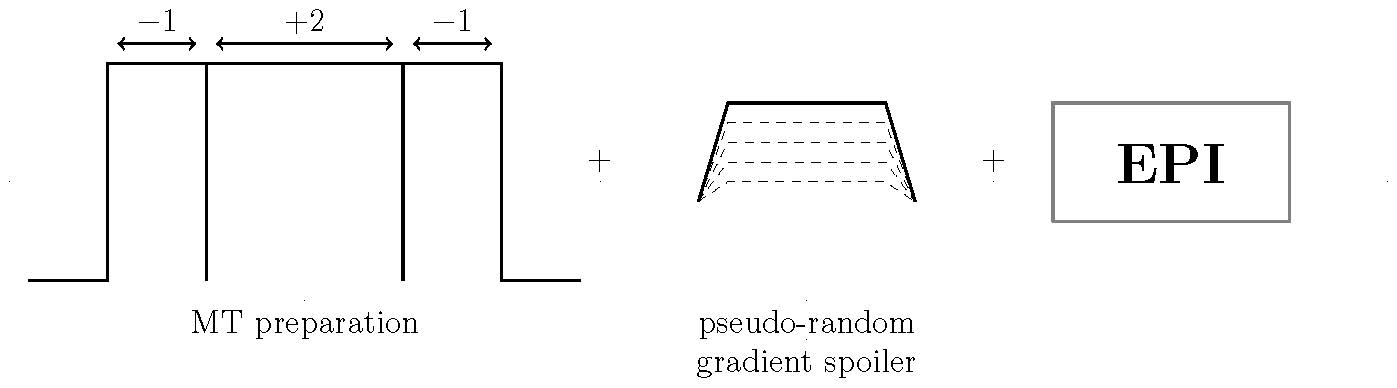
Prior to the excitation pulse in a 2D echo planar imaging (EPI) sequence, a zero-degree MT-preparation module was implemented to suppress the grey and white matter signal, together with a pseudo-random gradient spoiler to removes undesired echoes (see fig.1). MT-EPI was evaluated with the MT-preparation on or off using the following parameters: 48 slices, res 3mm iso, 80x80 matrix, TE/TR 7.5ms/1650ms, TA=10:54min, PF 6/8, GRAPPA 3, excitation FA 50°, MT-FA -67°/+136°/-67°, BW=2718 Hz/px, FatSat on. Additionally a MPRAGE was acquired at 1mm isotropic resolution and TE/TR/TA/T1 =3ms/2300ms/5min/900ms.Task fMRI-experiment
Full checkerboard and right/left hemifield checkerboard randomly distributed across trials with a block-design of 10s on, 18-22s off (random inter stimulus interval). The short TE of 7.5ms for the MT-EPI maximizes the sensitivity to CBV and reduces BOLD-contamination. If we assume that tissue and blood signals are unaffected by activation, the differential sensitivity (at TE=0) is given by
$$\frac{\Delta S_{\text{total}}}{\Delta \text{CBV}} = \ S_{\text{blood}} \ - \ \left( 1-\beta_{\text{MTC}} \right) S_{\text{tissue}} $$
where $$$\beta_{\text{MTC}} $$$ is the MTC suppression factor. Hence, an increase in CBV will result in an increase in signal and will be additive to any BOLD signal contribution.
Data Analysis
Data from three subjects (2M/1F 28 ± 4) were analyzed using FSL, 6.0.1 FEAT (FMRIB Software Library)3. Three contrasts were convolved with hemodynamic response, to find the activation in V1 for full-field, right V1 for left hemifield, and left V1 for right hemifield. The group-level analysis was carried out using FLAME performing a one-sample t-test across parameter estimate (PE) for each contrast, family-wise error corrected (FWE, z> 2.3). The difference in activation with MT on/off was performed by paired t-test within FLAME.
Results
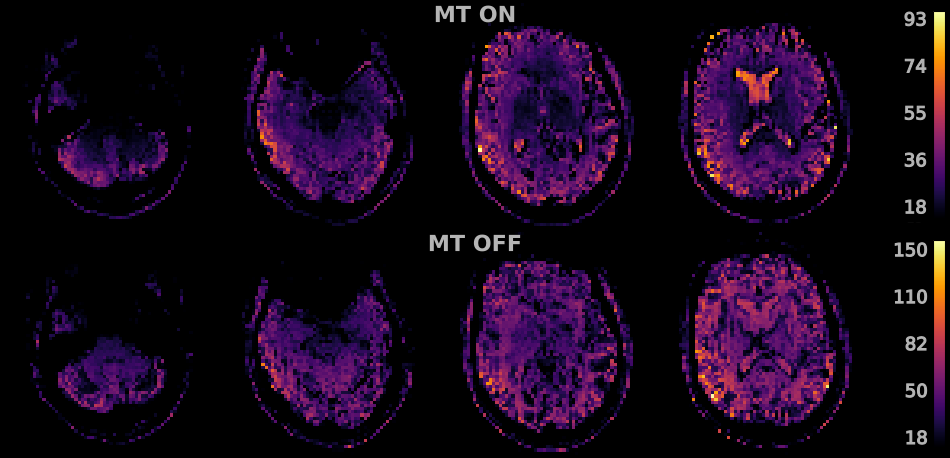
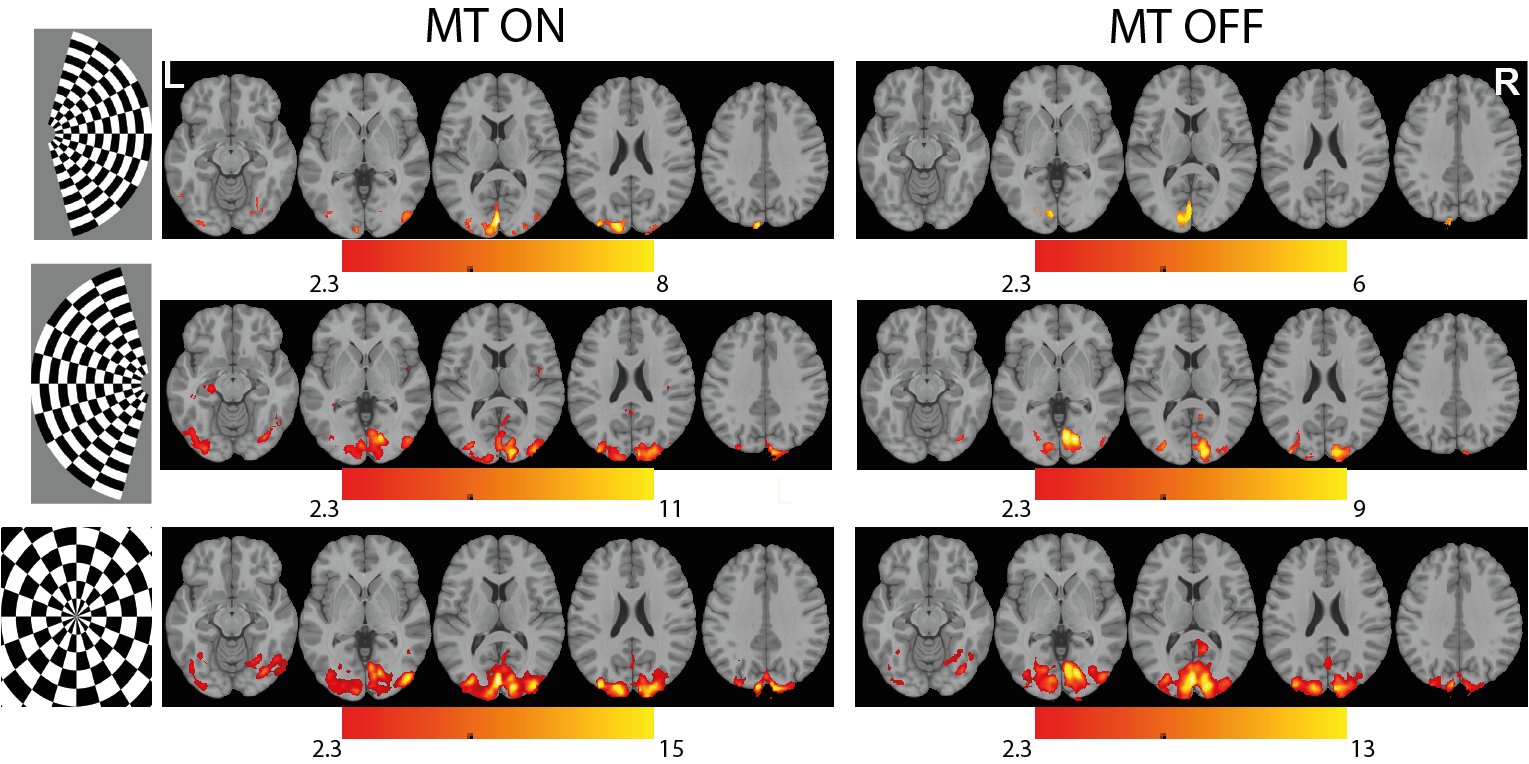
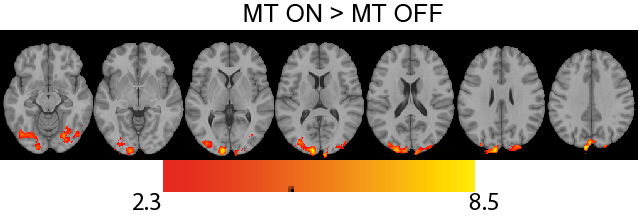
Figure 2 shows the tSNR maps for MT on/off. The MT-preparation module leads to a MTC suppression factor of the tissue of typically 54%. With MT-on, we also noticed 54% increase in SAR in comparison to 11% for MT-off, induced by the MT-preparation pulse. Figure 3 shows the group-level activation maps for MT-on and MT-off for the three different visual stimuli. MT-on and MT-off both give significant activation owing to the residual BOLD contrast in MT-off. However, at the group level the contrast MT-on > MT-off shows significant results throughout the visual cortex while no significantly activated voxels were found for the contrast MT-off > MT-on (see figure 4).Discussion
Changes in CBV during brain activation can be expected to occur in the arterioles and capillaries4, and can thus be expected to have a better spatial localization than BOLD, which is dominated by the downstream vasculature. MT contrast is easily incorporated in many pulse sequences, and will generally have a more efficient acquisition than VASO5: which uses a time-consuming inversion-recovery to null the blood signal. Furthermore, using MT-suppression makes the CBV contribution additive to BOLD, potentially allowing the user to mix the contrasts without loss of sensitivity. In the current implementation we could only achieve a TE of 7.5ms, which assuming a tissue T2* of 35 ms will give approximately 30% of the BOLD sensitivity for the MT-off condition (using a simple exponential model). With MT-on the extravascular BOLD contribution will be further reduced by the MT suppression factor. This makes it still more remarkable that with only three subjects the MT-on>MT-off contrast gives such an unequivocal result.Conclusion
The use of MT-preparation offers the potential to both improve the intrinsic spatial resolution of brain activation studies, and also to improve image quality by reducing or eliminating signal drop-outs.Acknowledgements
No acknowledgement found.References
1. Wolff SD, Balaban RS. Magnetization transfer contrast (MTC) and tissue water proton relaxation in vivo. Magn Reson Med.1989; 10: 135–144 2.
2. Edelman RR, Ahn SS, Chien D, et al. Improved time-of-flight MR angiography of the brain with magnetization transfer contrast. Radiology 1992; 184: 395-399.
3. Jenkinson M, Beckmann CF, Behrens TE, et al. FSL. NeuroImage, 62:782-90, 2012.
4. Kim T, Hendrich KS, Masamoto K, Kim SG. Arterial versus total blood volume changes during neural activity-induced cerebral blood flow change: implication for BOLD fMRI. Journal of cerebral blood flow and metabolism : official journal of the International Society of Cerebral Blood Flow and Metabolism 2007; 27: 1235-1247.
5.
Lu H, Golay X, Pekar JJ, van Zijl
PCM. Functional magnetic resonance
Imaging based on changes in vascular space occupancy. Magn Reson Med 2003; 50: 263-274.
Figures