0593
Prognosis of Focused Ultrasound Ablation Therapy Adenomyosis by Radiomics
Jing Zhang1, Zhicong Li2, Yang Song1, Han Wang2, Yefeng Yao1, and Guang Yang1
1Shanghai Key Laboratory of Magnetic Resonance, Department of Physics, East China Normal University, shanghai, China, 2Department of Radiology, Shanghai General Hospital, Shanghai Jiao Tong University School of Medicine, shanghai, China
1Shanghai Key Laboratory of Magnetic Resonance, Department of Physics, East China Normal University, shanghai, China, 2Department of Radiology, Shanghai General Hospital, Shanghai Jiao Tong University School of Medicine, shanghai, China
Synopsis
Patients with adenomyosis can be treated using Magnetic Resonance Imaging (MRI)-guided Focused Ultrasound Surgery (MRgFUS). However, note all patients have a good response to MRgFUS, some even equire pain management such as with Non-Steroidal Anti-inflammatory Drugs (NSAIDs) following MRgFUS. To evaluate the prognosis of MRgFUS using only MRI images, we used radiomics features together with clinical features to build a machine learning model with our homemade open-source software, namely FeAture Explorer (FAE), based on scikit-learn. We obtained a candidate model with AUC of 0.806 in test cohort.
INTRODUCTION
Adenomyosis is a common benign gynecologic disease characterized by the presence of ectopic endometrial glands and stroma within the myometrium1. Magnetic resonance imaging-guided focused ultrasound surgery (MRgFUS) plays a great role in treatment of adenomyosis with non-invasive way2. However, in our experience, only 32% of patients still require pain management such as Non-Steroidal Anti-inflammatory Drugs (NSAIDs) following MRgFUS 3,4. It would be useful to determine in advance which patients are likely to have a complete response with MRgFUS and which will not.METHODS
Data: 69 patients (mean age, 38.6 years; age range, 26–50 years) with adenomyosis treated by MRgFUS were reviewed and allocated to training (70%) and testing cohorts (30%). Good response (GR) was achieved in 47 patients (68.1%) and failed in 22 patients (38.9%).Analysis: Radiomics feature were extracted by PyRadiomics in Python3.65. Since there are a numerous number of combinations of algorithms and hyper-parameters to explorer to find the best model for classification, we used a homemade open-source tool named FeAture Explorer (FAE, https://github.com/salan668/FAE). Features dimension was reduced by Pearson Correlation Coefficient after feature normalization. Analysis of variance and logistical regression were used for feature selection by 5 cross-validation in the training cohort, and a supported vector machine model was built for comparing radiomics model and radiomics-clinical model in which we combined survived radiomics features and clinical parameters.
Evaluation: Discrimination result of model was obtained by bootstrap, receiver operating characteristic (ROC) curve, area under the curve (AUC) and decision curve analysis (DCA). We evaluated the the model performance in both the training and testing cohorts.
RESULTS
1118 radiomics features were extracted from T2-weighted imaging (T2WI) before MRgFUS. The radiomics model comprised 4 selected features and demonstrated a degree of prediction capability of patients’ non-GR to MRgFUS treatment. The radiomics model shows AUC value of 0.67 (95% confidence intervals, CIs), 0.619-0.774) in the testing cohort, but the radiomics-clinical model showed good discrimination, with an AUC of 0.81 (95% CIs, 0.774-0.857) in the testing cohort. DCA also showed favorable performance of the radiomics-clinical model.DISCUSSION
In the testing cohort, the prediction accuracy of the Radiomics-Clinical Model is 0.762, while the accuracy of the Radiomics model is only 0.619, which demonstrated that the combined model achieved better predictive performance than radiomics features alone. We also used the above formula to calculate the risk probability of non-GR in patients. In addition, the decision curve analysis showed that the Radiomics-Clinical Model demonstrated greater benefit for the cohort of patients with adenomyosis in a substantial range of threshold probability, compared with the “treat all” or “treat none” strategies. It demonstrates that MRI can not only serve as a tool to diagnose and treat adenomyosis, but can also be used to predict the effectiveness of MRgFUS treatment. Thus, MRI can play an integrated role in the whole process of diagnosis, treatment decision-making and MRgFUS treatment to improve patients’ symptoms and reduce unnecessary medical cost.CONCLUSION
A prediction model composed of T2WI-based radiomics features and clinical parameters could be applied to guide radiologists to evaluate MRgFUS for patients with adenomyosis who will achieve good response.Acknowledgements
This project is supported by National Natural Science Foundation of China (61731009, 81771816).References
- Garavaglia E, Audrey S, Annalisa I, et al. Adenomyosis and its impact on women fertility. Iranian journal of reproductive medicine. 2015;13(6):327-36.
- Cline HE, Hynynen K, Watkins RD, et al. Focused US system for MR imaging-guided tumor ablation. Radiology. 1995;194(3):731-7
- Fan TY, Zhang L, Chen W, et al. Feasibility of MRI-guided high intensity focused ultrasound treatment for adenomyosis. European journal of radiology. 2012;81(11):3624-30.
- Zhou M, Chen JY, Tang LD, Chen WZ, Wang ZB. Ultrasound-guided high-intensity focused ultrasound ablation for adenomyosis: the clinical experience of a single center. Fertility and sterility. 2011;95(3):900-5
- Van Griethuysen, J. J. M., Fedorov, A., Parmar, C., Hosny, A., Aucoin, N., Narayan, V., Beets-Tan, R. G. H., Fillon-Robin, J. C., Pieper, S., Aerts, H. J. W. L. (2017). Computational Radiomics System to Decode the Radiographic Phenotype. Cancer Research, 77(21), e104–e107.
Figures
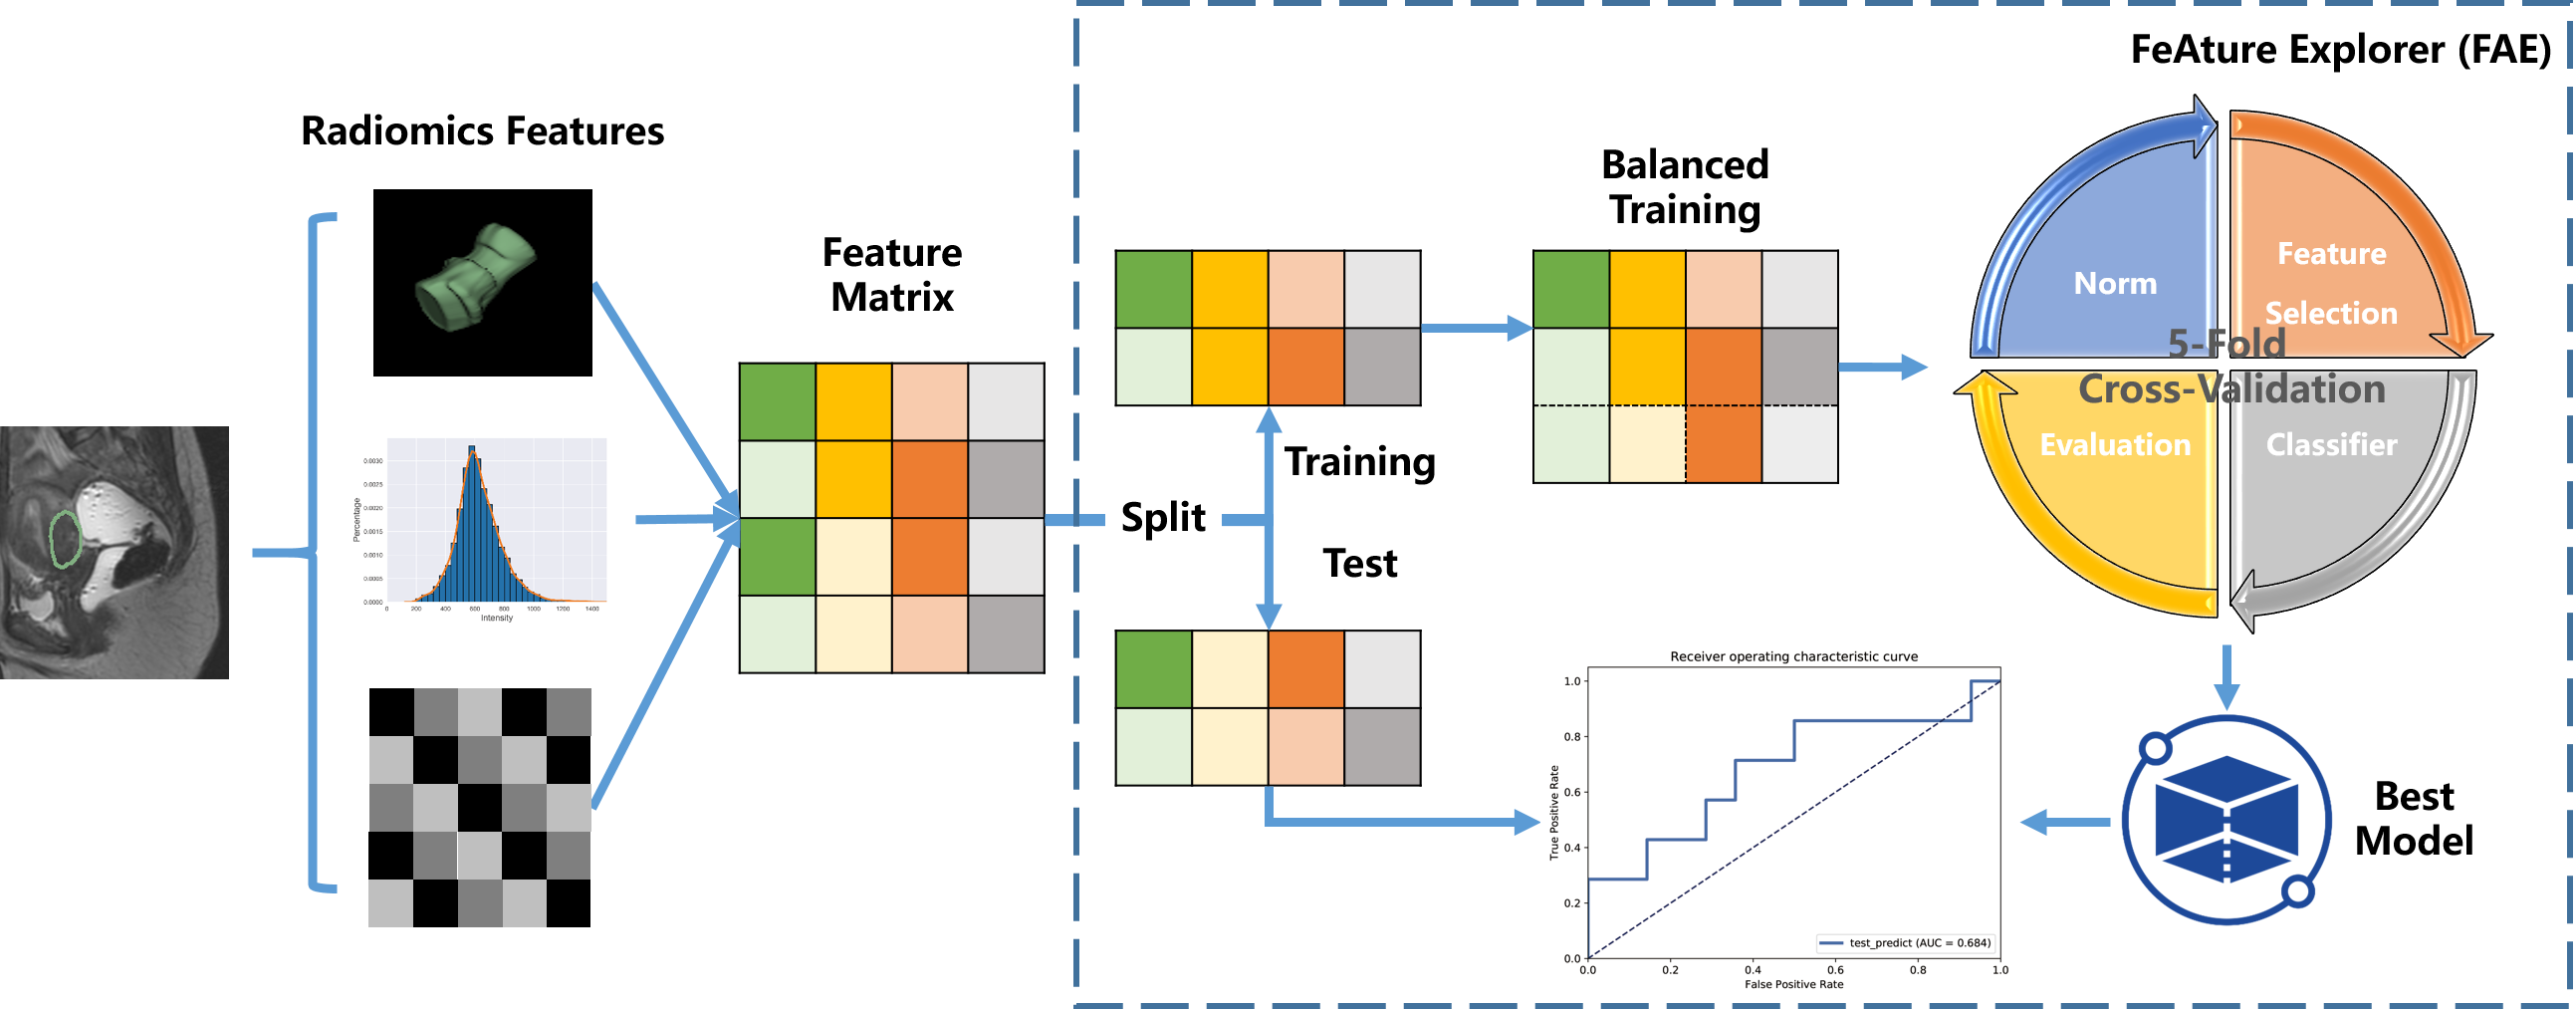
Figure 1 workflow for Analysis. It includes 2 main parts: Radiomics feature
extraction, the feature extracted from original preprocess and classification
building via FAE.
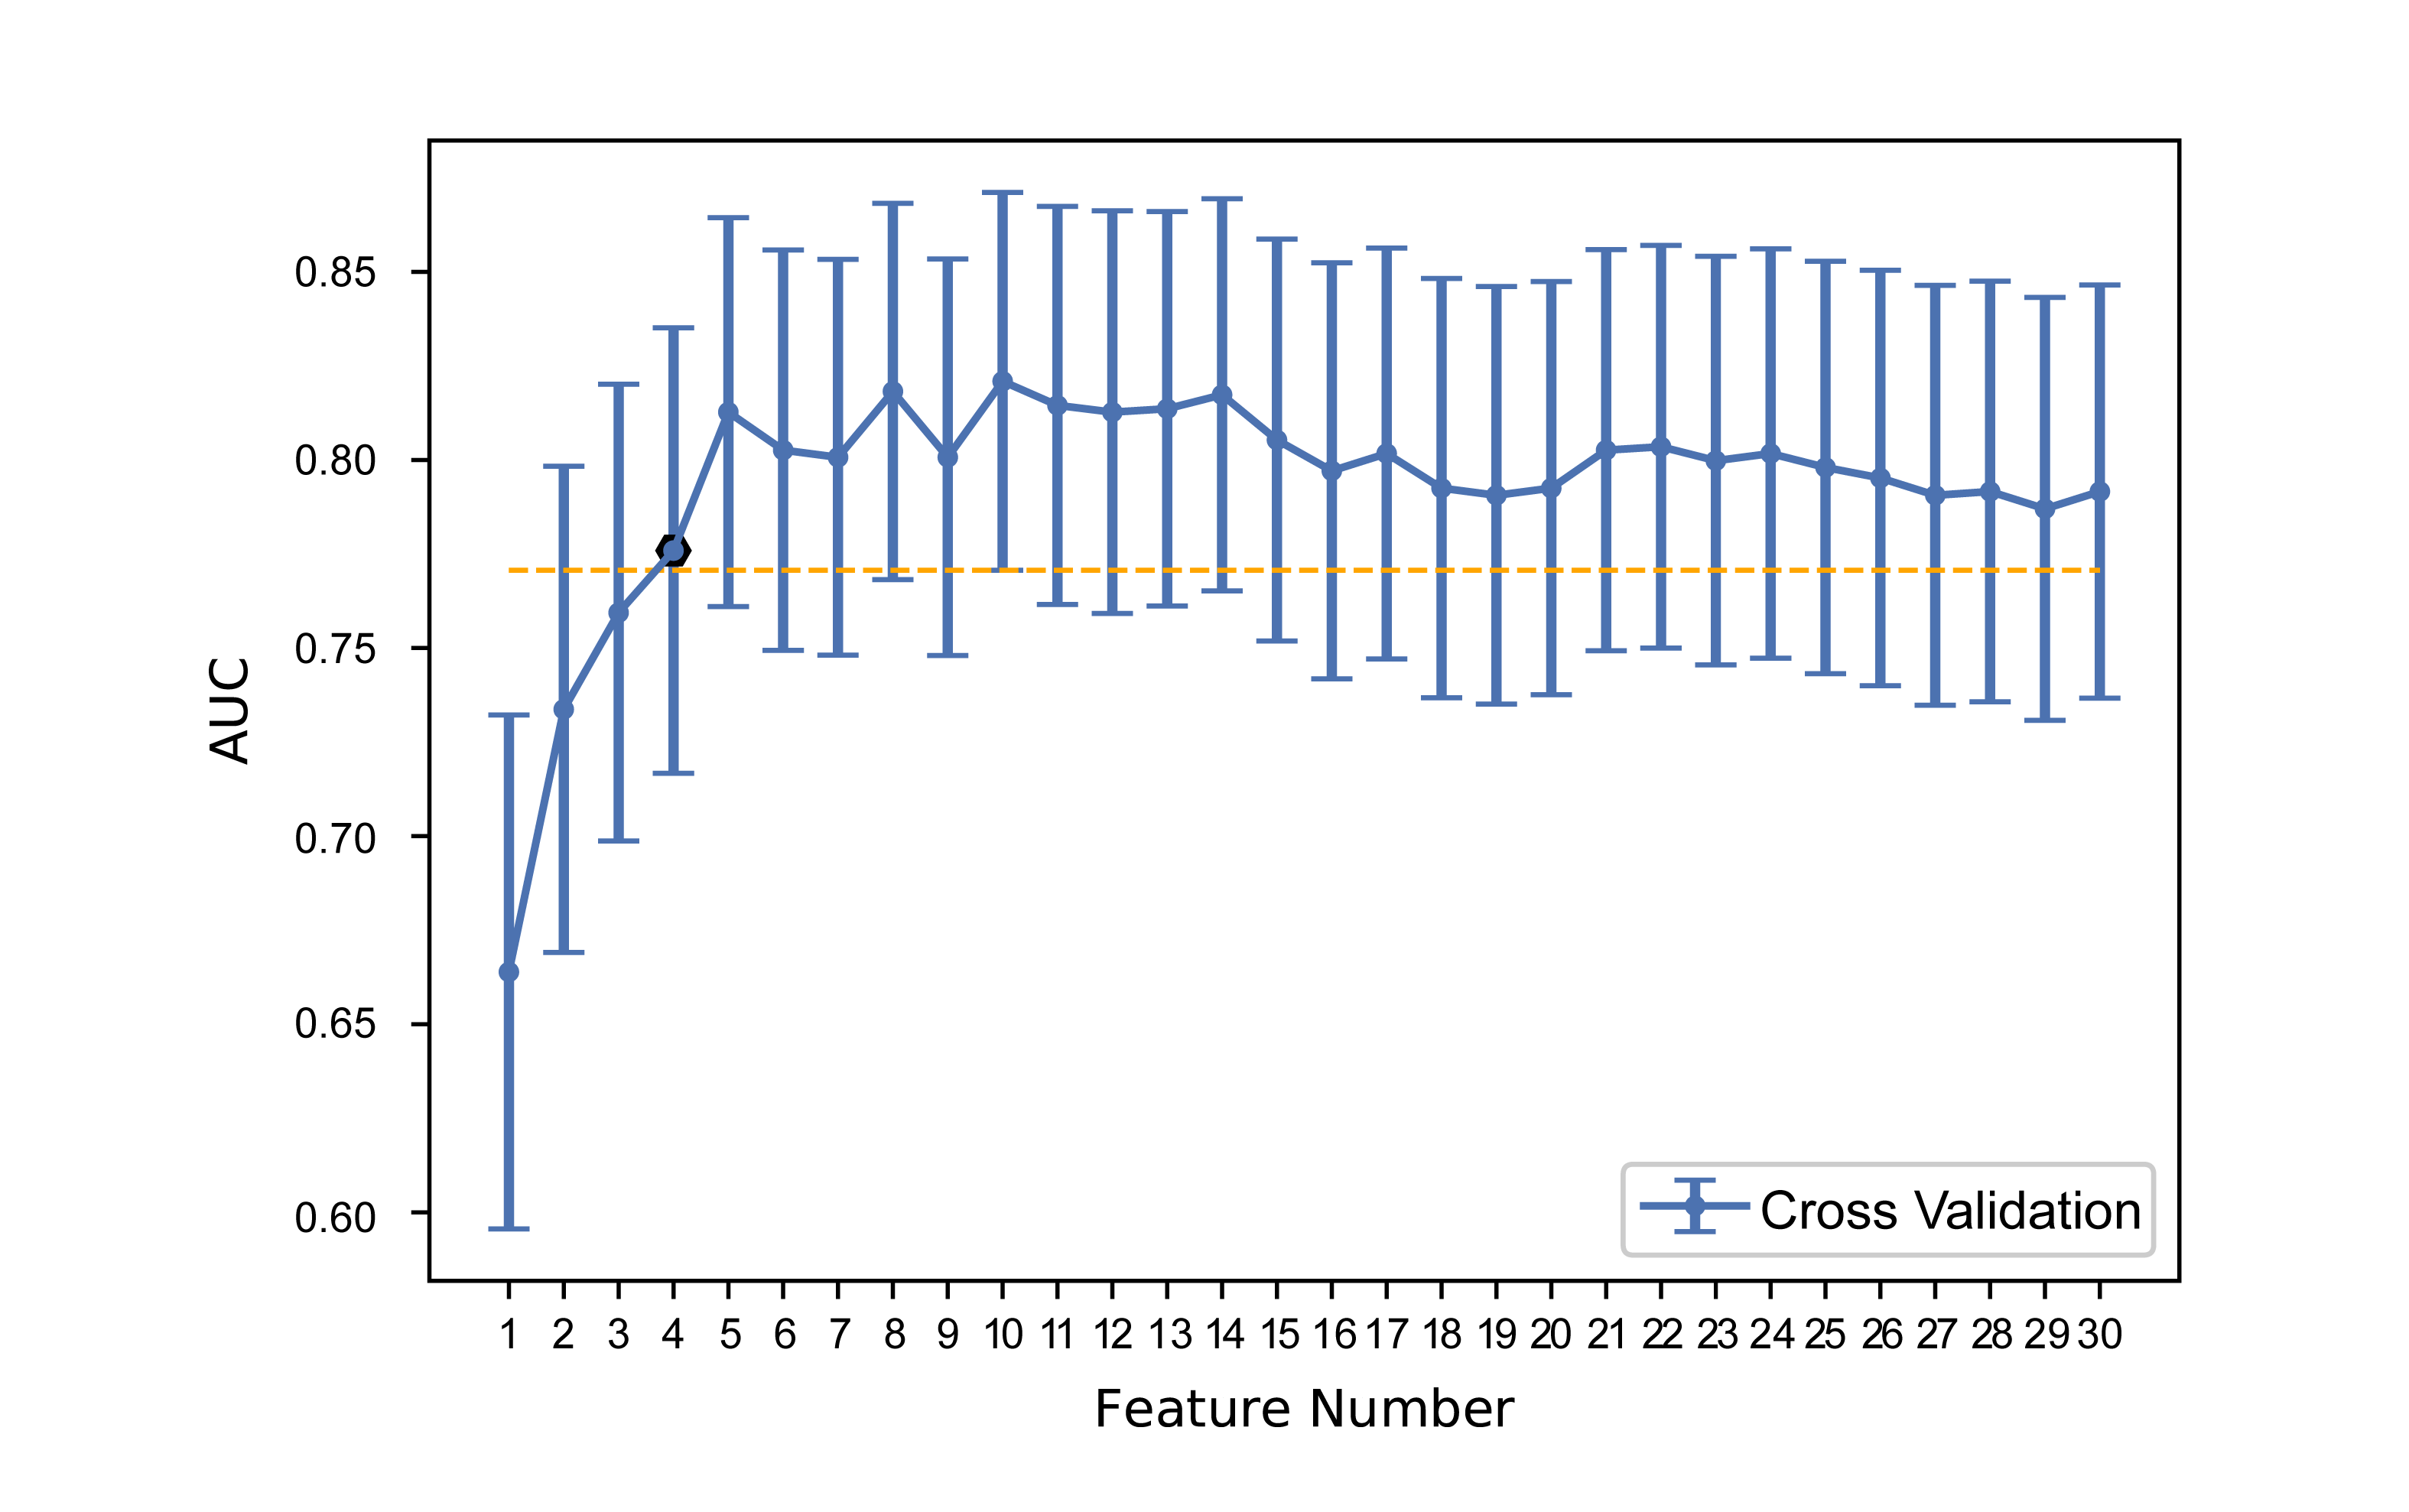
Figure 2 Tuning feature number in the LR model used to perform 5-fold
cross-validation via one-standard-error rule. We calculated standard error of
AUC value among 20 feature number in training cohort by 1000 bootstrap, the
minimum candidate feature numbers
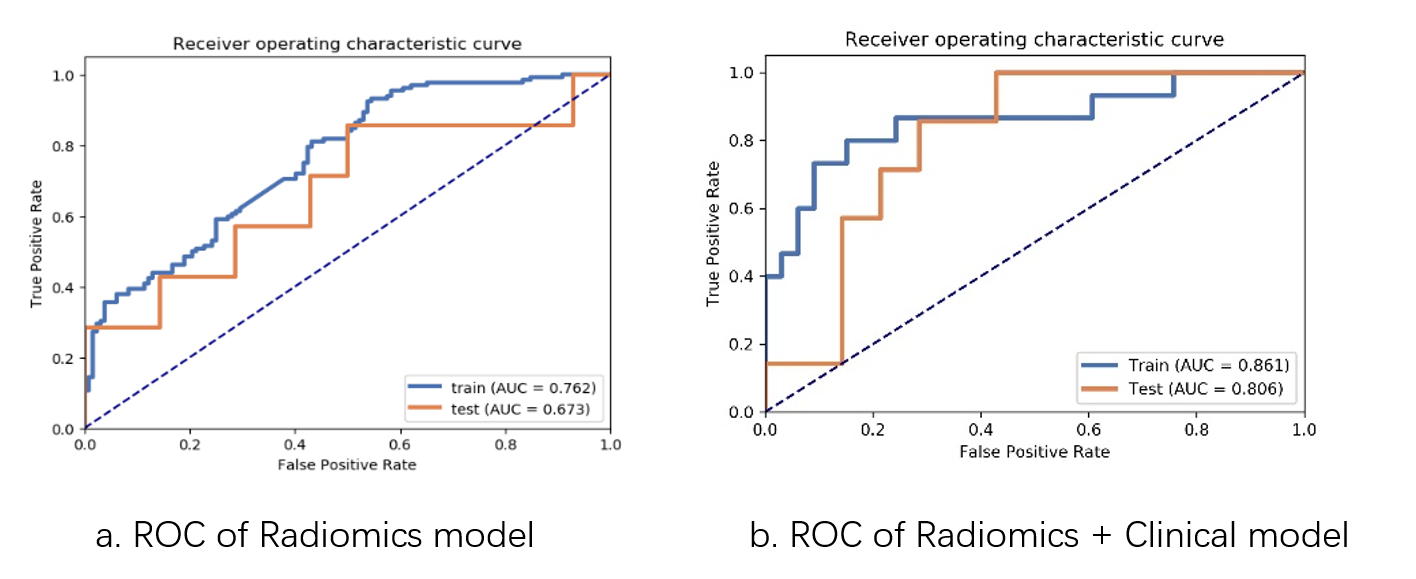
Figure 3 (a) MR model reached an AUC of 0.762 in the training cohort, and an
AUC of 0.673 in the testing cohort. (b) Radiomics-Clinical model reached the
highest AUC of 0.861 in the training cohort, and the highest AUC of 0.806in the
testing cohort. AUC: area under the receiver operating characteristic curve. AUC:
area under the receiver operating characteristic curve.

Table 1 Performance of the
Radiomics model and Radiomics-Clinical model
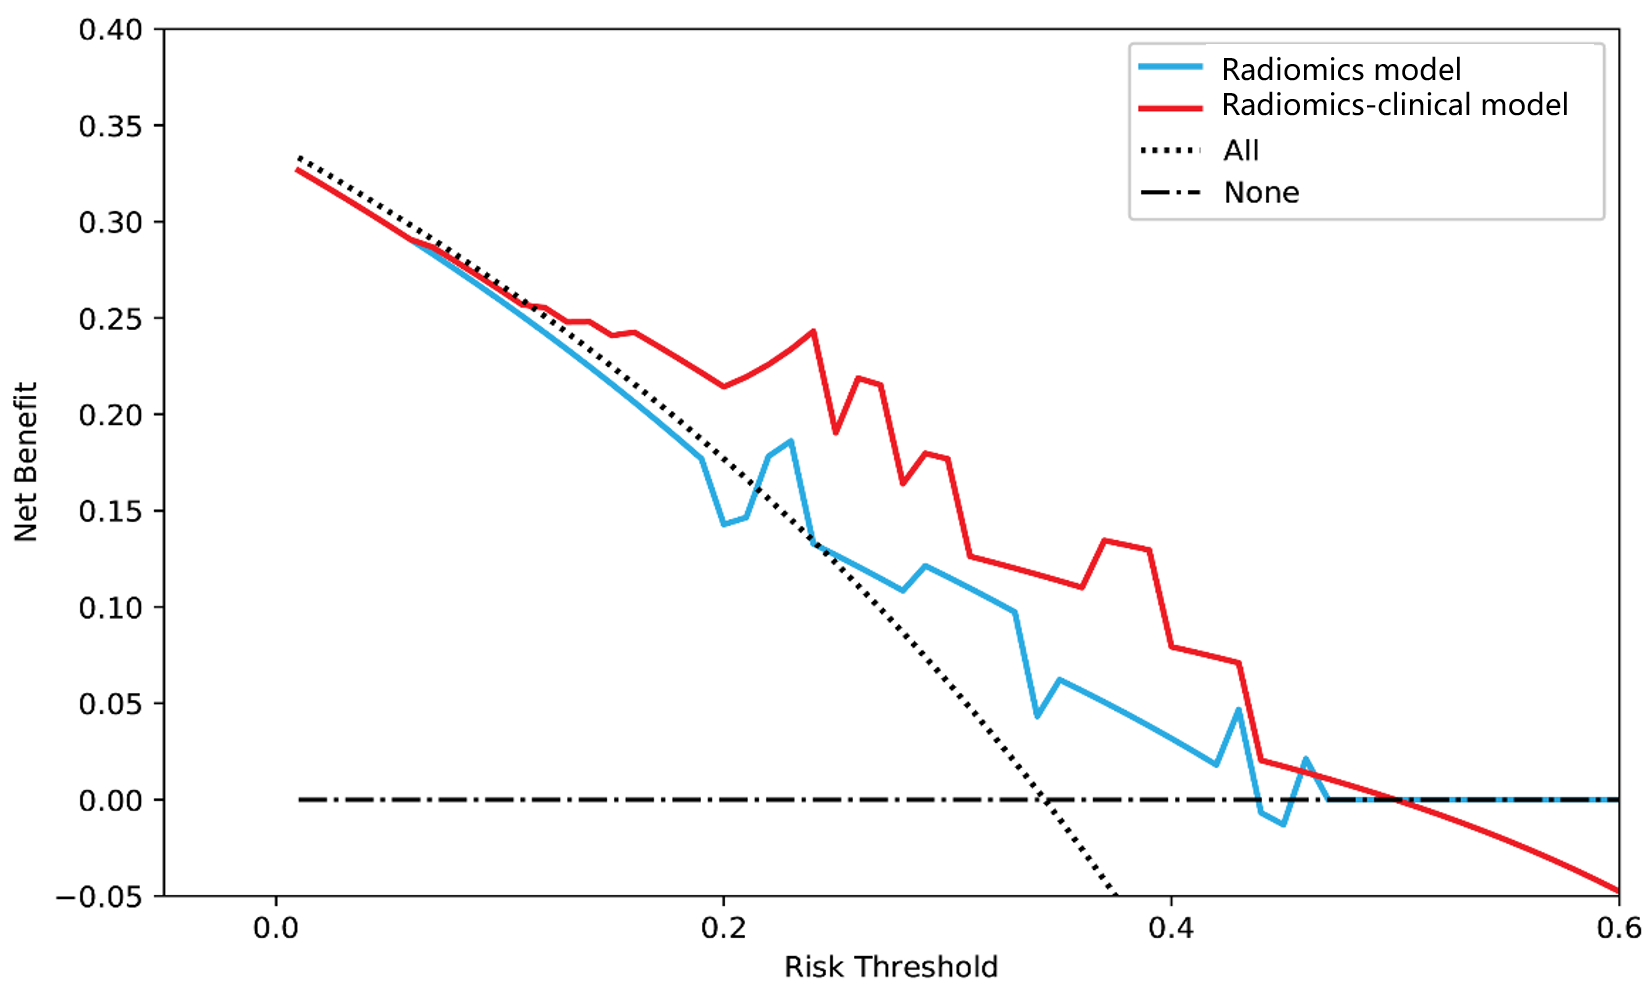
Figure 4 Decision curve analysis for each model in
the testing dataset. The y-axis measures the net benefit, which is calculated
by summing the benefits (true-positive findings) and subtracting the harms
(false-positive findings), weighting the latter by a factor related to the
relative treatment. The decision curve showed that if the threshold probability
is in 0.1-0.5, the application of radiomics-clinical adds more benefit than
treating all or none of the patients and MR model.