0590
Comparative Analysis of the Value of APTWI and DKI in Evaluating the Histological Features of Uterus Cervical Cancer1Department of Radiology, Zhengzhou University People’s Hospital & Henan Provincial People’s Hospital, Academy of Medical Sciences, Zhengzhou University, Zhengzhou, China, 2Department of MRI, the First Affiliated Hospital of Xinxiang Medical University, Weihui, China, 3Department of Radiology, Zhengzhou University People’s Hospital & Henan Provincial People’s Hospital, Zhengzhou, China, 4GE Healthcare, MR Research China, Beijing, China
Synopsis
Amide proton transfer-weighted imaging (APTWI) has unique advantages in displaying the metabolism of diseased proteins. Diffusion kurtosis imaging (DKI) can quantify the diffusion state water molecules in tissues with a non-gaussian model, thus correcting the deviation of the DWI model and improving the detection of lesions. Our results show that compared with APTWI, the DKI is more effective in evaluating the pathological and physiological characteristics of uterus cervical cancer (UCC).
Introduction
The uterus cervical cancer (UCC) is the third most common malignant tumor in the female reproductive system. The prognosis of UCC is closely related to the pathology type and the grade of differentiation1. Traditional multiple punch biopsy under vaginoscopy is susceptible to factors such as lesion size, sampling accuracy, and operator experience, which lead to certain differences between the results and final pathology 2. Amide proton transfer-weighted imaging (APTWI) could be employed to detect the free protein and peptide content in living tissue without the use of exogenous magnetic resonance contrast agent 3. Diffusion kurtosis imaging (DKI) is based on the non-Gaussian diffusion model, which can better address the problem of restricted water diffusion within the complex microstructure of biological tissues 4. At present, studies on the histological features of UCC have been mainly focused on a single MRI technique 5,6, and there are few comparative studies on APTWI and DKI in UCC. This research aims to explore the possibility of using APTWI and DKI to identify and diagnose cervical squamous carcinoma (CSC), cervical adenocarcinoma (CA), and different levels of CSC and CA, and to compare which technique has a better diagnostic effect.Materal and Methods
With pathological results as the gold standard, 112 patients were selected in this research, including 82 patients with CSC (46 with low level (20 of G1, 26 of G2), and 36 with high level (G3) and 30 patients with CA (14 with low level (5 of G1, 9 of G2), and 16 with high level (G3)). Studies were conducted on a 3.0 T MR scanner (Discovery MR750, GE Healthcare) with a 32 channel phased-array torso coil. The DKI sequence was set with the following parameters: TR, 2500 ms; TE, 79.3 ms; b-values, 0, 500, 1000, 1500, and 2000 s/mm2; and 30 uniformly distributed dispersion directions. After the DKI scan was completed, under the guidance of an experienced radiologist, all layers containing the tumor subject were scanned using the APTWI sequence layer by layer. The scanning parameters were as follows: TR, 3000 ms; TE, 12.0 ms; RF, 2.0 μT; saturation time, 500 ms (4 pulses were applied for saturation); frequency list, 5000, 5000, 5000, ±600, ±575, ±550, ±525, ±500, ±475, ±450, ±425, ±400, ±375, ±350, ±325, ±300, ±275, ±250, ±225, ±200, ±175, ±150, ±125, ±100, ±75, ±50, ±25 Hz. The ROI was placed to cover as many solid tumor parts as possible to avoid large vessels and hemorrhagic, calcified, cystic and necrotic areas.SPSS 23.0 and Medcalc 15.0 were used for data analysis. The independent sample t-test was applied for between-group analyses. The correlation between each parameter and histological grade was analyzed by using Spearman correlation coefficient. The ROC curve was generated to evaluate each parameter’s diagnostic accuracy and threshold. The Delong method was used to compare the AUCs of different parameters. P<0.05 is considered statistically significant.Results
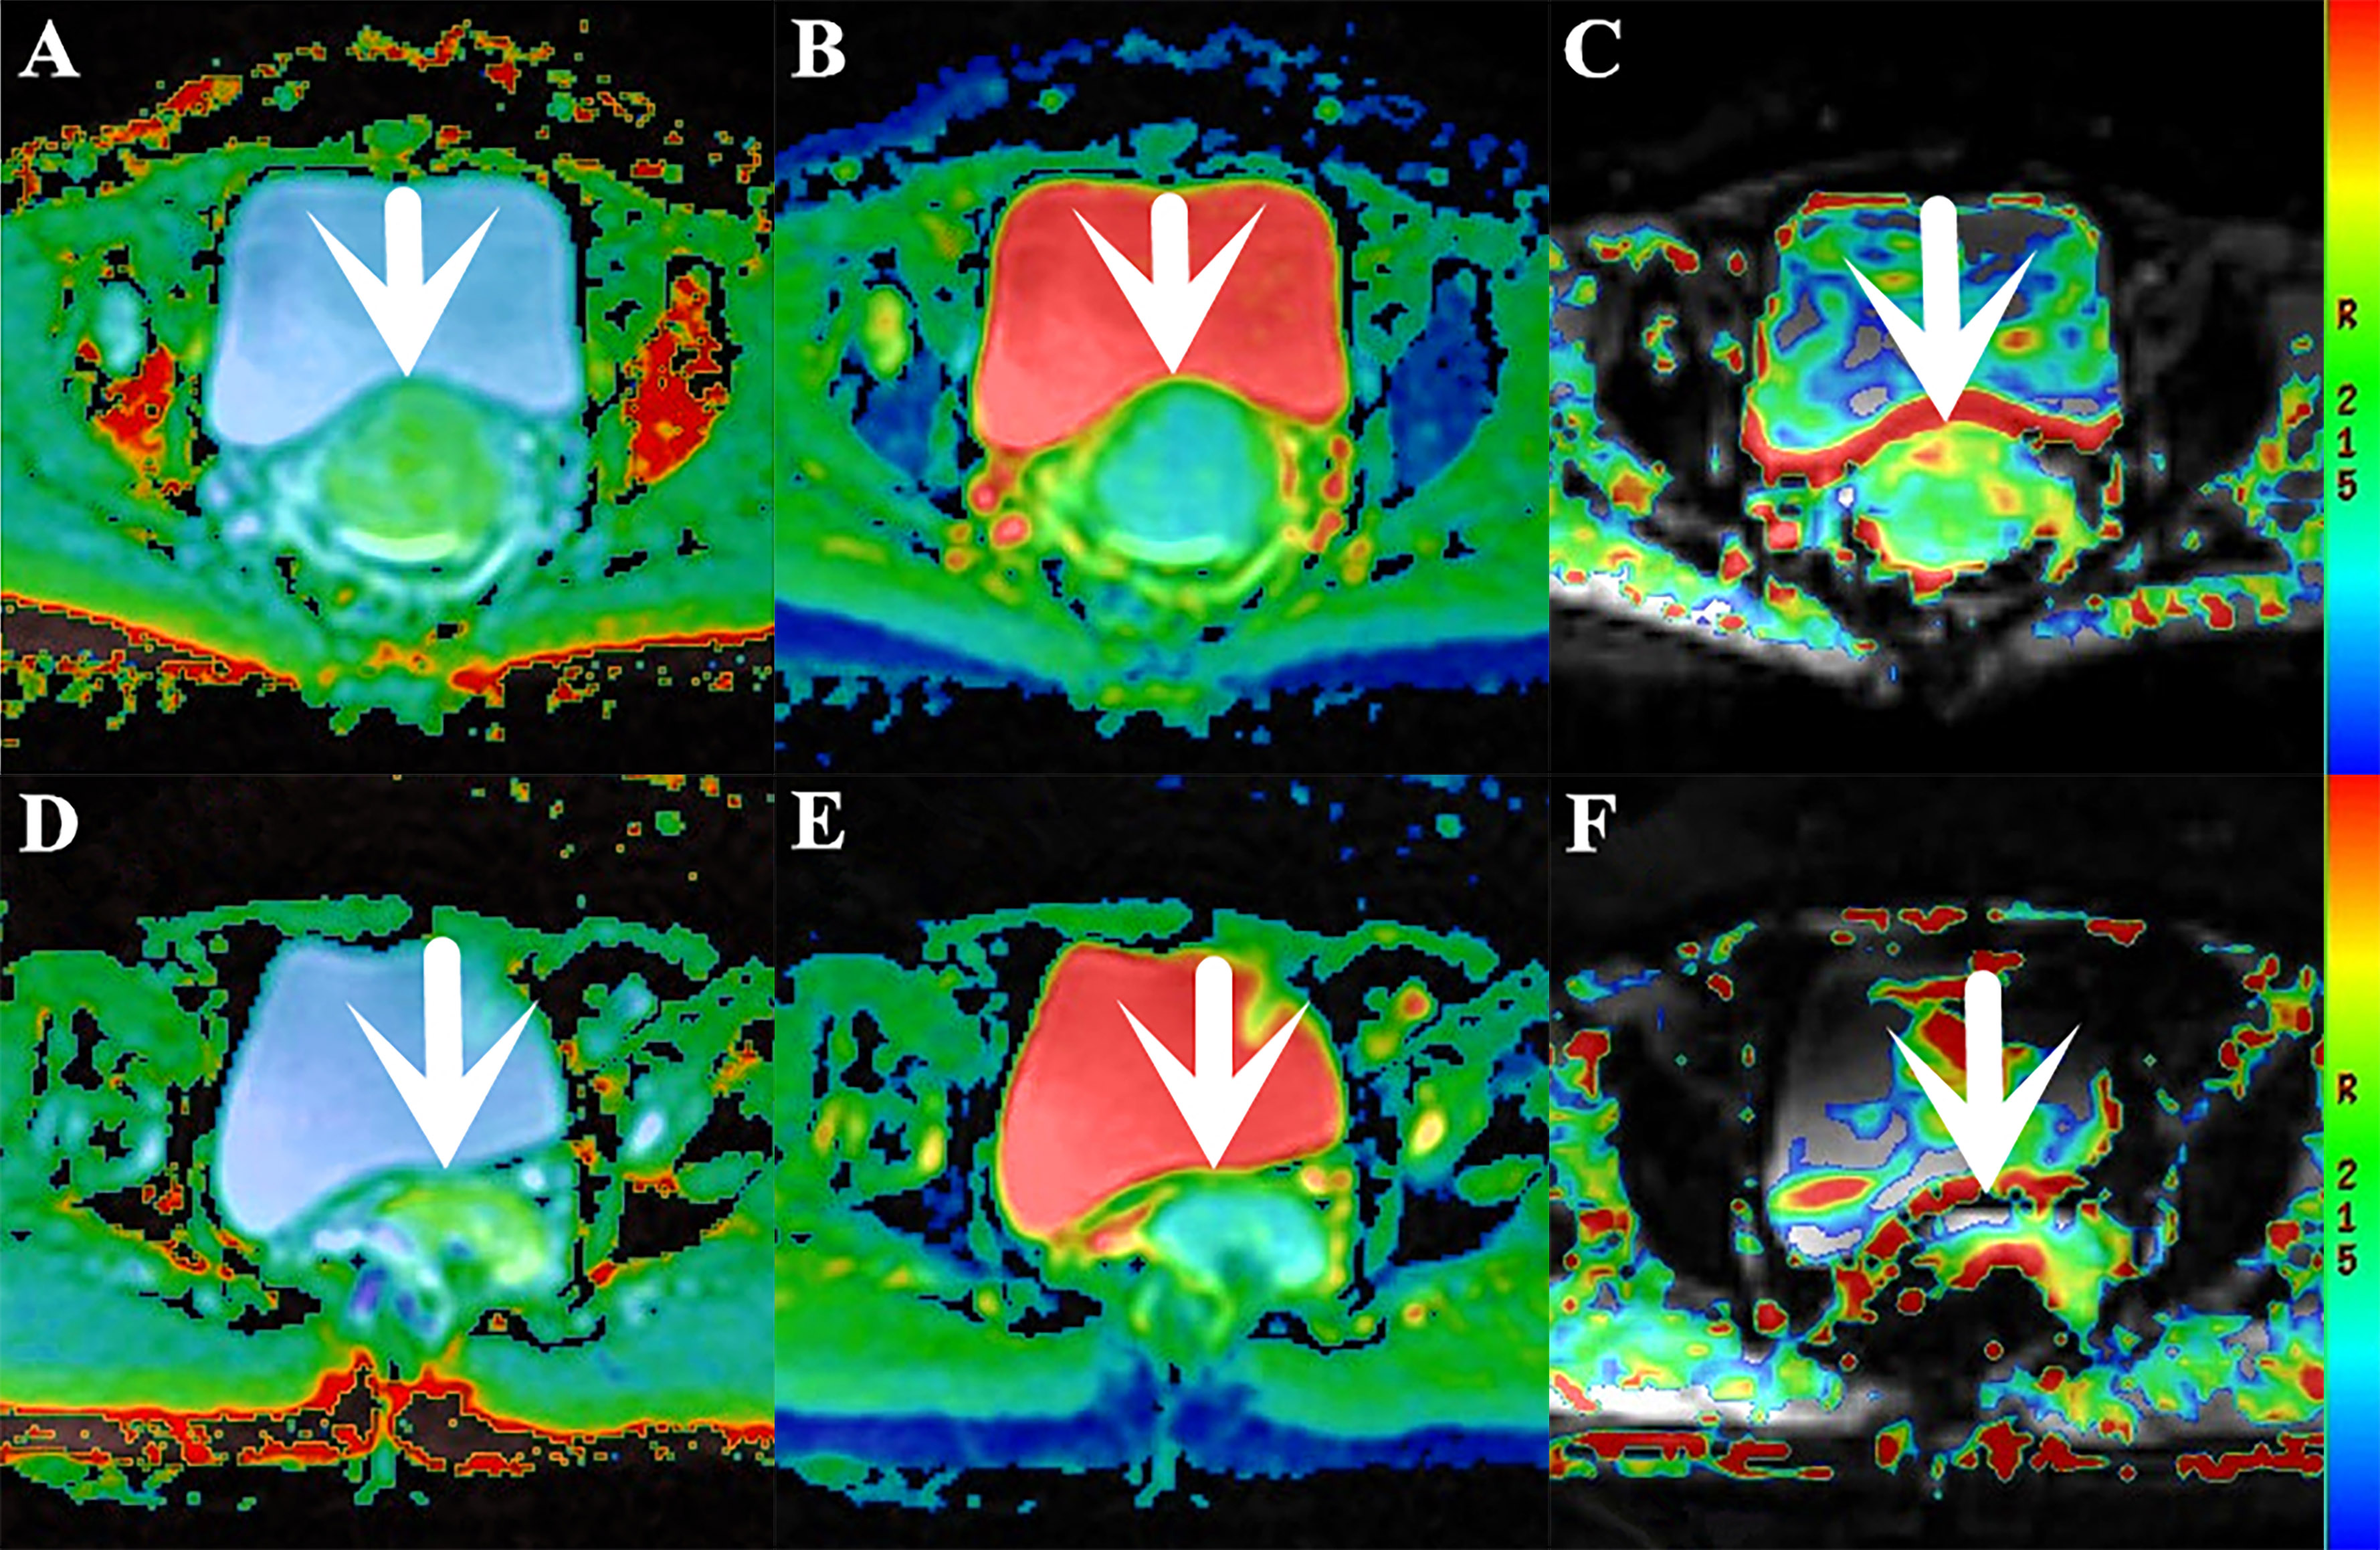
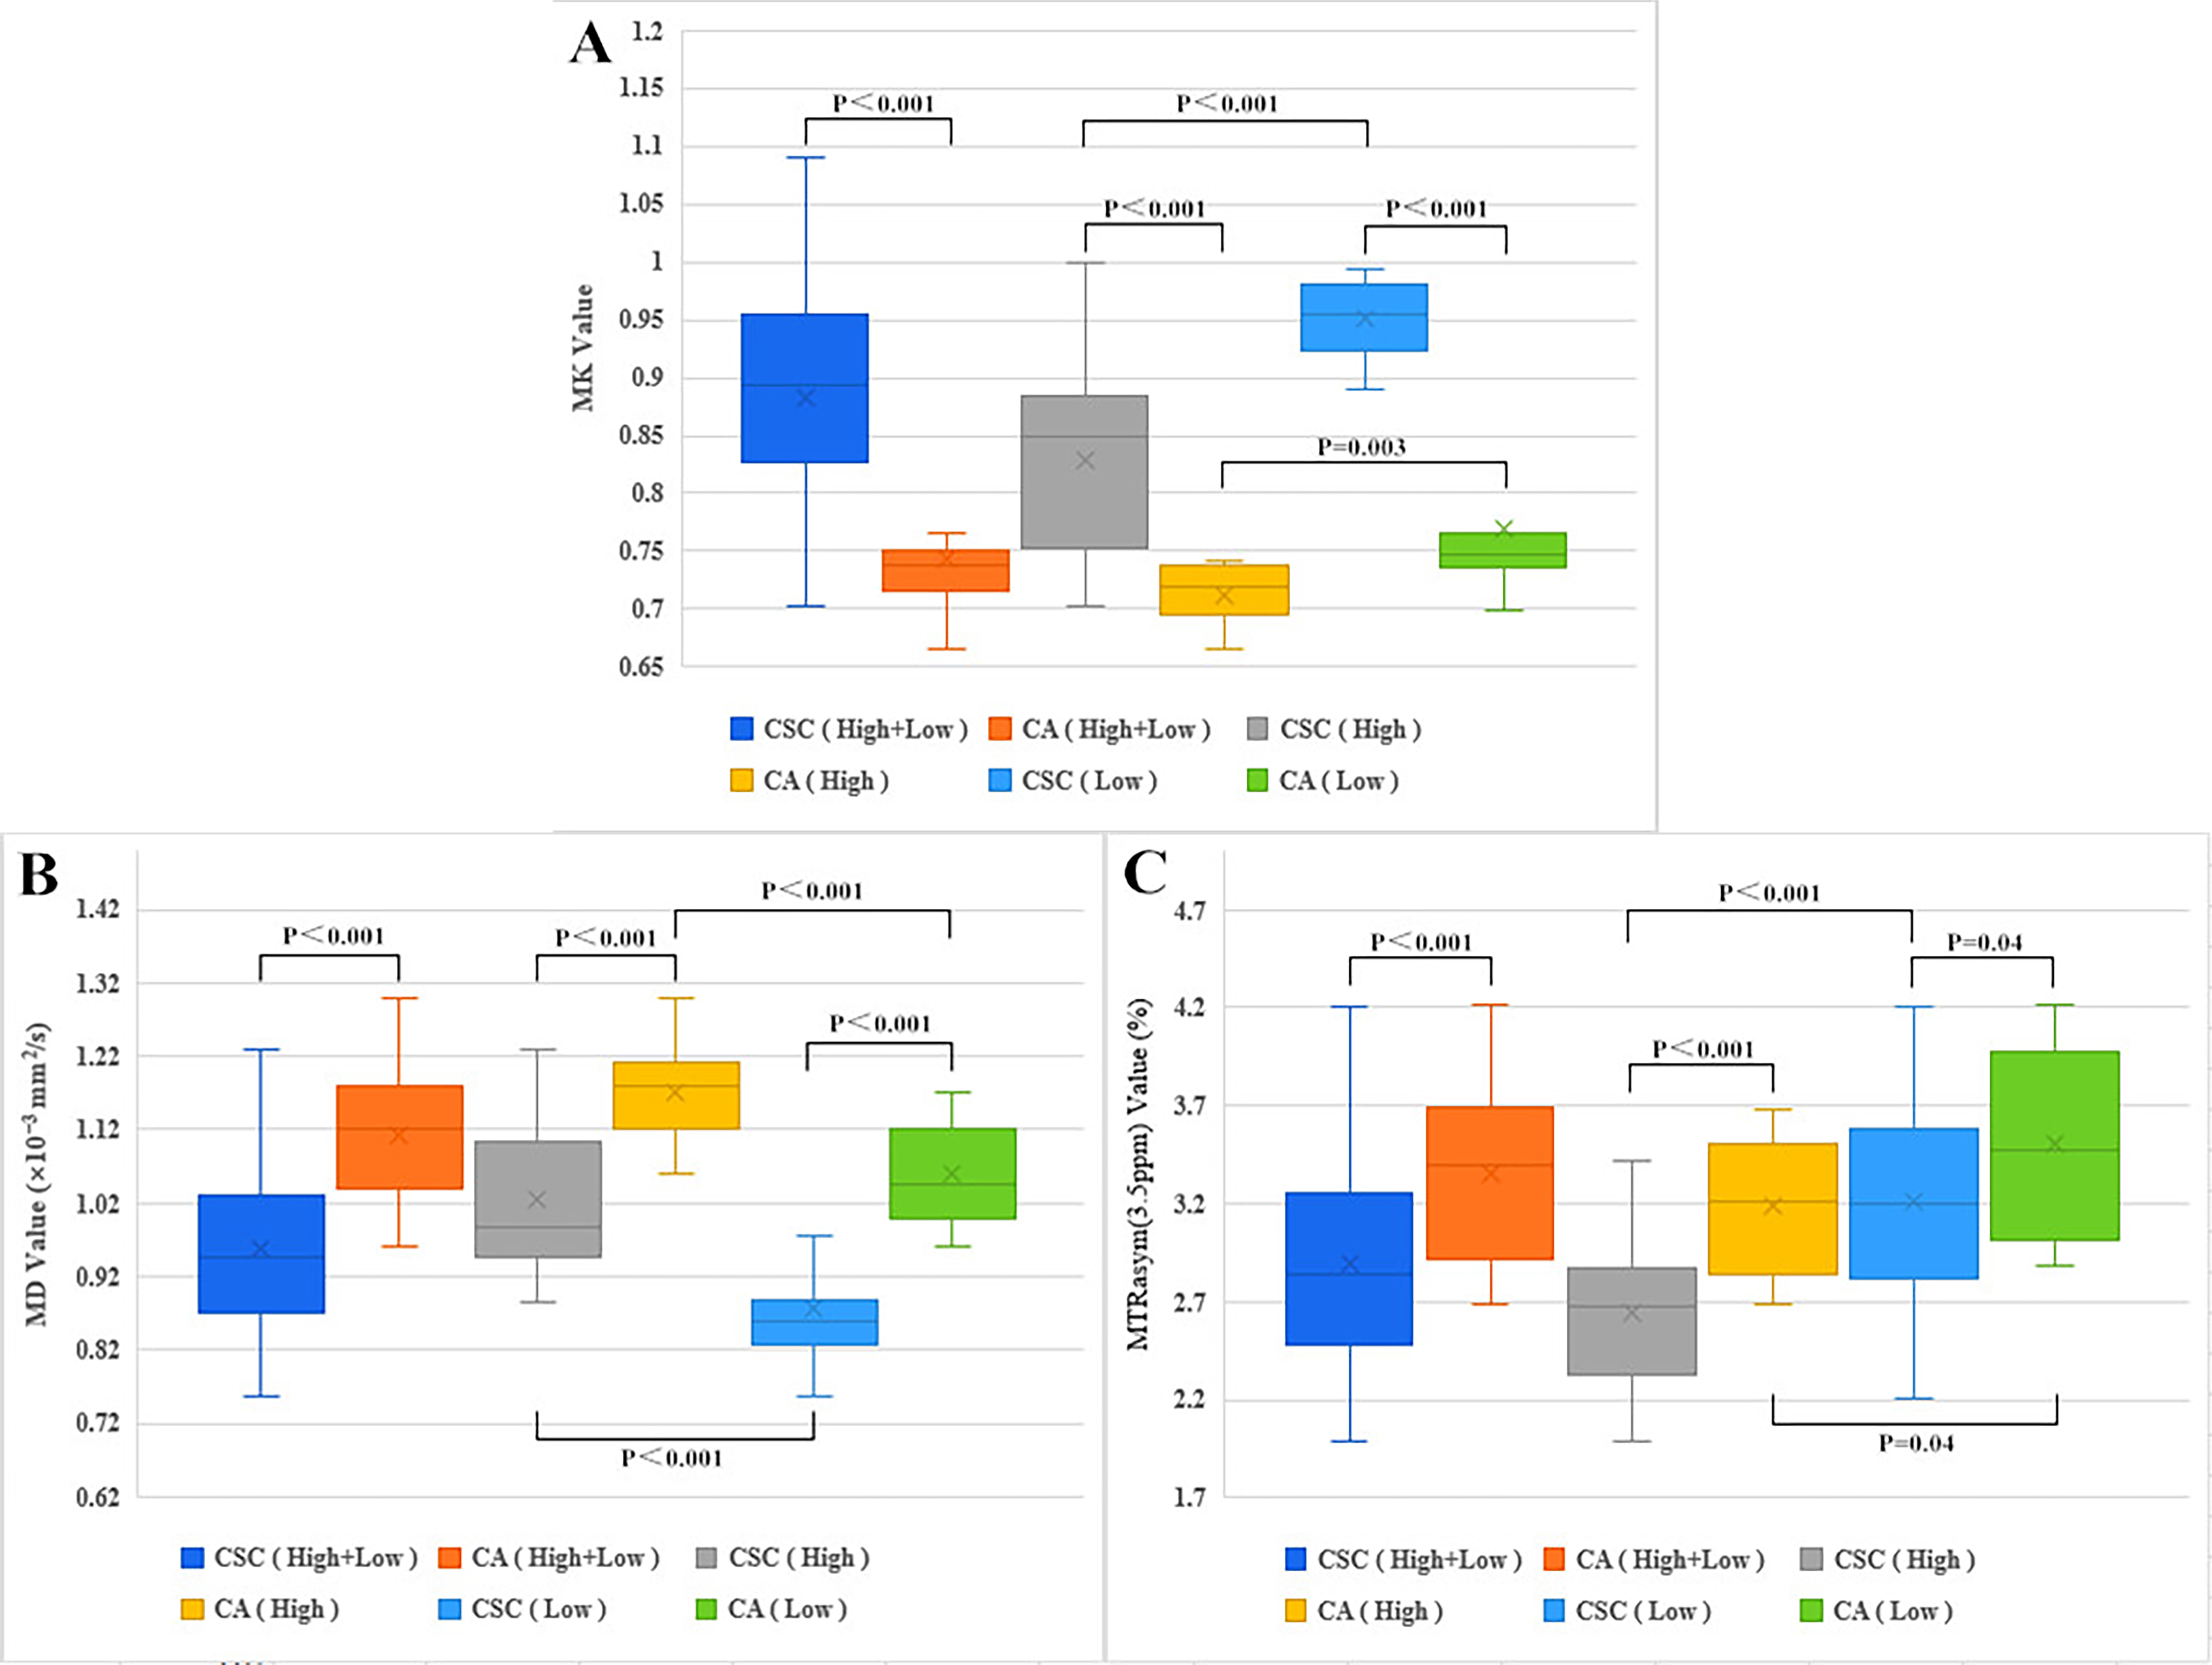
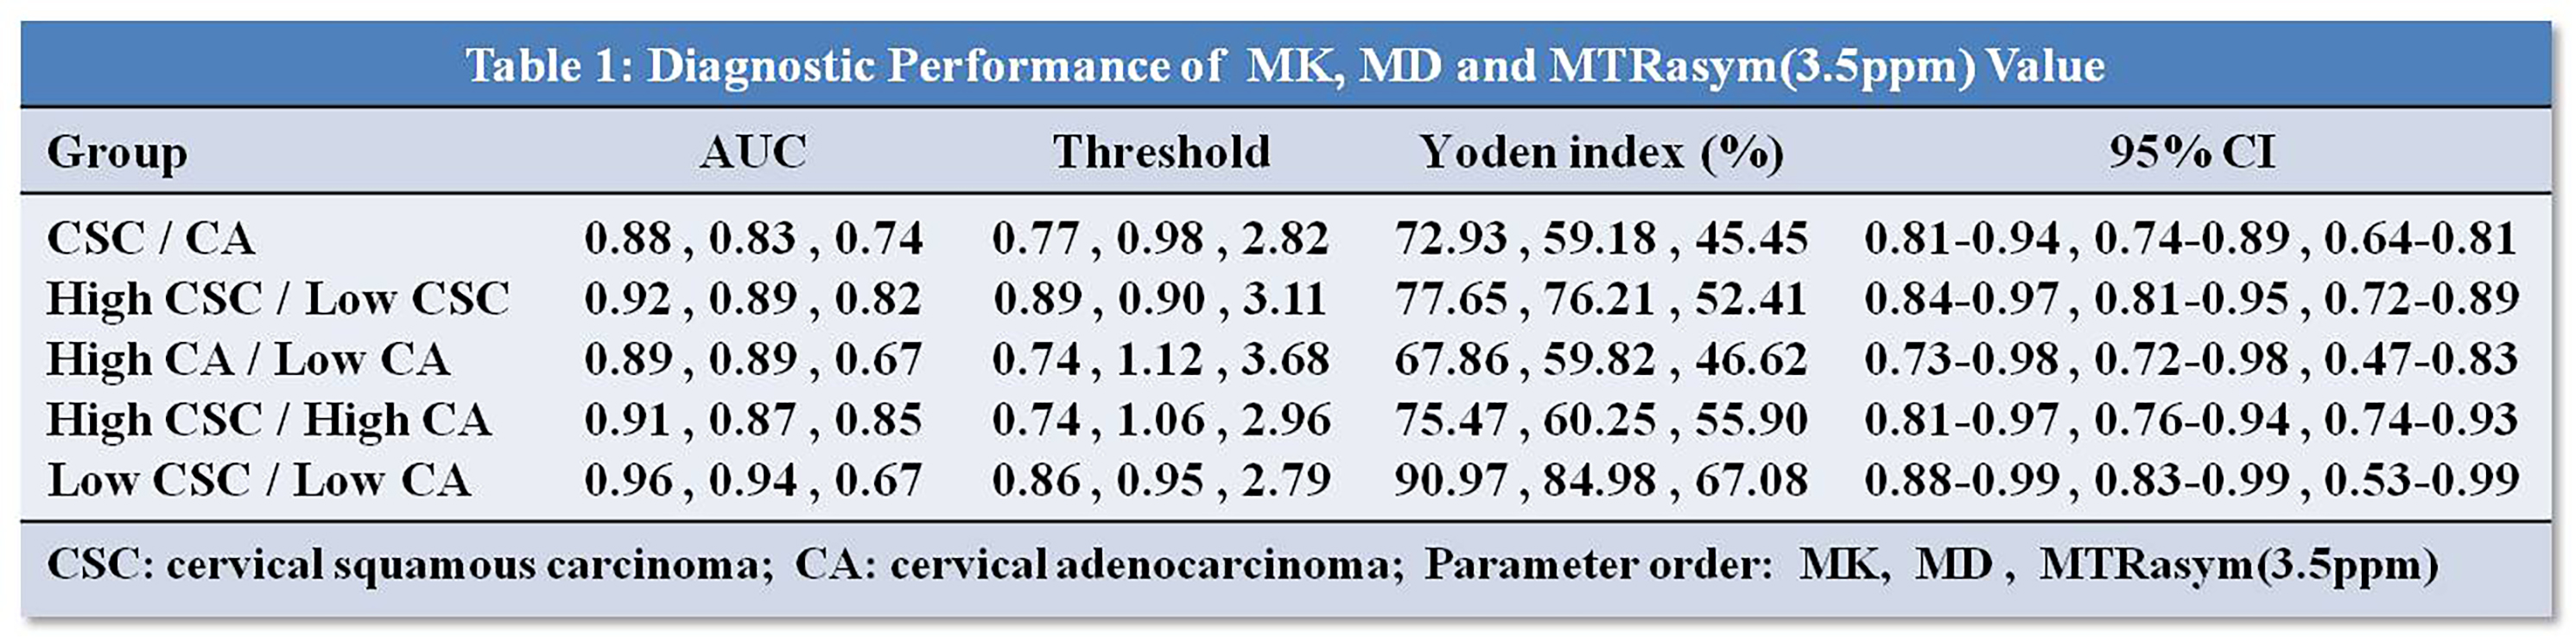
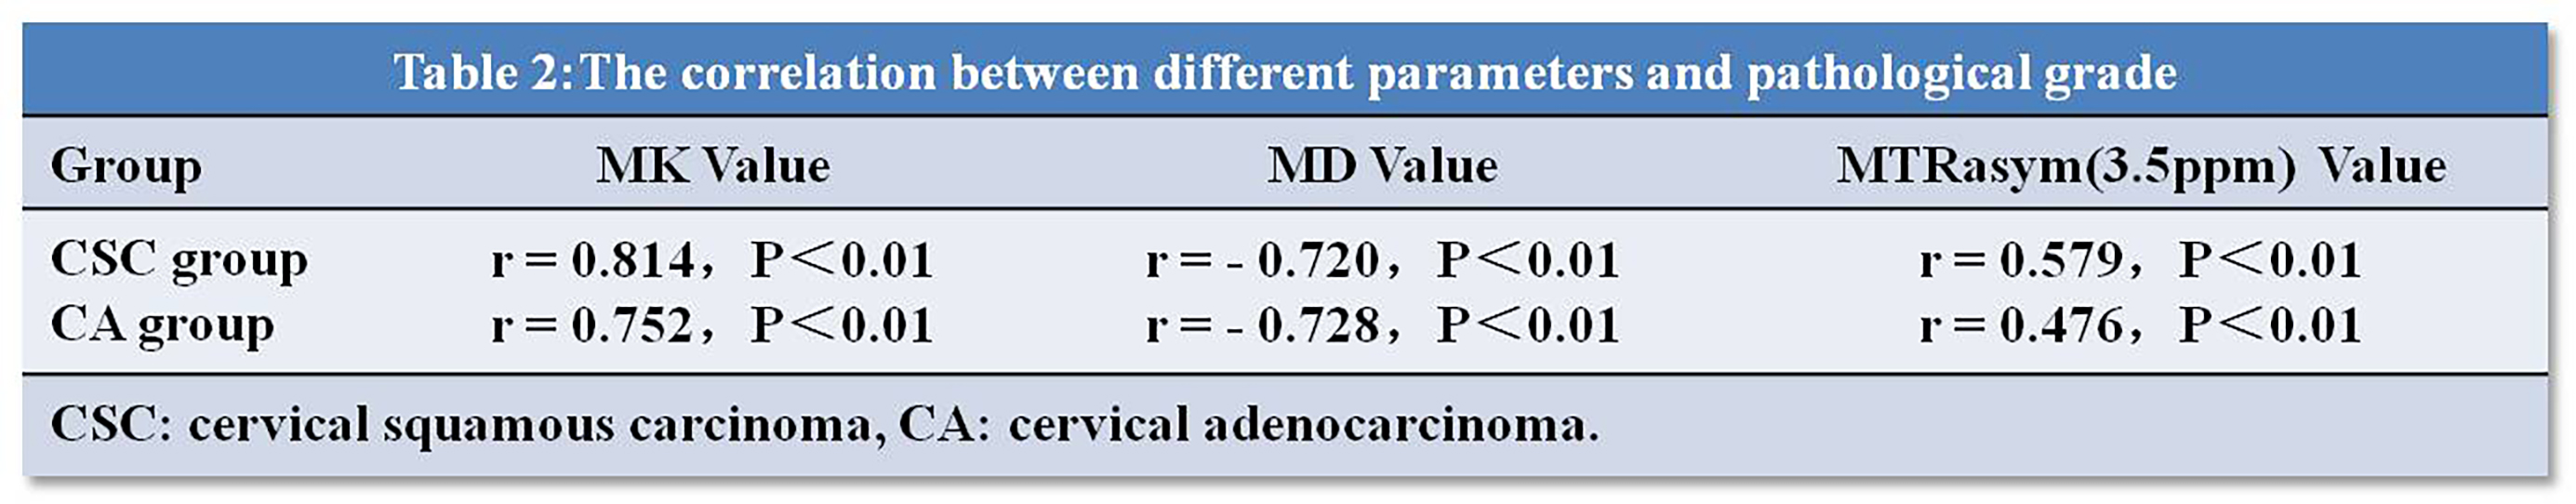
The MTRasym (3.5ppm) and MD values of the CA group are higher than that in the CSC group, MK value in the CA group is lower than that of the CSC group. The MTRasym (3.5ppm) and MK value of the high-level CSC/CA group are higher than those of the low-level CSC/CA group, MD value of the high-level CSC/CA group is lower than that of the low-level CSC/CA group (Figure 1,2 ). In all groups, the AUC value of MK was the highest, followed by those of MD and MTRasym (3.5ppm) (Table 1). The correlation between MK and histological grade was greatest, followed by MD and MTRasym (3.5ppm) (Table 2).Discussion
The difference of MTRasym (3.5ppm), MK, and MD values between the CA and CSC groups is statistically significant. This may be related to the structure and function of cells. The CA originates from cervical glandular cells, which are loose in structure and can secrete a large amount of mucus to increases the content of proteins and peptides 7, benefiting the diffusion of water molecules 8. The MTRasym(3.5ppm), MK, and MD values are significantly different between the high-level CSC/CA groups and the corresponding low-level CSC/CA groups. This may be related to cell density.The higher the degree of malignancy of the tumor tissue, the higher the cell density, which can not only secrete more proteins and polypeptide3 but also has a more obvious impact on the diffusion of water molecules. In addition to these reasons, these results may also be related to cell atypia and tissue microvessel density.Conclusion
We concluded that APTWI and DKI are both useful techniques for UCC diagnosis, but DKI may be better for differential diagnosis of CSC, CA, and CSC/CA at different levels.Acknowledgements
The National Natural Science Foundation of China (grants 81271565 and 31470047) and the National Clinical Key Specialty of China.References
1. Noh JM, Park W, Kim YS, et al.Comparison of clinical outcomes of adenocarcinoma and adenosquamous carcinoma in uterine cervical cancer patients receiving surgical resection followed by radiotherapy: a multicenter retrospective study (KROG 13-10)[J].Gynecologic oncology, 2014, 132(3):618-623.
2. Kalliala I, Anttila A, Nieminen P, et al. Pregnancy incidence and outcome before and after cervical intraepithelial neoplasia: a retrospective cohort study [J]. Cancer medicine,2014,3(6):1512-1516.
3. Takayama Y, Nishie A, Togao O, et al.Amide Proton Transfer MR Imaging of Endometrioid Endometrial Adenocarcinoma: Association with Histologic Grade. Radiology, 2018,286(3):909-917.
4. Jensen JH. MRI quantification of non-Gaussian water diffusion by kurtosis analysis[J]. NMR in biomedicine, 2010,23(7):698-710.
5. Wang P, Thapa D, Wu G,et al.A study on diffusion and kurtosis features of cervical cancer based on the non-Gaussian diffusion-weighted model[J].Magnetic resonance imaging,2018,47():60-66.
6. Li B, Sun H,Zhang S,et al.The utility of APT and IVIM in the diagnosis and differentiation of squamous cell carcinoma of the cervix: A pilot study[J].Magnetic resonance imaging, 2019,63():105-113.
7. Ohno Y, Yui M,Koyama H,et al.Chemical Exchange Saturation Transfer MR Imaging: Preliminary Results for Differentiation of Malignant and Benign Thoracic Lesions. Radiology,2016,279(2):578-589.
8. Lin L, Bhawana R, Xue Y, et al.Comparative Analysis of Diffusional Kurtosis Imaging, Diffusion Tensor Imaging, and Diffusion-Weighted Imaging in Grading and Assessing CellularProliferation of Meningiomas[J]. AJNR. American journal of neuroradiology, 2018,39(6):1032-1038.
Figures