0588
Accelerated T2 Mapping for Evaluating Cervical Cancer Features: A Preliminary Study1Department of Magnetic Resonance, the First Affiliated Hospital of Zhengzhou University, Zhengzhou, China, 2MR Collaboration, Siemens Healthcare Ltd, Beijing, China, 3Advanced Clinical Imaging Technology, Siemens Healthcare AG, Lausanne, Switzerland
Synopsis
This study investigated the feasibility of an accelerated T2-mapping sequence to evaluate cervical cancer (CC) pathological type, grade, stage and lymphovascular space invasion (LVSI) status. The results showed that quantitative T2 values can effectively grade and predict the CC LVSI status, and the ADC values can stratify CC grading. The synthetic T2-weighted (T2W) images showed comparable staging accuracy to the morphological T2W images acquired by a conventional sequence. This suggests that this accelerated T2-mapping sequence may facilitate CC staging and grading. Quantitative T2 values may be superior to ADC values in predicting the LVSI status of CC.
Purpose
In recent years, T2 mapping has been gradually applied to tumor research [1-4]. However, the application value of T2 mapping in evaluating pathological features of cervical cancer (CC) remains unclear. A known limitation of conventional T2 mapping is its long acquisition time, which may be a deterrent in clinical use [5]. Recently, a new technique was proposed for rapid acquisition of T2 mapping. Specifically, GRAPPATINI, a reconstruction method, combines model-based accelerated relaxometry by iterative nonlinear inversion (MARTINI) with generalized autocalibrating partial parallel acquisition (GRAPPA), thereby reducing the acquisition time of T2 mapping [5, 6]. Furthermore, synthetic T2-weighted (T2W) images can also be generated at the scanner from the parametric T2 maps of the same acquisition. The purposes of this study was to (1) investigate the utility of accelerated T2 mapping for identifying the classification, grade and lymphovascular space invasion (LVSI) status of CC; (2) compare the diagnostic accuracy of clinical staging between synthetic T2W images and morphologic T2W images acquired by a conventional sequence. Apparent diffusion coefficient (ADC) values were also evaluated and compared to determine the optimal biomarker for characterization of CC.Materials and Methods
This study included 63 CC patients who underwent magnetic resonance imaging (MRI) including morphological T2W imaging, diffusion-weighted imaging (DWI), and T2 mapping before surgery on a 3T system (MAGNETOM Skyra, Siemens Healthcare, Erlangen, Germany). Morphological T2W images were acquired using a conventional turbo spin echo (TSE) sequence. T2 mapping was acquired with a prototype GRAPPATINI sequence [5]. T2 parametric maps and the synthetic T2W images were inline-generated after data acquisition. The T2 mapping parameters were: TR/TE = 4680/10, 20, 30, 40, 50, 60, 70, 80, 90, 100, 110, 120, 130, 140, 150, 160ms; FOV = 220×220mm2; scan matrix = 320×240; voxel size = 0.7×0.7×4.0 mm3; 20 slices; parallel imaging factor = 2 with an additional undersampling factor of 5, resulting in a 10-fold total acceleration; acquisition time = 4 min 17 sec. Differences in the T2 and apparent diffusion coefficient (ADC) values were assessed between (a) squamous cell carcinomas (SCC, n=50) and adenocarcinomas (n=13), (b) well/moderately differentiated tumors (n=45) and poorly differentiated tumors (n = 18), and (c) LVSI-positive (n=20) and LVSI-negative (n=43) CCs by using the independent t-test. The diagnostic accuracy of conventional morphological and synthetic T2W images in tumor staging was compared by using the chi-squared test. Diagnostic performances of T2 and ADC were determined by receiver operating characteristic (ROC) analysis. The correlation between T2 and ADC values was assessed with a Spearman test. A P<0.05 was considered statistically significant.Results
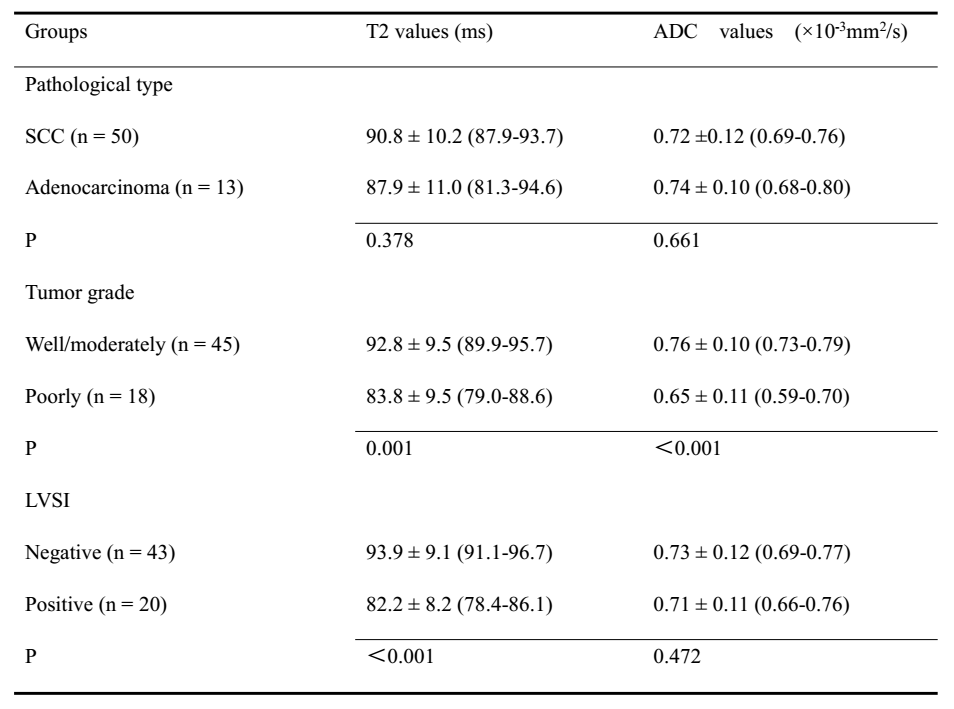
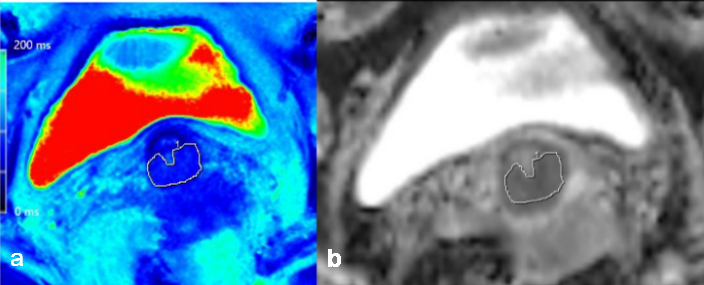
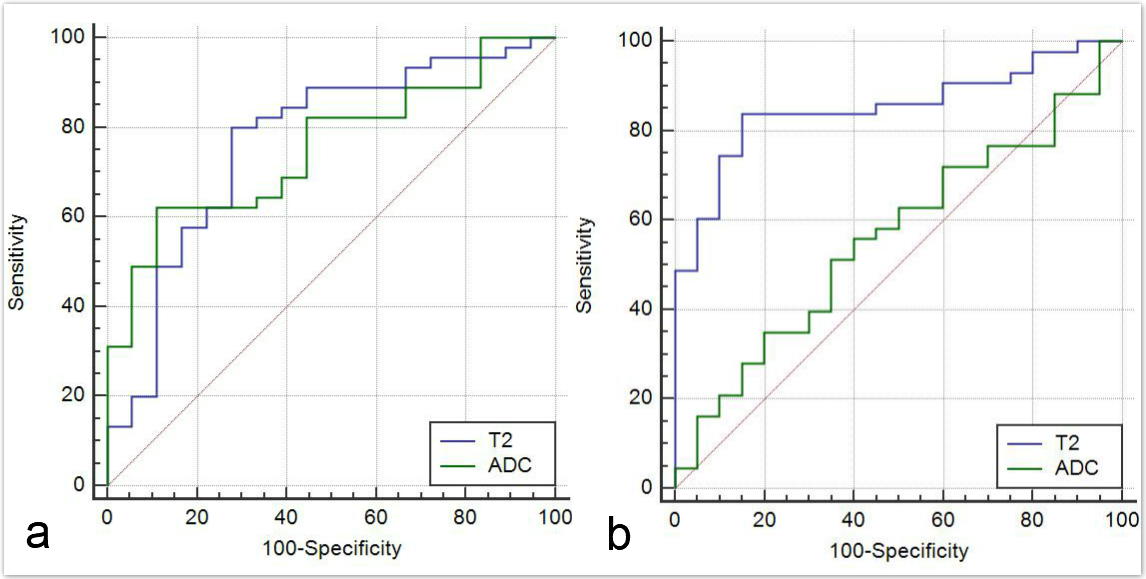
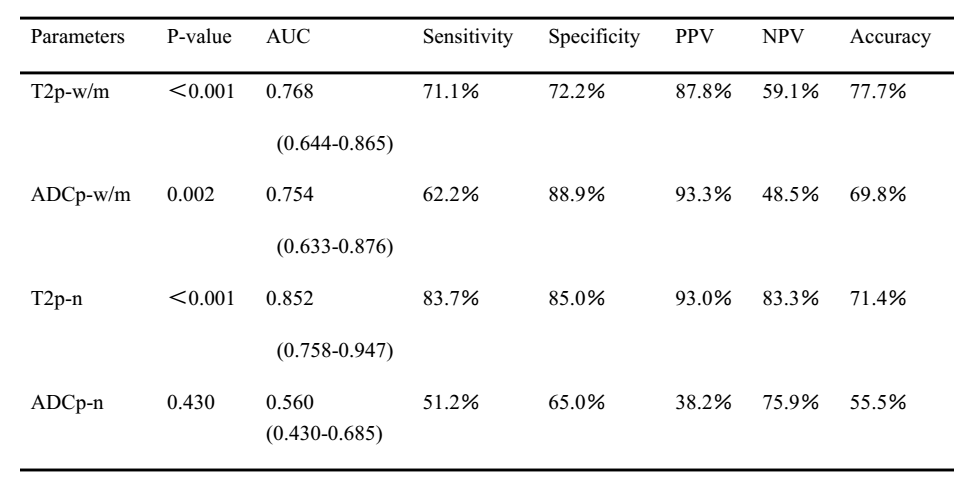
The T2 and ADC values for SCC did not significantly differ from those of adenocarcinoma (P>0.05). The T2 and ADC values for the poorly differentiated tumors both were lower than those of the well/moderately differentiated tumors (P=0.002, P<0.001, respectively). The T2 values for the LVSI-positive group were substantially lower than that of the LVSI-negative group (P < 0.001). However, the ADC values showed no difference between the two groups (P > 0.05). The detailed results are shown in Figure 1. Figure 2 shows an image example from a patient. There was no obvious correlation between the T2 and ADC values (r = 0.234, P = 0.384). The areas under the ROC curve (AUC) for the T2 and ADC values for distinguishing tumor grade were 0.757 and 0.754, respectively. The AUCs of the T2 and ADC values for distinguishing the LVSI status were 0.852 and 0.560, respectively (Figure 3, 4). The diagnostic accuracy of conventional and synthetic T2W images were 71% (n = 45) and 68% (n = 43), respectively, the difference of which was not significant (P = 0.698).Discussion
This was a preliminary feasibility study of accelerated T2 mapping for the preoperative evaluation of CC. The results suggest that the quantitative T2 value and ADC both can be used to differentiate CC grades. T2 value was superior to ADC value in predicting the LVSI status. However, the correlation analysis revealed no obvious correlation between the T2 and the ADC values, which may suggest that the T2 and the ADC values reflect distinctive tissue characteristics of the CC. In clinical staging, the synthetic T2W images demonstrated comparable diagnostic accuracy to the conventional T2W images.Conclusion
Accelerated T2 mapping appears to effectively and noninvasively assess CC tumor grade and LVSI status in vivo. The diagnostic accuracy of the synthetic T2W images, acquired in one acquisition with the accelerated T2 mapping, is comparable to those obtained by the conventional TSE sequence.Acknowledgements
The authors have no acknowledgements.References
[1] Yamauchi FI, Penzkofer T, Fedorov A, et al. Prostate cancer discrimination in the peripheral zone with a reduced field-of-view T(2)-mapping MRI sequence. Magn Reson Imaging 2015;33(5):525-530.
[2] Hoang Dinh A, Souchon R, Melodelima C, et al. Characterization of prostate cancer using T2 mapping at 3T: A multi-scanner study. Diagn Interv Imaging 2015;96:365-372.
[3] Mai J, Abubrig M, Lehmann T, et al. T2 Mapping in prostate cancer. Invest Radiol 2019;54:146-152.
[4] Adams LC, Bressem KK, Jurmeister P, et al. Use of quantitative T2 mapping for the assessment of renal cell carcinomas: first results. Cancer Imaging 2019;19:35.
[5] Hilbert T, Sumpf TJ, Weiland E, et al. Accelerated T2 mapping combining parallel MRI and model-based reconstruction: GRAPPATINI. J Magn Reson Imaging 2018; 48:359-368.
[6] Wang F, Zhang H, Wu C, et al. Quantitative T2 mapping accelerated by GRAPPATINI for evaluation of muscles in patients with myositis. Br J Radiol 2019 [Epub ahead of print].
Figures