0584
Quantitative Ferumoxytol Dynamic Contrast Enhanced (DCE) MRI Evaluation of the Placenta after Zika Virus Infection in the Rhesus Macaque1Medical Physics, University of Wisconsin-Madison, Madison, WI, United States, 2Comparative Biosciences, University of Wisconsin-Madison, Madison, WI, United States, 3Wisconsin National Primate Research Center, University of Wisconsin-Madison, Madison, WI, United States, 4Obstetrics & Gynecology, University of Wisconsin-Madison, Madison, WI, United States, 5Pathology, Oregon Health & Science University, Portland, OR, United States, 6Biomedical Engineering, University of Wisconsin-Madison, Madison, WI, United States, 7Radiology, University of Wisconsin-Madison, Madison, WI, United States, 8Computer Science, University of Wisconsin-Madison, Madison, WI, United States
Synopsis
Proper placental development is crucial to fetal health. Here we report preliminary results characterizing the effects of Zika virus on the placenta of the rhesus macaque using dynamic contrast enhanced (DCE) MRI scans. DCE data were processed to identify individual cotyledons, their volume, and blood flow at three time points during gestation and were compared with pathological findings from term placenta dissection. Analysis shows a statistically significant decrease in cotyledon volume with pathology, measurable as early as 64 days gestation.
Introduction
The placenta is a crucial mediator of oxygen, nutrient, and waste transport between pregnant mother and the developing fetus. Placental health plays a critical role during pregnancy and in the long-term health of the developing fetus.1 Its non-invasive assessment is compelling, yet challenging. Recent studies have shown the potential of DCE MRI to characterize regional placental blood flow.2,4 It can uniquely visualize and quantify blood flow to functional areas of maternal blood inflow, called cotyledons, which facilitate the exchange of materials between maternal and fetal blood.1 Zika virus causes a variety of birth defects including microcephaly and growth restriction, complications which may stem from its effects on the placenta.5 In this study, we apply DCE-MRI to a primate model of Zika virus infection to assess placental function over gestation.Methods
Animals: Six pregnant rhesus macaques were divided into three groups: two Zika cohorts infected via amniotic fluid injection of 104 (n=2) or 106 (n=2) plaque forming units (PFUs) and one saline amniotic fluid injection control group (n=2). Injection occurred at gestational age 54.7±1.9 days (full term gestation=166 days).Imaging: MRI scans were performed at 3.0T (Discovery MR750, GE Healthcare) with a 32-channel phased array coil. The six monkeys were anesthetized with isoflurane and imaged in right-lateral position two (n=1) or three (n=5) times during gestation at days 64±1.40, 99.7±3.40, and 145.83±1.07, totaling 17 scans. Single shot fast spin echo images were acquired to resolve and segment the overall placenta (SSFSE, TR=4.32s, TE=101.9ms, spatial res.=0.70×0.70×2.00 mm3, tip=90°). 4D DCE data sets were acquired during ferumoxytol (AMAG Pharmaceuticals) infusion using a dynamic, respiratory-gated T1 weighted spoiled gradient echo product sequence (DISCO, TR=4.8ms, TE=1.82ms, 2.4ms, spatial res.=0.86×0.86×1.00 mm3, temporal resolution=5.48s, tip=12°).
Pathology: After delivery via C-section at gestational age 155.5±1.61 days, each placenta was dissected and evaluated by an experienced placental pathologist (TKM). Each cotyledon was examined for pathologies, including chronic histiocytic intervillitis, acute chorioamninitis, placental infarction, and maternal decidual vasculitis. Every cotyledon was then assigned a score from zero to four based on the number of pathologies present. (0=none, 1=one of the above, etc.) The sum of scores for every cotyledon was then divided by the total number of cotyledons in the placenta to summarize placental health.
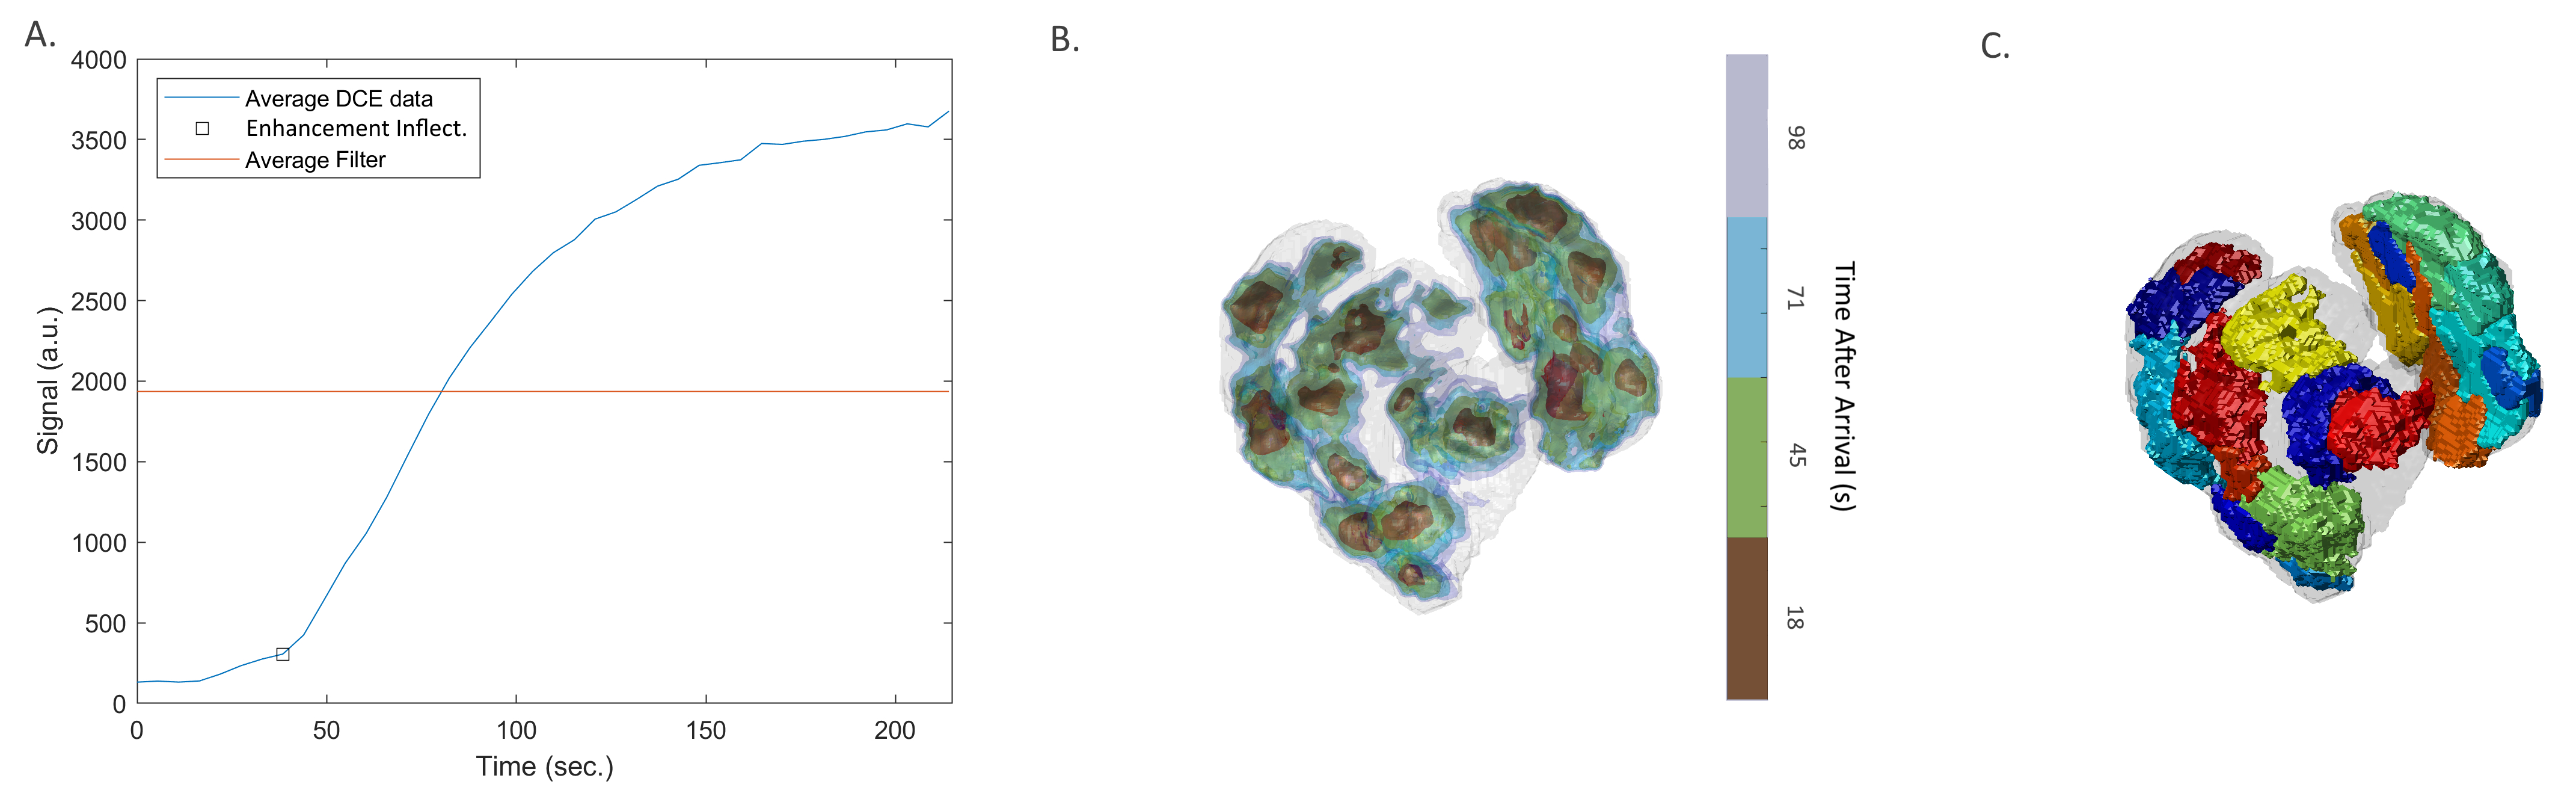
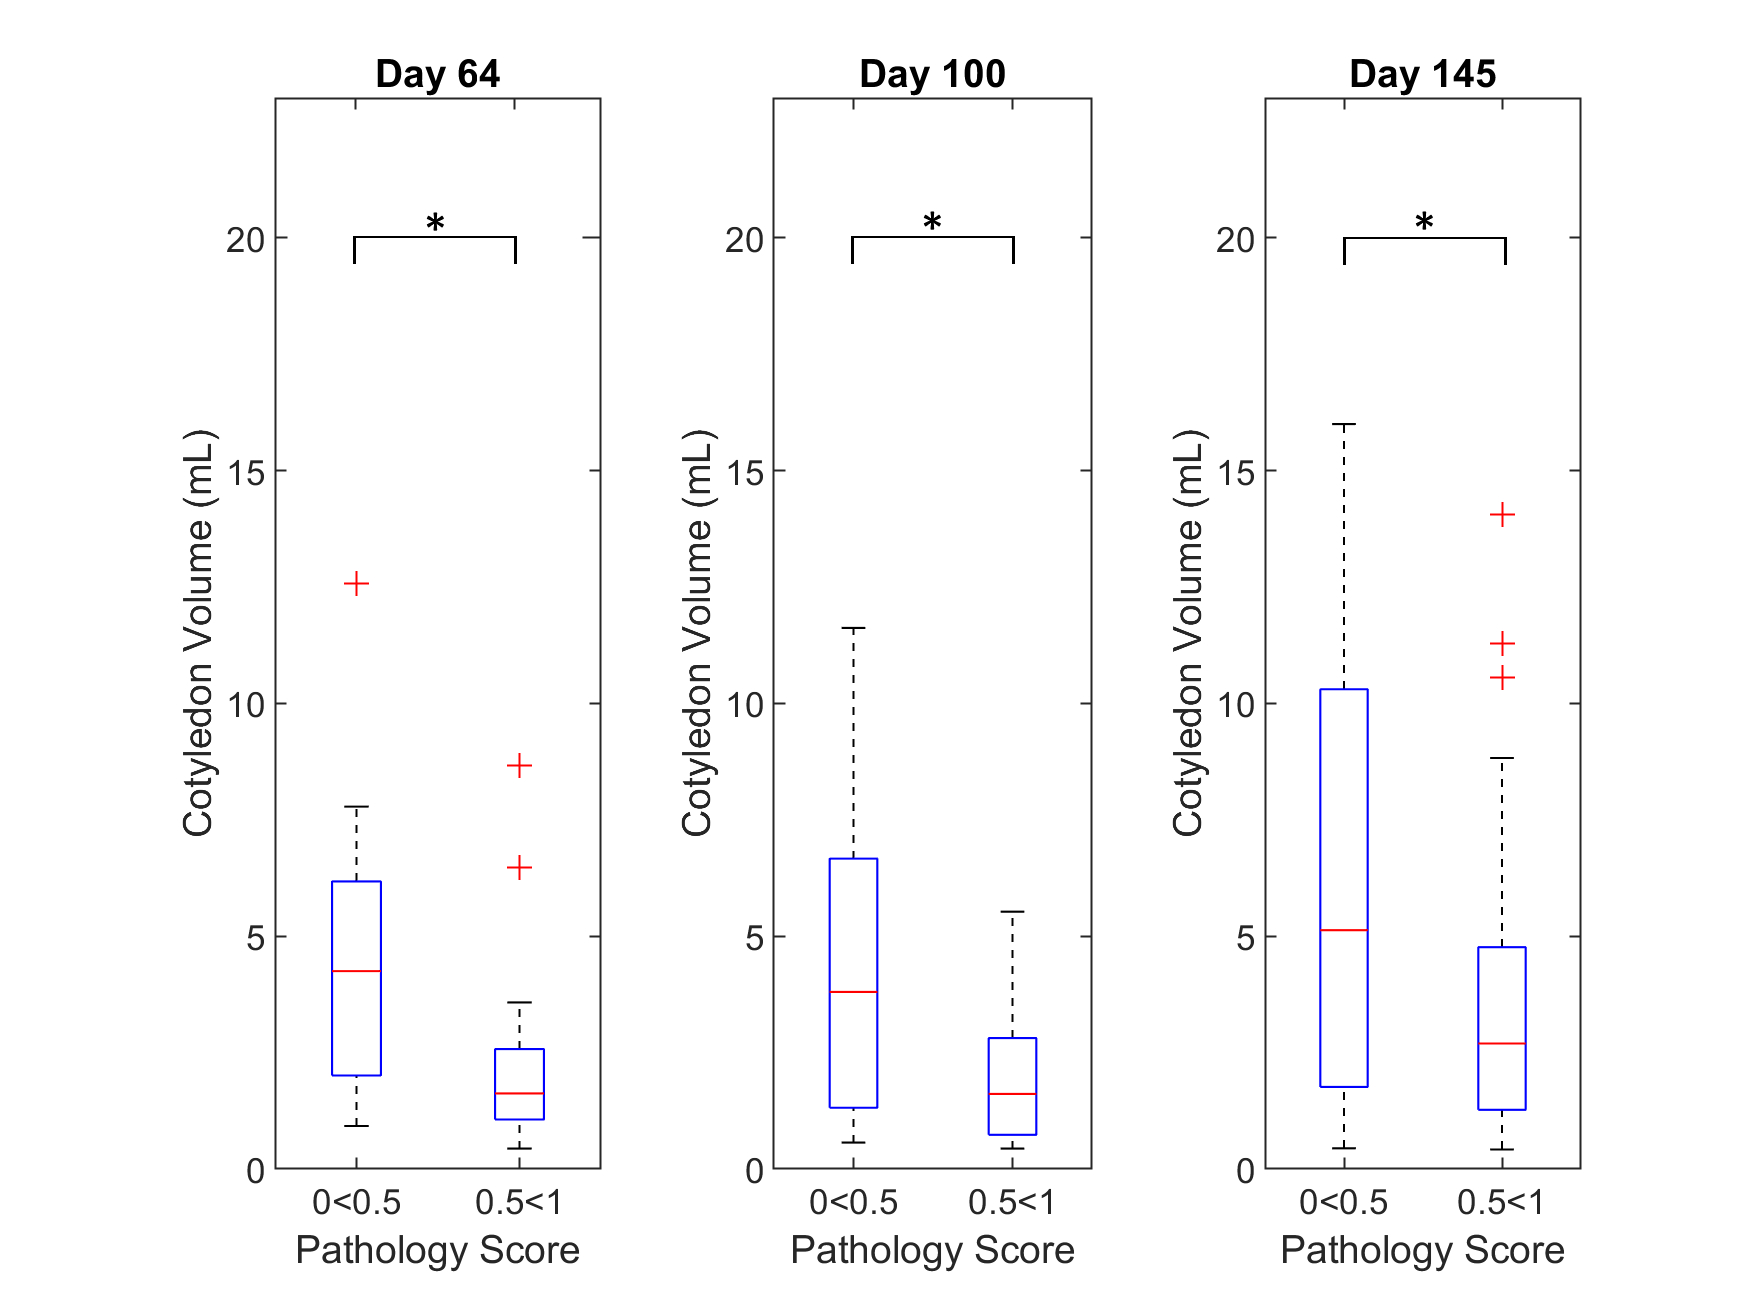
Processing: Placental volume was calculated using manual segmentation of SSFSE images using Mimics (Materialise, NV). Semi-automatic DCE segmentation was performed in ITK-SNAP6, and the DCE data was processed using a watershed algorithm similar to Frias2 and Ludwig7 (Figure 1). Contrast arrival time for every pixel was determined by thresholding the signal intensity using a multiple of the standard deviation of initial time points considered to be background without enhancement, 22σbkgd. This threshold was chosen for all cases except one monkey based on visual inspection of the enhancement curve. Intersection of threshold and average enhancement curve at approximately 50% enhancement reliably produced the best results by rejecting noisy non-placenta pixels but accepting inflow areas with proper sigmoid enhancement. The outlier monkey required a threshold reduction to 11σbkgd for the threshold (Figure 1A) to intersect the enhancement curve at an appropriate level. The total number of cotyledons, cotyledon size, and total blood flow were calculated for each placenta. Segmented cotyledons with a volume <0.5 cm3 were discarded after comparing calculated results with dissected placentas. To ascertain trends due to pathology, animals were grouped into two pathological score ranges: [0.0,0.5] (n=3) and [0.5,1.0] (n=3) (Figure 2). Cotyledon volumes from each scan were combined for these cases, and the two groups were compared using a Wilcoxon rank sum test. (P<0.05 statistical significance level.)
Results
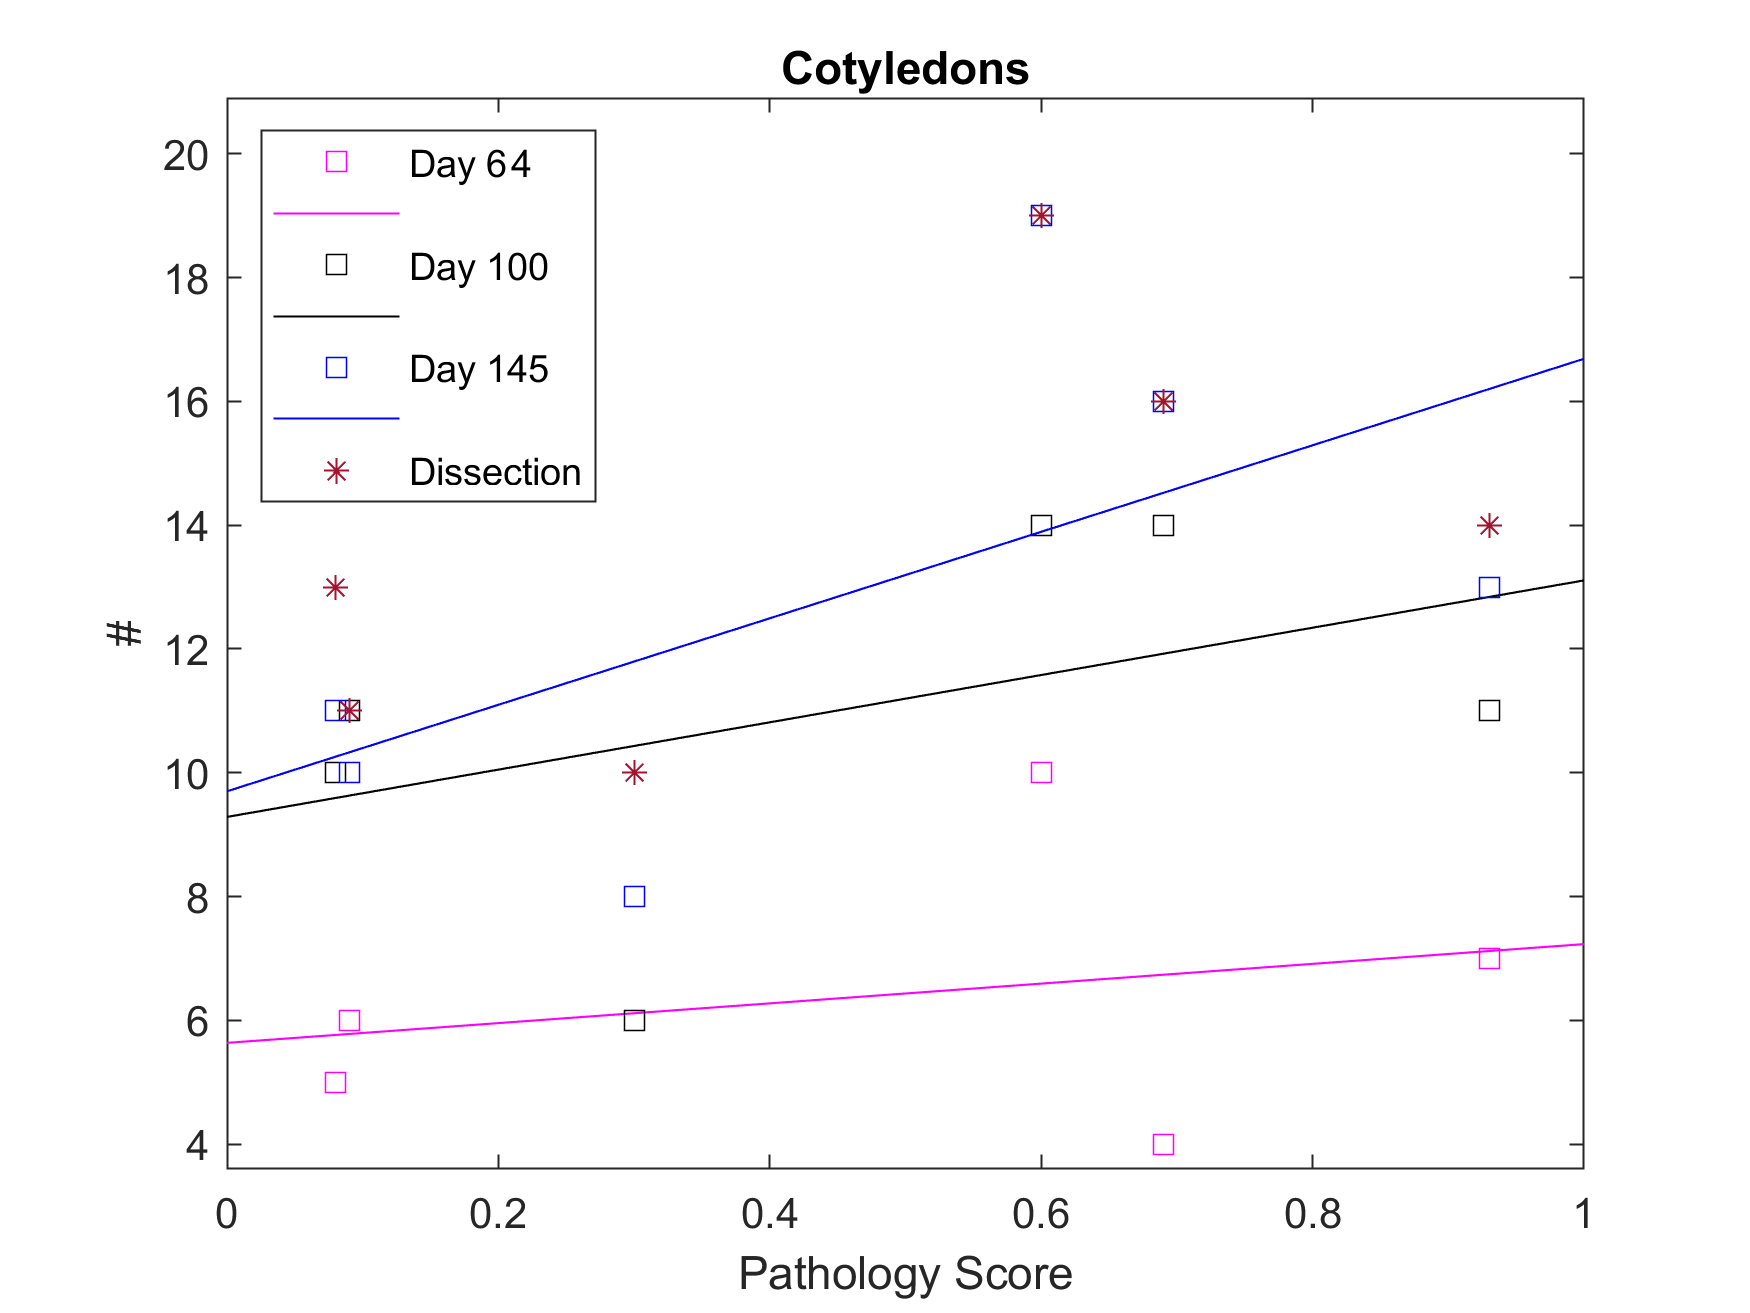
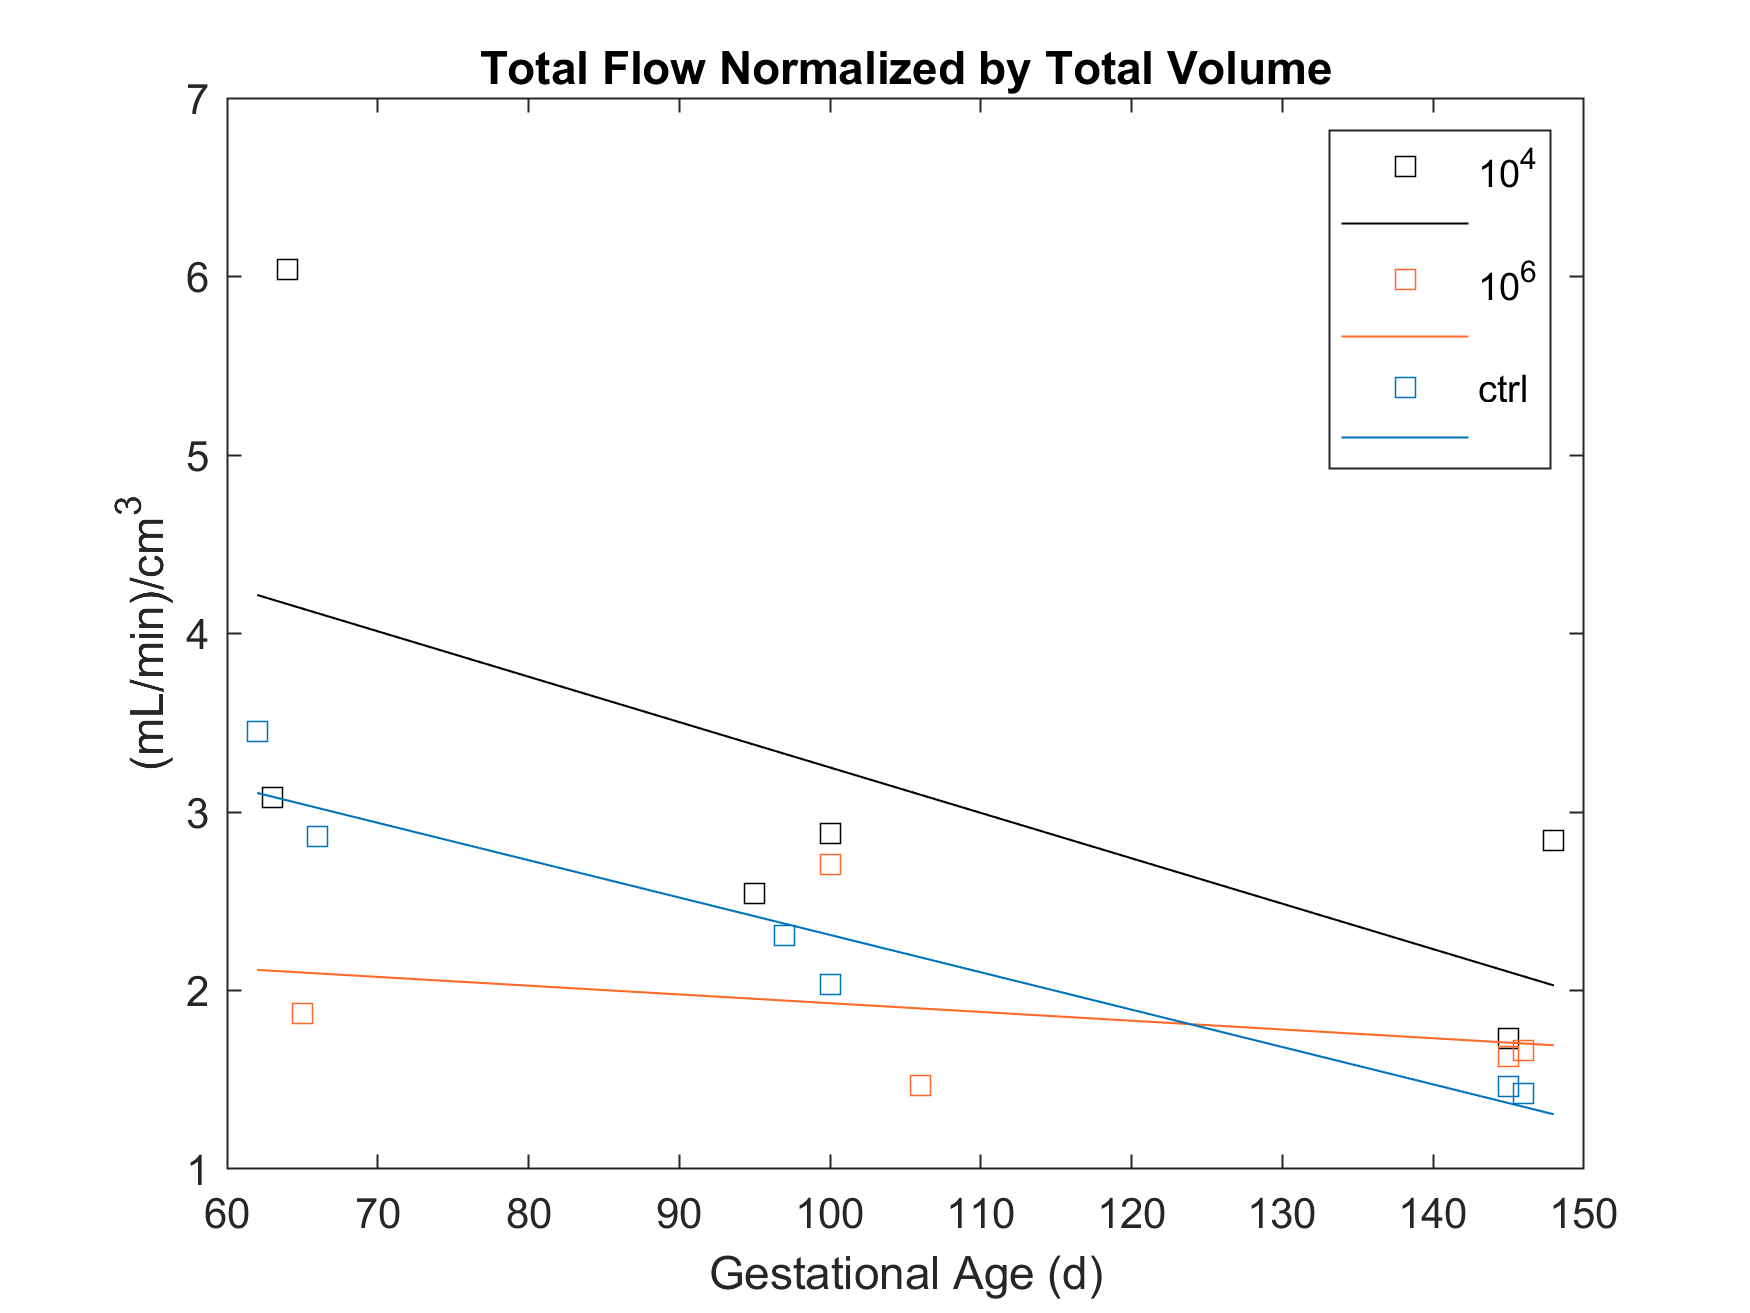
Plots of the number of cotyledons and total flow normalized to placental volume are shown in Figures 3 and 4. The average difference between dissection versus imaging number of cotyledons is 1±0.82 cotyledons. Plotting number of cotyledons versus the pathology scores suggests a positive trend but requires larger cohorts to establish any statistical power (Figure 3).As shown in Figure 4, total blood flow normalized to total placenta volume does not appear to change significantly between cohorts. This agrees with recent findings.3 The highest pathology score calculated was 0.93, while the controls were scored at 0.08 and 0.09. Animals were separated according to their score as described and cotyledon volumes at each time point were plotted, revealing a statistically significant trend of decreased cotyledon volume with pathology. (Figure 2). Calculated p-values are day 64=0.021, day 100=0.003, and day 145=0.020.
Discussion/Conclusion
As shown by comparison between dissection and day 145 data (Figure 3), ferumoxytol DCE MRI can accurately calculate the number of cotyledons in the rhesus macaque placenta, even when pathology is present. This approach can detect the effects of pathology on the functional cotyledon volume early in gestation. Further, our image-based analysis identifies functional units in early gestation that can currently not be detected with any other method, including histology. The number of cotyledons is shown to increase with gestational age, and total number appears to increase with pathology. Future studies will increase the number of animals analyzed, improving statistical characterization of placental changes due to Zika infection. Ferumoxytol is clinically used to treat iron deficiencies in human pregnancy; future transition to human studies may be possible.Acknowledgements
The authors are thankful for our collaborators, colleagues, and friends. We gratefully acknowledge GE Healthcare for research support, AMAG Pharmaceuticals for the Ferumoxytol used in this study, the NIH Human Placenta Project (U01-HD087216), and NIH grant R21-AL129308.References
1 Denger K, Magness RR, and Shah DS. Establishment of the Human Uteroplacental Circulation: A Historical Perspective. Reprod. Sci. 2016:24(5):753-61
2 Frias AE, Schabel MC, Roberts VH, Tudorica A, Gribsby PL, Oh Ky, and Kroenke CD. Using dynamic contrast-enhanced MRI to quantitatively characterize maternal vascular organization in the primate placenta. Magn. Reson. Med. 2015;73(4):1570-8
3 Hirsch, AJ et. al. Zika virus infection in pregnant rhesus macaques causes placental dysfunction and immunopathology. Nature Comm. 2018:9(263). doi:10.1038/s41467-017-02499-9
4 Ludwig KD et. al. Perfusion of the placenta assessed using arterial spin labeling and ferumoxytol dynamic contrast enhanced magnetic resonance imaging in the rhesus macaque. JMRI. 2018:10. doi: 10.1002/mrm.27548
5 Adibi, JJ, Marques Jr., ETA, Cartus, A, Beigi, RH. Teratogenic effects of the Zika virus and the role of the placenta. The Lancet. 2016;387(10027):1587-1590.
6 Paul A. Yushkevich, Joseph Piven, Heather Cody Hazlett, Rachel Gimpel Smith, Sean Ho, James C. Gee, and Guido Gerig. User-guided 3D active contour segmentation of anatomical structures: Significantly improved efficiency and reliability. Neuroimage 2006 Jul 1;31(3):1116-28.
7 Ludwig, KD, Fain, SB, Nguyen, SM, et al. Perfusion of the placenta assessed using arterial spin labeling and ferumoxytol dynamic contrast enhanced magnetic resonance imaging in the rhesus macaque. Magn Reson Med. 2019; 81: 1964– 1978. https://doi.org/10.1002/mrm.27548
Figures