0580
Placental MRI: Using a novel ex vivo placental perfusion chamber to validate in vivo magnetic resonance fingerprinting (MRF) relaxometry1Fetal-Neonatal Neuroimaging & Developmental Sciences Center, Boston Children's Hospital, Boston, MA, United States, 2Department of Pathology, Massachusetts General Hospital, Boston, MA, United States, 3A. A. Martinos Center for Biomedical Imaging, Massachusetts General Hospital, Boston, MA, United States, 4Department of Radiology, Massachusetts General Hospital, Boston, MA, United States, 5Maternal-Fetal Medicine, Obstetrics and Gynecology, Massachusetts General Hospital, Boston, MA, United States, 6Institute for Medical Engineering and Science; Department of Electrical Engineering and Computer Science, Massachusetts Institute of Technology, Cambridge, MA, United States
Synopsis
The placenta is a challenging MRI target. Acquisition schemes developed for other organs, with implicit assumptions about motion, tissue composition and perfusion, should be vetted for applicability to the placenta. We have developed an ex vivo placental perfusion chamber with integrated MRI receive coil for high SNR and imaging acceleration to validate in vivo acquisitions in a controlled environment. Here we examine the effect of flowing spins on MRF relaxometry. We offer evidence that T1 is sensitive to overall fluid volume, while T2 is additionally sensitive spin inflow. Our placental perfusion system appears promising for validating in vivo quantitative MRI.
Introduction
MRF is appealing for placental relaxometry since in a relatively short scan (<10 s) both T1 and T2 can be estimated on a voxel-wise basis. Early results1 demonstrated a persistent under-estimate of T2 and smaller changes in T1 with maternal oxygen breathing than expected.2 We developed a novel placental perfusion chamber with an integrated MRI receive coil3 that we have used to validate in vivo MRF imaging of the placenta. We tested whether fetal-side perfusion of the placenta affects MRF estimates of T1 and T2. MRF is sensitive to spin inflow, a fact exploited to estimate blood flow rates in large vessels4 and arterial spin labeling frameworks developed for MRF.5 However, to our knowledge, there has been no investigation of the effects of inflowing spins on MRF-based relaxometry in highly perfused tissues like the placenta.Methods
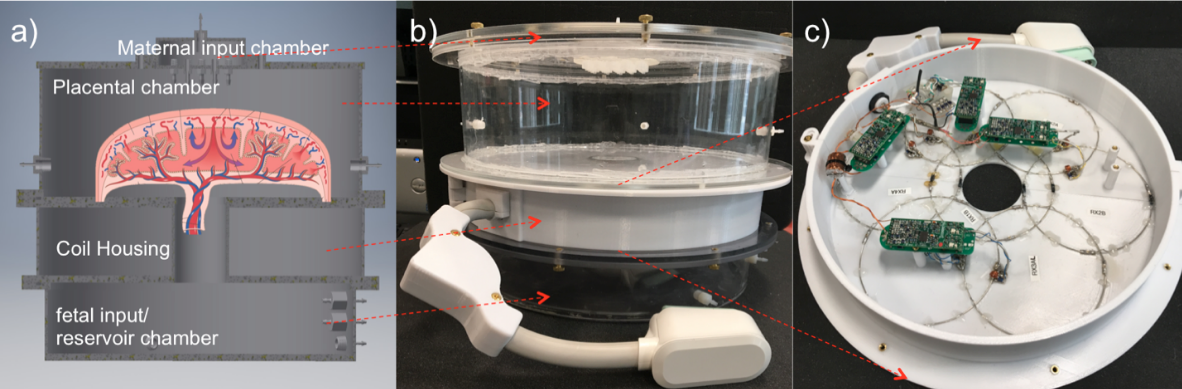
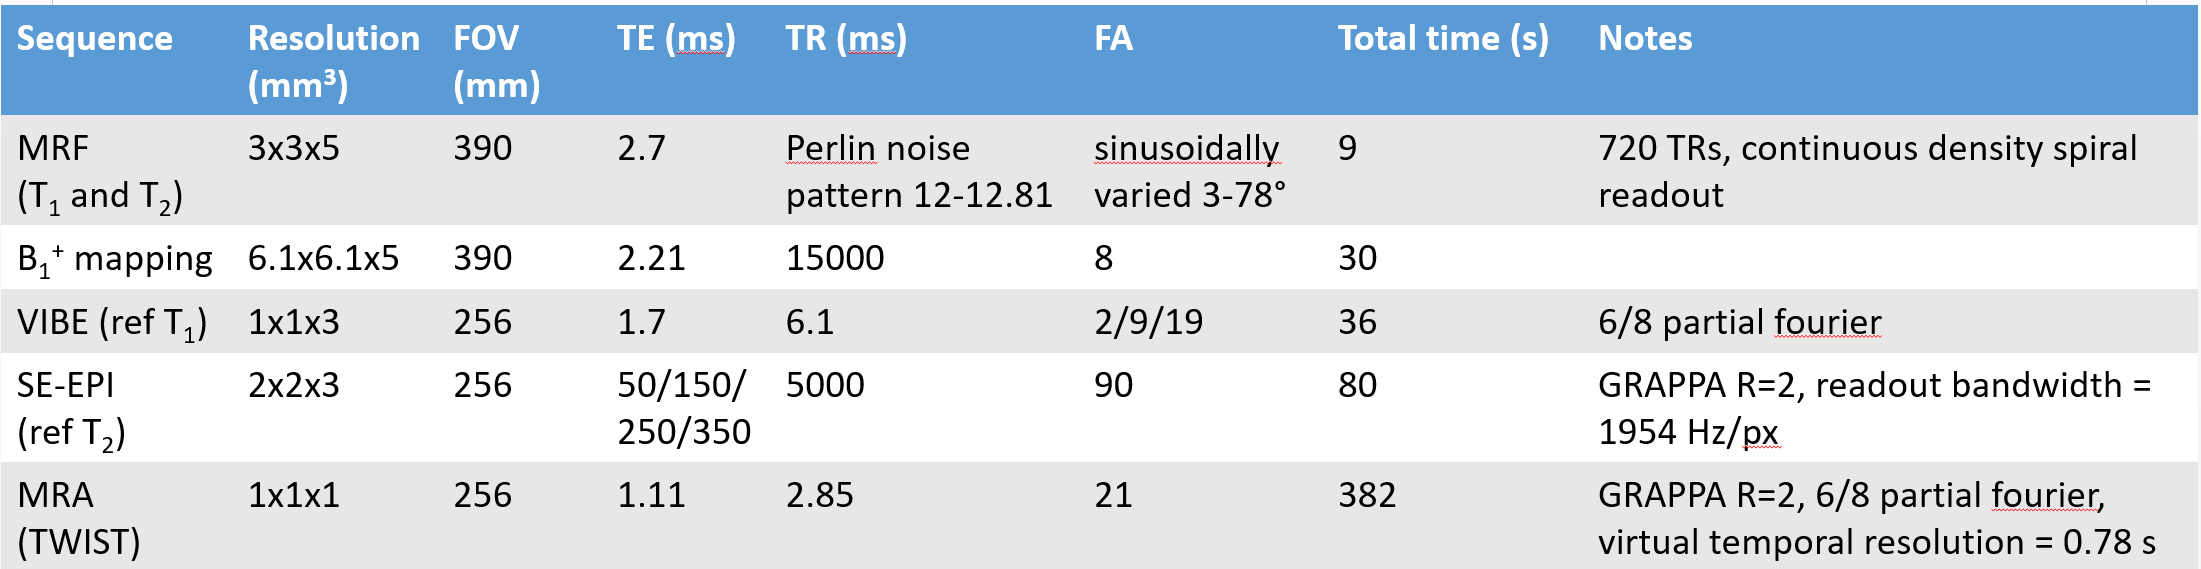
The MRI compatible perfusion chamber for ex vivo placentas has been previously described (Figure 1).3 With IRB approval, we collected two normal term placentas within 3 hours of delivery. Placentas were placed in a 37°C saline bath and the umbilical vessels were cannulated. Blood was washed out with prewarmed perfusate (Phosphate-buffered saline, heparin 25000 USP units/l, nitroglycerin 200 μg/l, glucose 1 g/l) using a pump (PHD Ultra, Harvard Apparatus) adjusted to physiological parameters (150 ml/min, 140 bpm, and 85/45 mmHg) until the venous return was clear. The same pump perfused the placenta during scanning.MRI scanning (3T Skyra, Siemens) consisted of inversion-recovery FISP6 MRF, B1+ mapping performed by pre-saturation using turboFLASH,7 multiple echo time SE-EPI for T2 reference, multiple flip angle 3D-GRE (VIBE) for T1 reference, and contrast enhanced angiography (MRA) using TWIST (Magnvist administered by power injector, 4 ml of 93.8 mg/ml at 0.5ml/s, then a saline flush 8 ml at 0.5ml/s) with protocol parameters in Table 1.
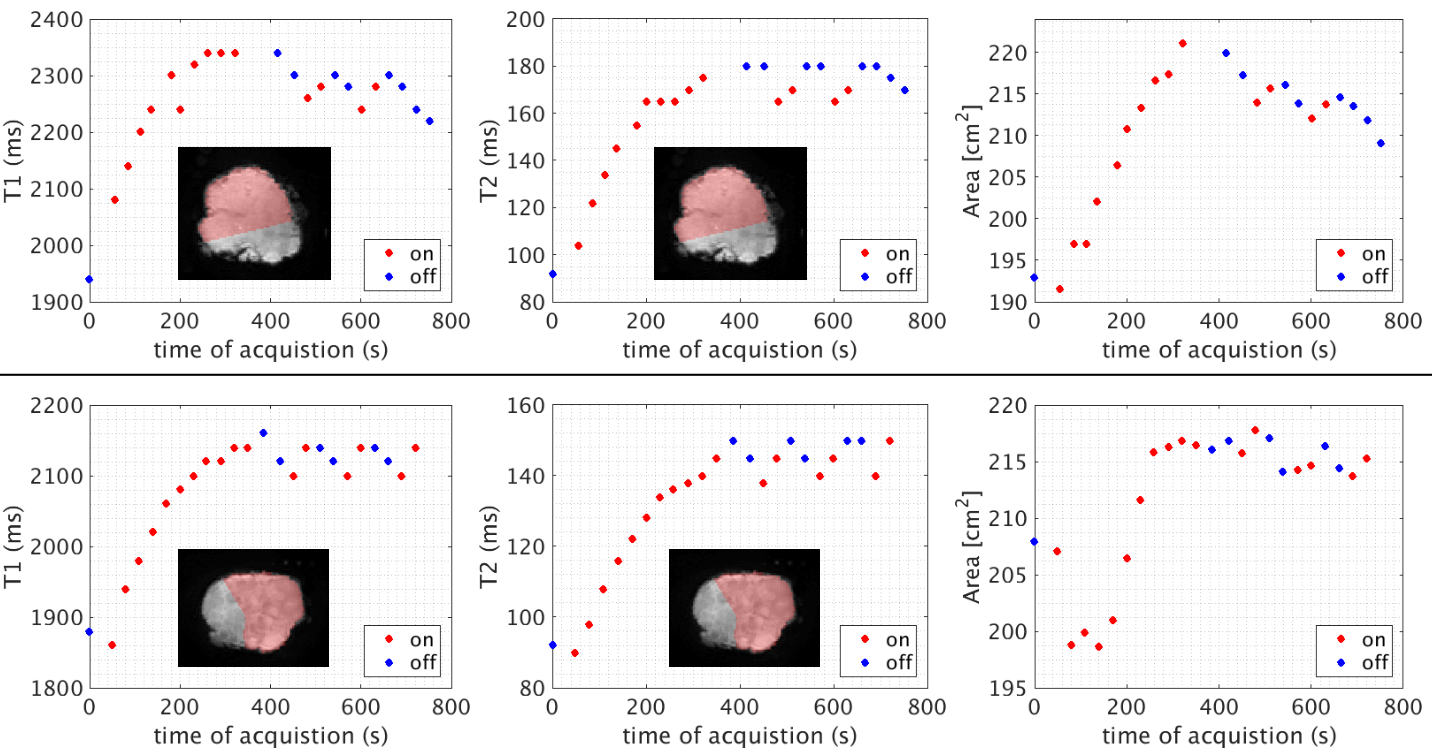
Imaging was performed in both “pump-on” and “pump-off” states. Scanning commenced after approximately 30 min of pump-off during transport and preparation for MRI scanning. An initial pump-off MRF acquisition was followed by a period of pump-on with acquisitions every 30 s for 4.5-5.5 min. Then pump-off and pump-on was alternated in one minute blocks for 5 minutes, with MRF acquired within 3 seconds of the state change and then 30 seconds later. Afterwards, reference relaxometry and B1+ maps were collected during pump-on.
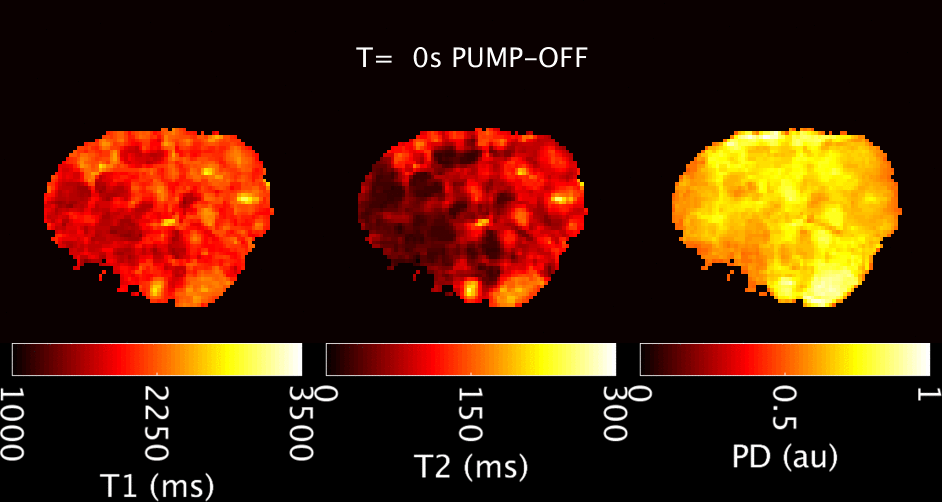
Dictionaries for MRF parameter estimation were calculated8 with B1+ and slice profile correction (relative flip angle range = [0.5:0.1:1.5], T1 = [20:20:3000, 3200:200:5000] ms, T2 =[10:2:150, 150:5:300, 310:12:1000, 1050:50:2000, 2100:100:4000] ms). Parameter maps were determined by the sliding window method.9 Regions of interest (ROIs) were drawn manually. Median values were calculated for the ROIs, with statistical comparisons using the rank-sum test. Placental area was determined by counting voxels in the proton density map >0.5 arbitrary units. The initial change with pump-on was modeled using A*Bexp(-t/C) to determine a time constant of change.
Results
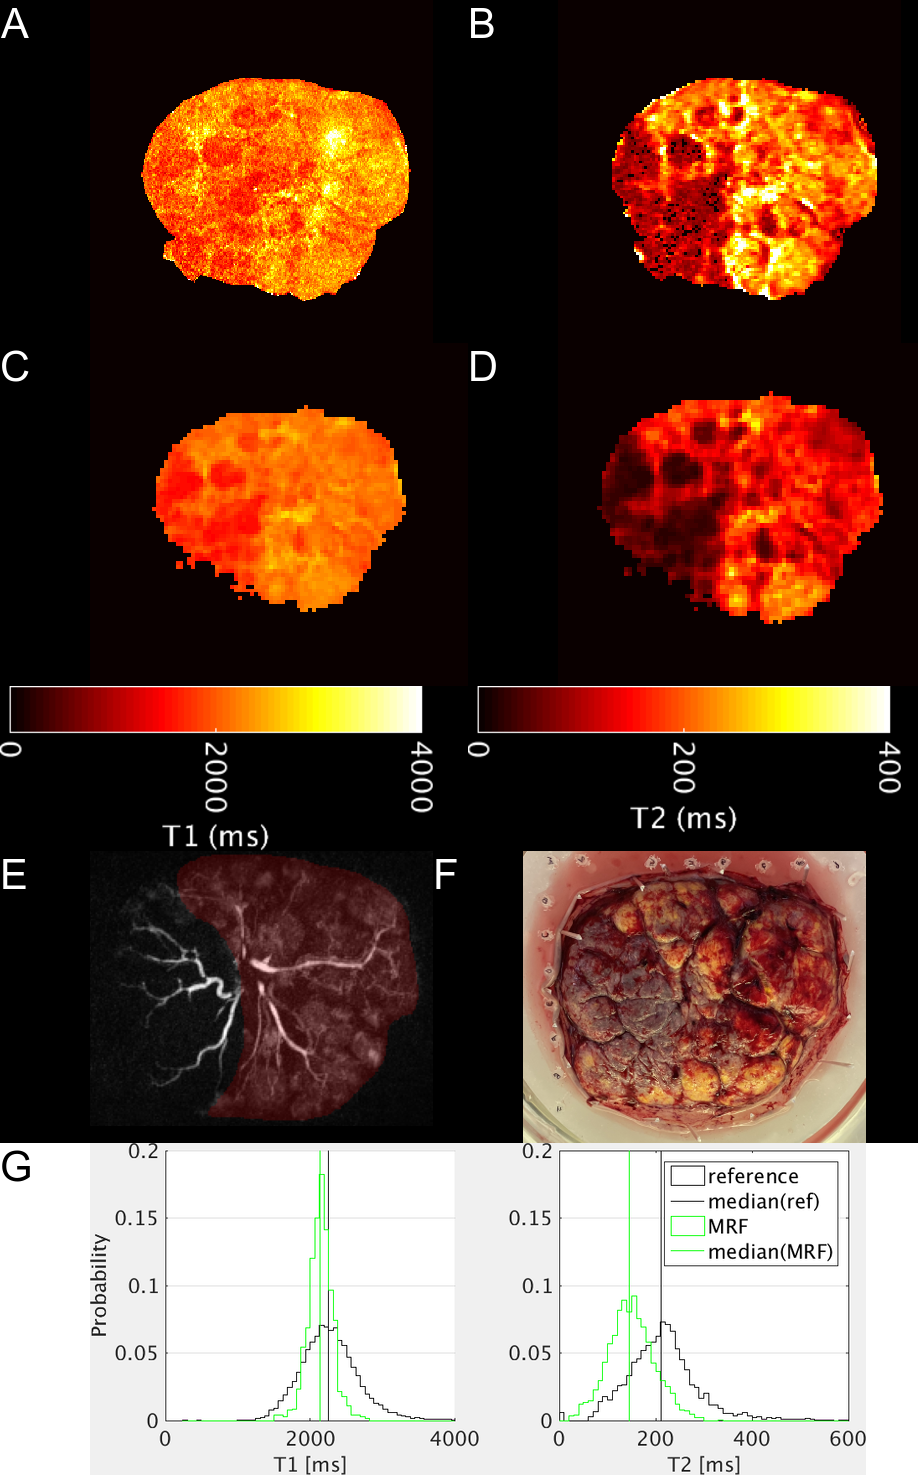
From an initial pump-off state, T1 and T2 values lengthen during pump-on and the placental cross-sectional area also increases (Figures 2, 3). In the pump-on state, a clear parenchymal blush can be appreciated in part of the placental MRA (Figure 4E), and this indication was used to draw a “well perfused” ROI. Median T1 and T2 values for well perfused ROIs between reference and MRF methods (example maps in Figure 4A-D) were different (P<0.001) in each case, but T2 estimates showed the greatest difference (average delta=-75ms) (Figure 4G). Figure 3 shows the median values for the well perfused ROIs at each MRF measurement. The average time constant modeling the initial pump-on period was 126 s for T1 and 270 s for T2. There was an appreciable delay in the poorly perfused regions. The average difference between pump-on and pump-off T1 was -3 ms, and T2 was -7.15 ms.Discussion
Our ex-vivo model was used to characterize quantification of relaxation by MRF for in vivo placental imaging. Without the confounding effects of motion, we found that perfusion makes a small but appreciable contribution to the underestimate of T2 by MRF. Given that our MRF-based observations of in vivo placental T2s are lower than literature reports,1,10 this finding explains some of this discrepancy. The next step in building a realistic ex vivo perfusion model is to include maternal side perfusion, which would create a higher total perfusion and might account for even more of the observed bias. T1 and T2 appear sensitive to the water partial volume fraction, which implies that contractions or changes in blood flow in vivo may significantly affect relaxometry. Finally, the time constants of placental “filling” suggest that after any cessation, pumping should be resumed for ~5 minutes to approximate steady-state function.Conclusion
Our ex vivo placental perfusion platform can be used to examine biases that arise during in vivo placental imaging. We demonstrated the effects of in-flowing spins on MRF quantification, finding that perfusion leads to a small but appreciable underestimate of T2, whilst both T1 and T2 are sensitive to tissue water fraction.Acknowledgements
NIH R01EB017337, U01HD087211 and R01HD100009; Dr. John Kirsch, MGH.References
1. Stout, J. N. et al. T1 and T2 mapping of the placenta and fetal brain with magnetic resonance fingerprinting (MRF) during maternal hyperoxia. in Proc. of International Society for Magnetic Resonance in Medicine 4072 (2019).
2. Ingram, E., Morris, D., Naish, J., Myers, J. & Johnstone, E. MR Imaging Measurements of Altered Placental Oxygenation in Pregnancies Complicated by Fetal Growth Restriction. Radiology 285, 953–960 (2017).
3. Ha, C. G. et al. An MRI compatible ex-vivo placenta perfusion chamber design with 7 channel 3T receive array. in ISMRM Workshop on MRI of the Placenta (2018).
4. Cao, X. et al. A model-based velocity mapping of blood flow using MR fingerprinting. in Proc. Intl. Soc. Mag. Reson. Med. 941 (2017).
5. Su, P. et al. Multiparametric estimation of brain hemodynamics with MR fingerprinting ASL. Magn. Reson. Med. 78, 1812–1823 (2017).
6. Jiang, Y., Ma, D., Seiberlich, N., Gulani, V. & Griswold, M. A. MR fingerprinting using fast imaging with steady state precession (FISP) with spiral readout. Magn. Reson. Med. 74, 1621–1631 (2015).
7. Chung, S., Kim, D., Breton, E. & Axel, L. Rapid B1+ mapping using a preconditioning RF pulse with TurboFLASH readout. Magn. Reson. Med. 64, 439–446 (2010).
8. Weigel, M. Extended phase graphs: dephasing, RF pulses, and echoes - pure and simple. J. Magn. Reson. Imaging 41, 266–295 (2015).
9. Cao, X. et al. Robust sliding-window reconstruction for Accelerating the acquisition of MR fingerprinting. Magn. Reson. Med. 78, 1579–1588 (2017).
10. Derwig, I. et al. Association of placental T2 relaxation times and uterine artery Doppler ultrasound measures of placental blood flow. Placenta 34, 474–479 (2013).
Figures