0578
CARdiac and Placental imaging (CARP) in pregnancy to assess etiology of preeclampsia and predict cardiovascular disease risk in later life1Biomedical Engineering Department, School of Biomedical Engineering and Imaging Sciences, King's College London, London, United Kingdom, 2Academic Women's Health, King's College London, London, United Kingdom, 3Division of Cardiovascular Medicine, University of Oxford, Oxford, United Kingdom
Synopsis
Pre-eclampsia (PE) is one of the most common, yet serious, complications of pregnancy. Its manifestations during pregnancy -high blood pressure, proteinuria and placental lesions- are associated with both maternal and fetal morbidity and mortality. Maternal symptoms resolve after delivery but a lifelong elevated risk for cardiovascular disease (CVD) remains. The CARP study combines functional placental and fetal MRI with (maternal) cardiovascular MR during pregnancy at the time of maximal stress to the maternal heart, in an attempt to disentangle the complex cardiac and placental interactions in disease etiology and to predict maternal cardiovascular risk in later life.
Introduction
Pre-eclampsia (PE), one of the most common and serious complications of pregnancy (incidence 4-7% [1]), is a multi-organ disease clinically diagnosed with newly occurring high blood pressure and proteinuria. While the significant morbidity and mortality risk ceases following delivery, it carries a lifelong increased risk of cardiovascular disease (CVD) for the mother [2]. Placental pathology in PE are common but diverse and have been the focus of multiple studies. However, the shared risk factors for CVD and high-risk for recurrence point towards a significant cardiac involvement in PE which is currently under-investigated. Assessing both the placenta and the maternal heart comprehensively provides an opportunity to investigate both the etiology of PE and to predict maternal CVD risk in later life – opening opportunities for targeted screening and treatment.Methods
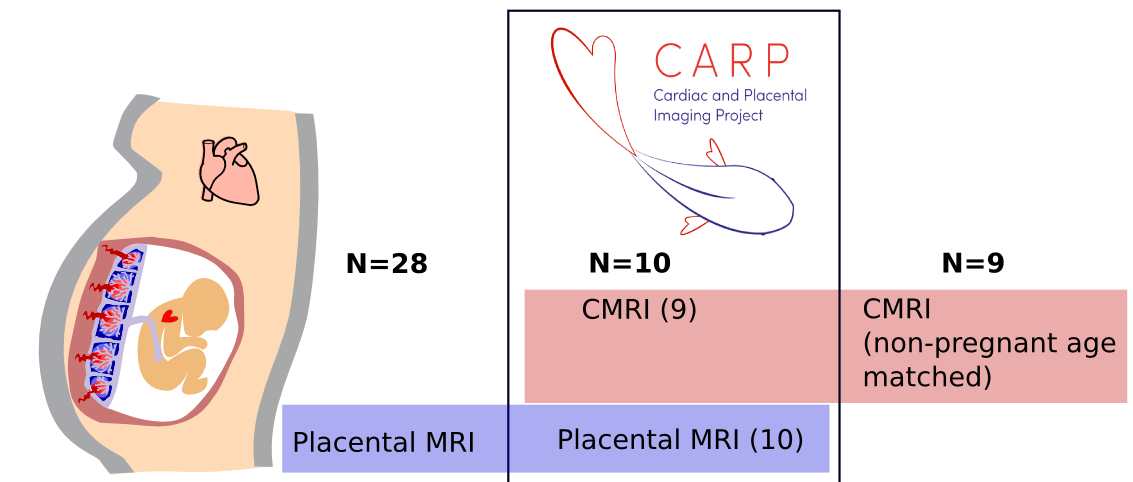
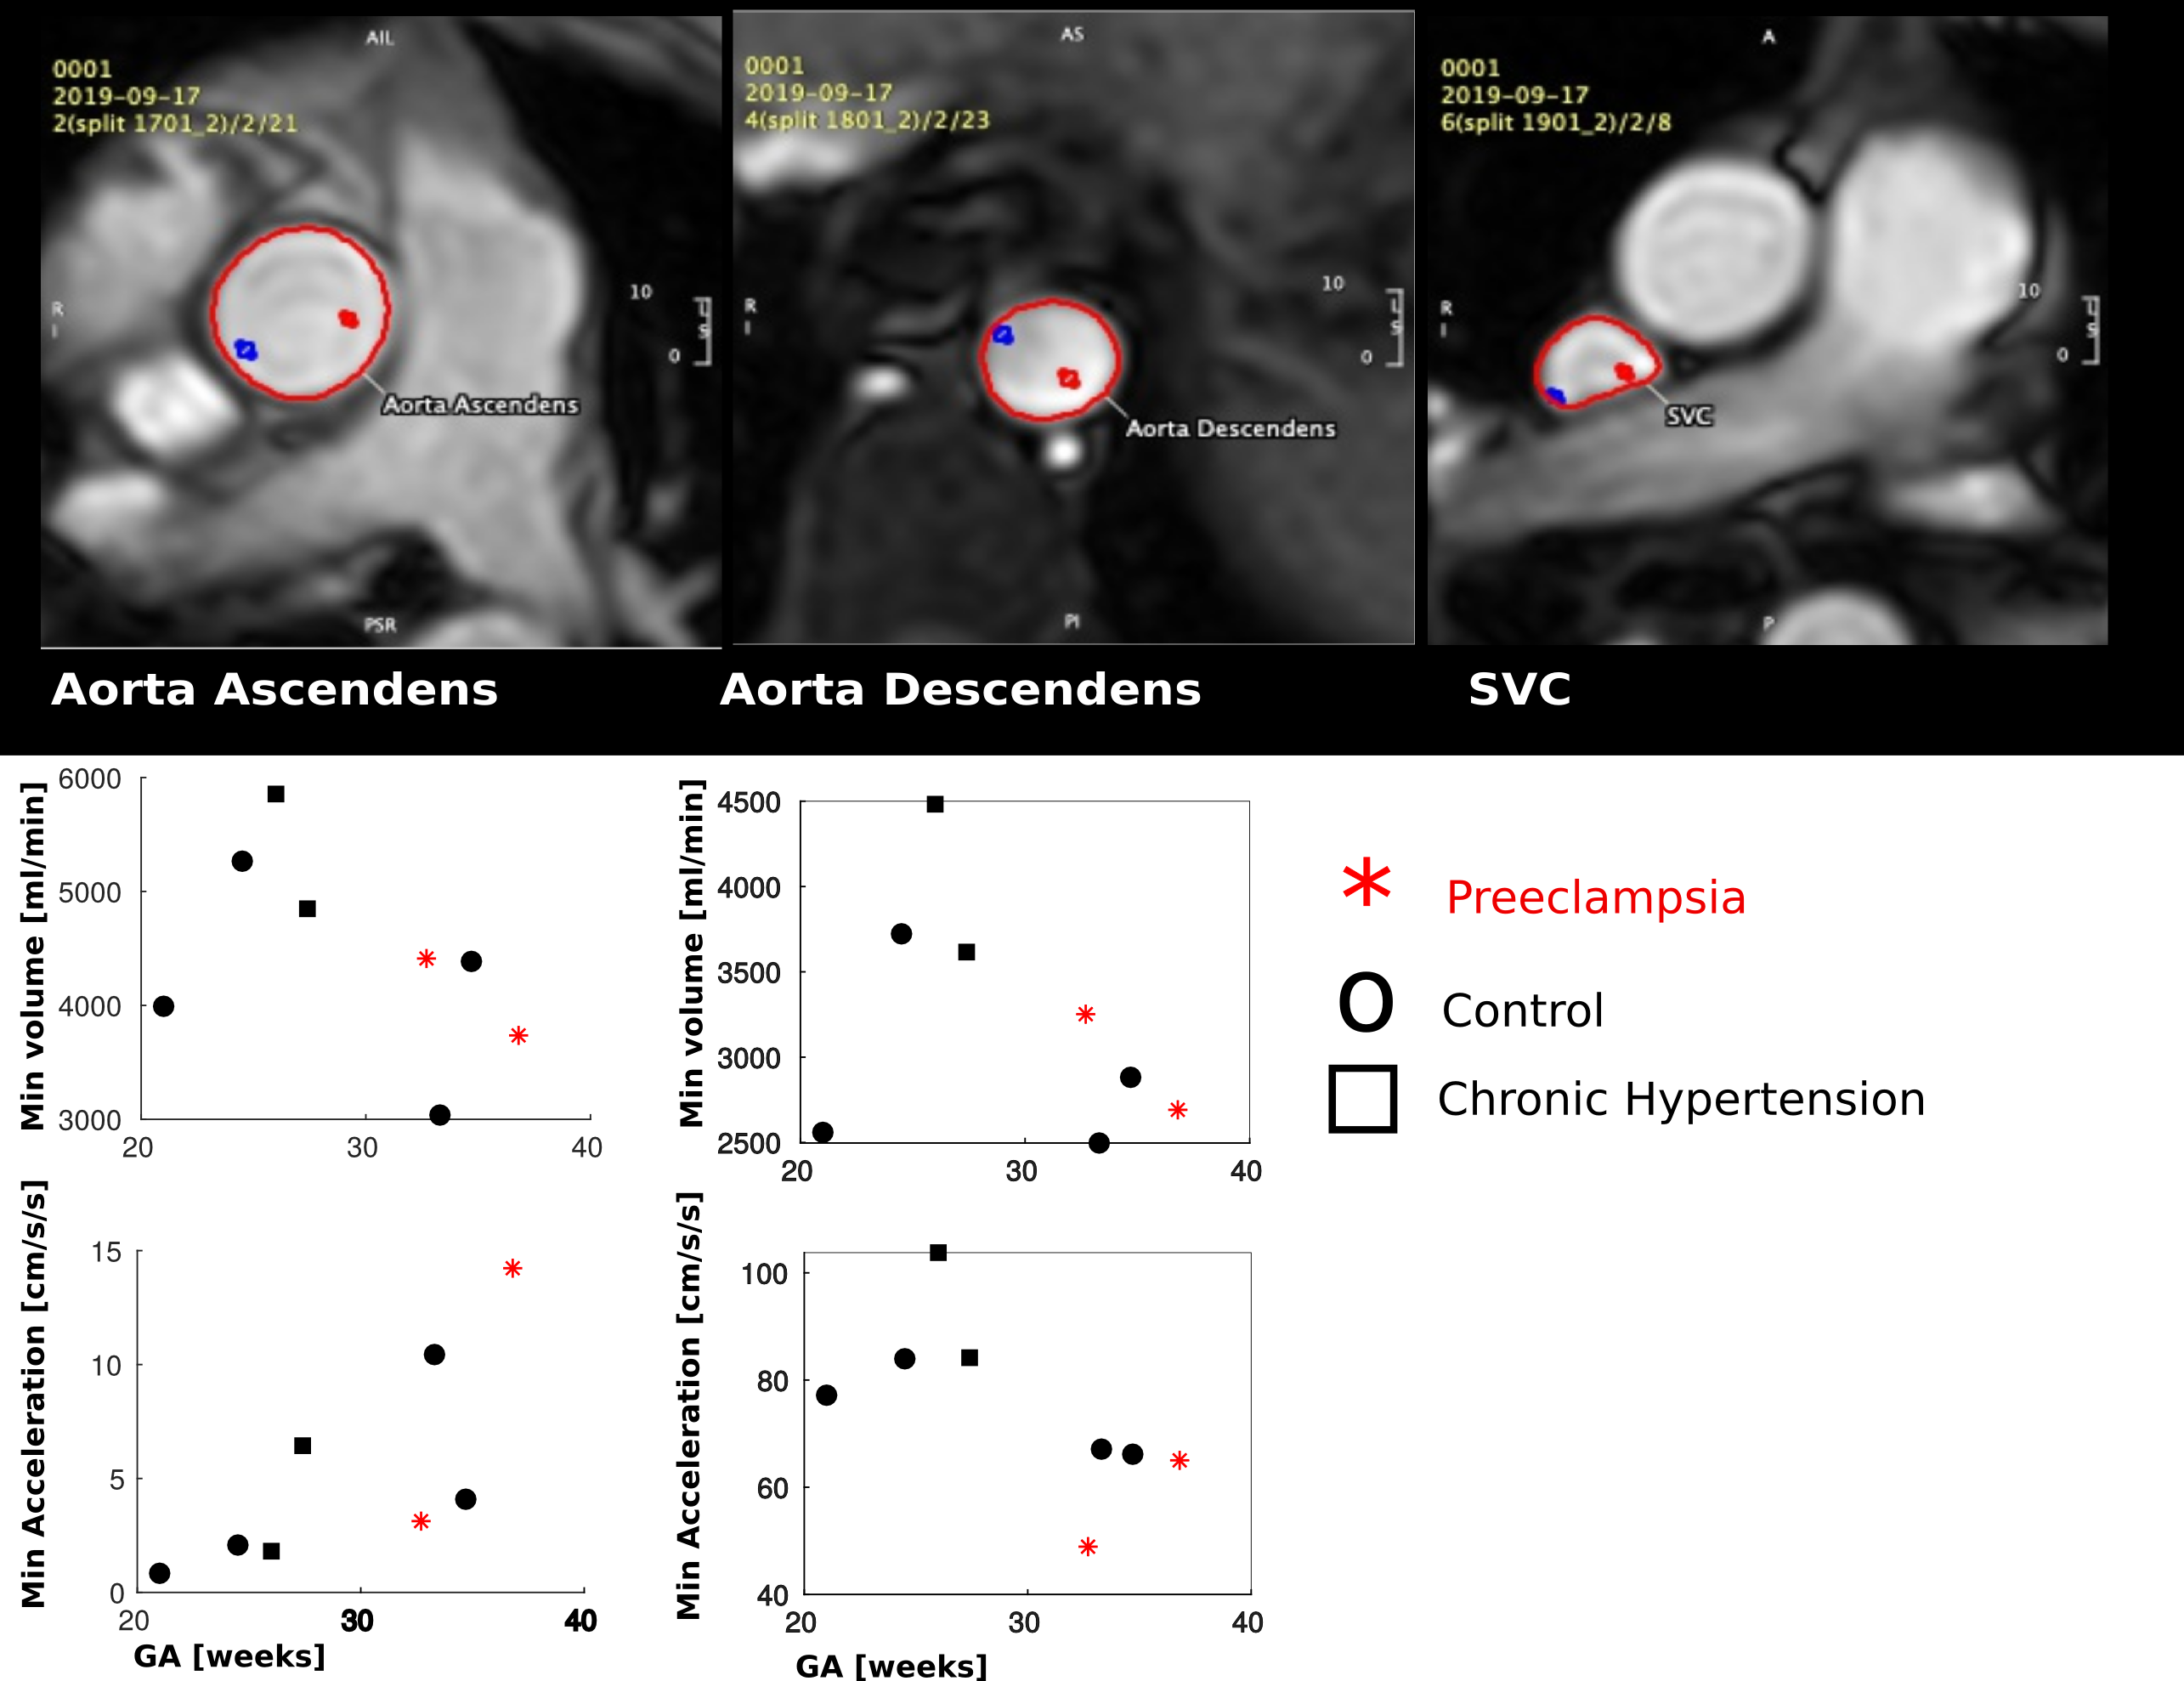
The ongoing CARdiac & Placental imaging (CARP) study is examining a total of 110 participant between 20-40 weeks of gestation, healthy pregnant women controls (HC), women with chronic hypertension (CH) and women with preeclampsia (PE), using a combined MRI protocol covering the maternal cardiovascular system, placenta and fetal brain, as well as collection of clinical information and biomarkers (See Fig1). After informed consent (19/LO/0852), pregnant women are scanned in supine position with continuous monitoring of blood pressure and oxygen saturations throughout the scan on a clinical 1.5T Philips Ingenia scanner using the torso 28-channel coil over two 30min sessions.Cardiac MR sequences were optimized for safe use during pregnancy by minimizing SAR (<50%), PNS (low) and acoustic noise (all scans <97db(A)). Cine bSSFP sequences are acquired in standard planes (4ch,2ch,3ch,short axis, aortic outflow), with 30 cardiac phases (~11sec breath-hold, FA=60, TE/TR~2/4ms, resolution=1.7x1.7x8mm) and a short-axis stack (with 14 slices, sense=2, resolution=2x2x10mm). Phase contrast flow sequences (30 phases, 14sec breath-hold, resolution: 2.5x2.5x8mm, sense=2) at the ascending Aorta (AA), descending Aorta (DA) and superior vena cava (SVC) were acquired with individually adapted encoding velocities. Anatomy of the left ventricle (LV) was studied from the end diastolic frame of the Cine bSSFP images. Manual segmentation of the LV myocardium is performed, and 3D meshes built using the computational anatomy toolkit [5, 6]. A statistical shape model is then built with a Principal Component Analysis (PCA), finding the main modes of anatomical variation. The flow data was processed using CVI42 Flow (version 5.10.3). Vessels were contoured in the magnitude image with the sharpest contrast. Contours were propagated to phase contrast images in all temporal phases and corrected manually, if required.Fetal structural imaging is performed using 2D-single-shot Turbo-Spin-Echo (resolution 1.5x1.5x2.5mm, FOV=320x320x110mm, TE=180ms) in three orthogonal planes centred on the fetal brain and in two planes covering the entire uterus in coronal and sagittal stacks. Fetal 3D brain data was reconstructed using Slice-to-Volume-Reconstruction [4].Functional placental MRI acquisition includes, based on previous projects [3], a multi-echo gradient-echo sequence (2.5mm isotropic, FOV=300x300x110mm, TEs=11,58,117,176ms) repeated twice spaced by 10min for robustness against subclinical contractions and a diffusion-weighted single-shot EPI sequence (b=0,b=500), resolution=4mm isotropic, FOV=300x300x100mm). Mean T2* was calculated over placental ROI from T2*-maps obtained from mono-exponential fitting [3], ADC and MD maps were calculated using Mrtrix3. Finally, flow in the inferior vena cava (IVC) was measured. Data from the first 10 CARP participants are shown here, together with supporting data from other studies for both placental and CMR assessments: 28 previously acquired placenta data sets (25 healthy control, 2 PE) examined using the same placental protocol as described and 9 age-matched non-pregnant Cine bSSFP scans. The data collection is illustrated in Fig1.Results
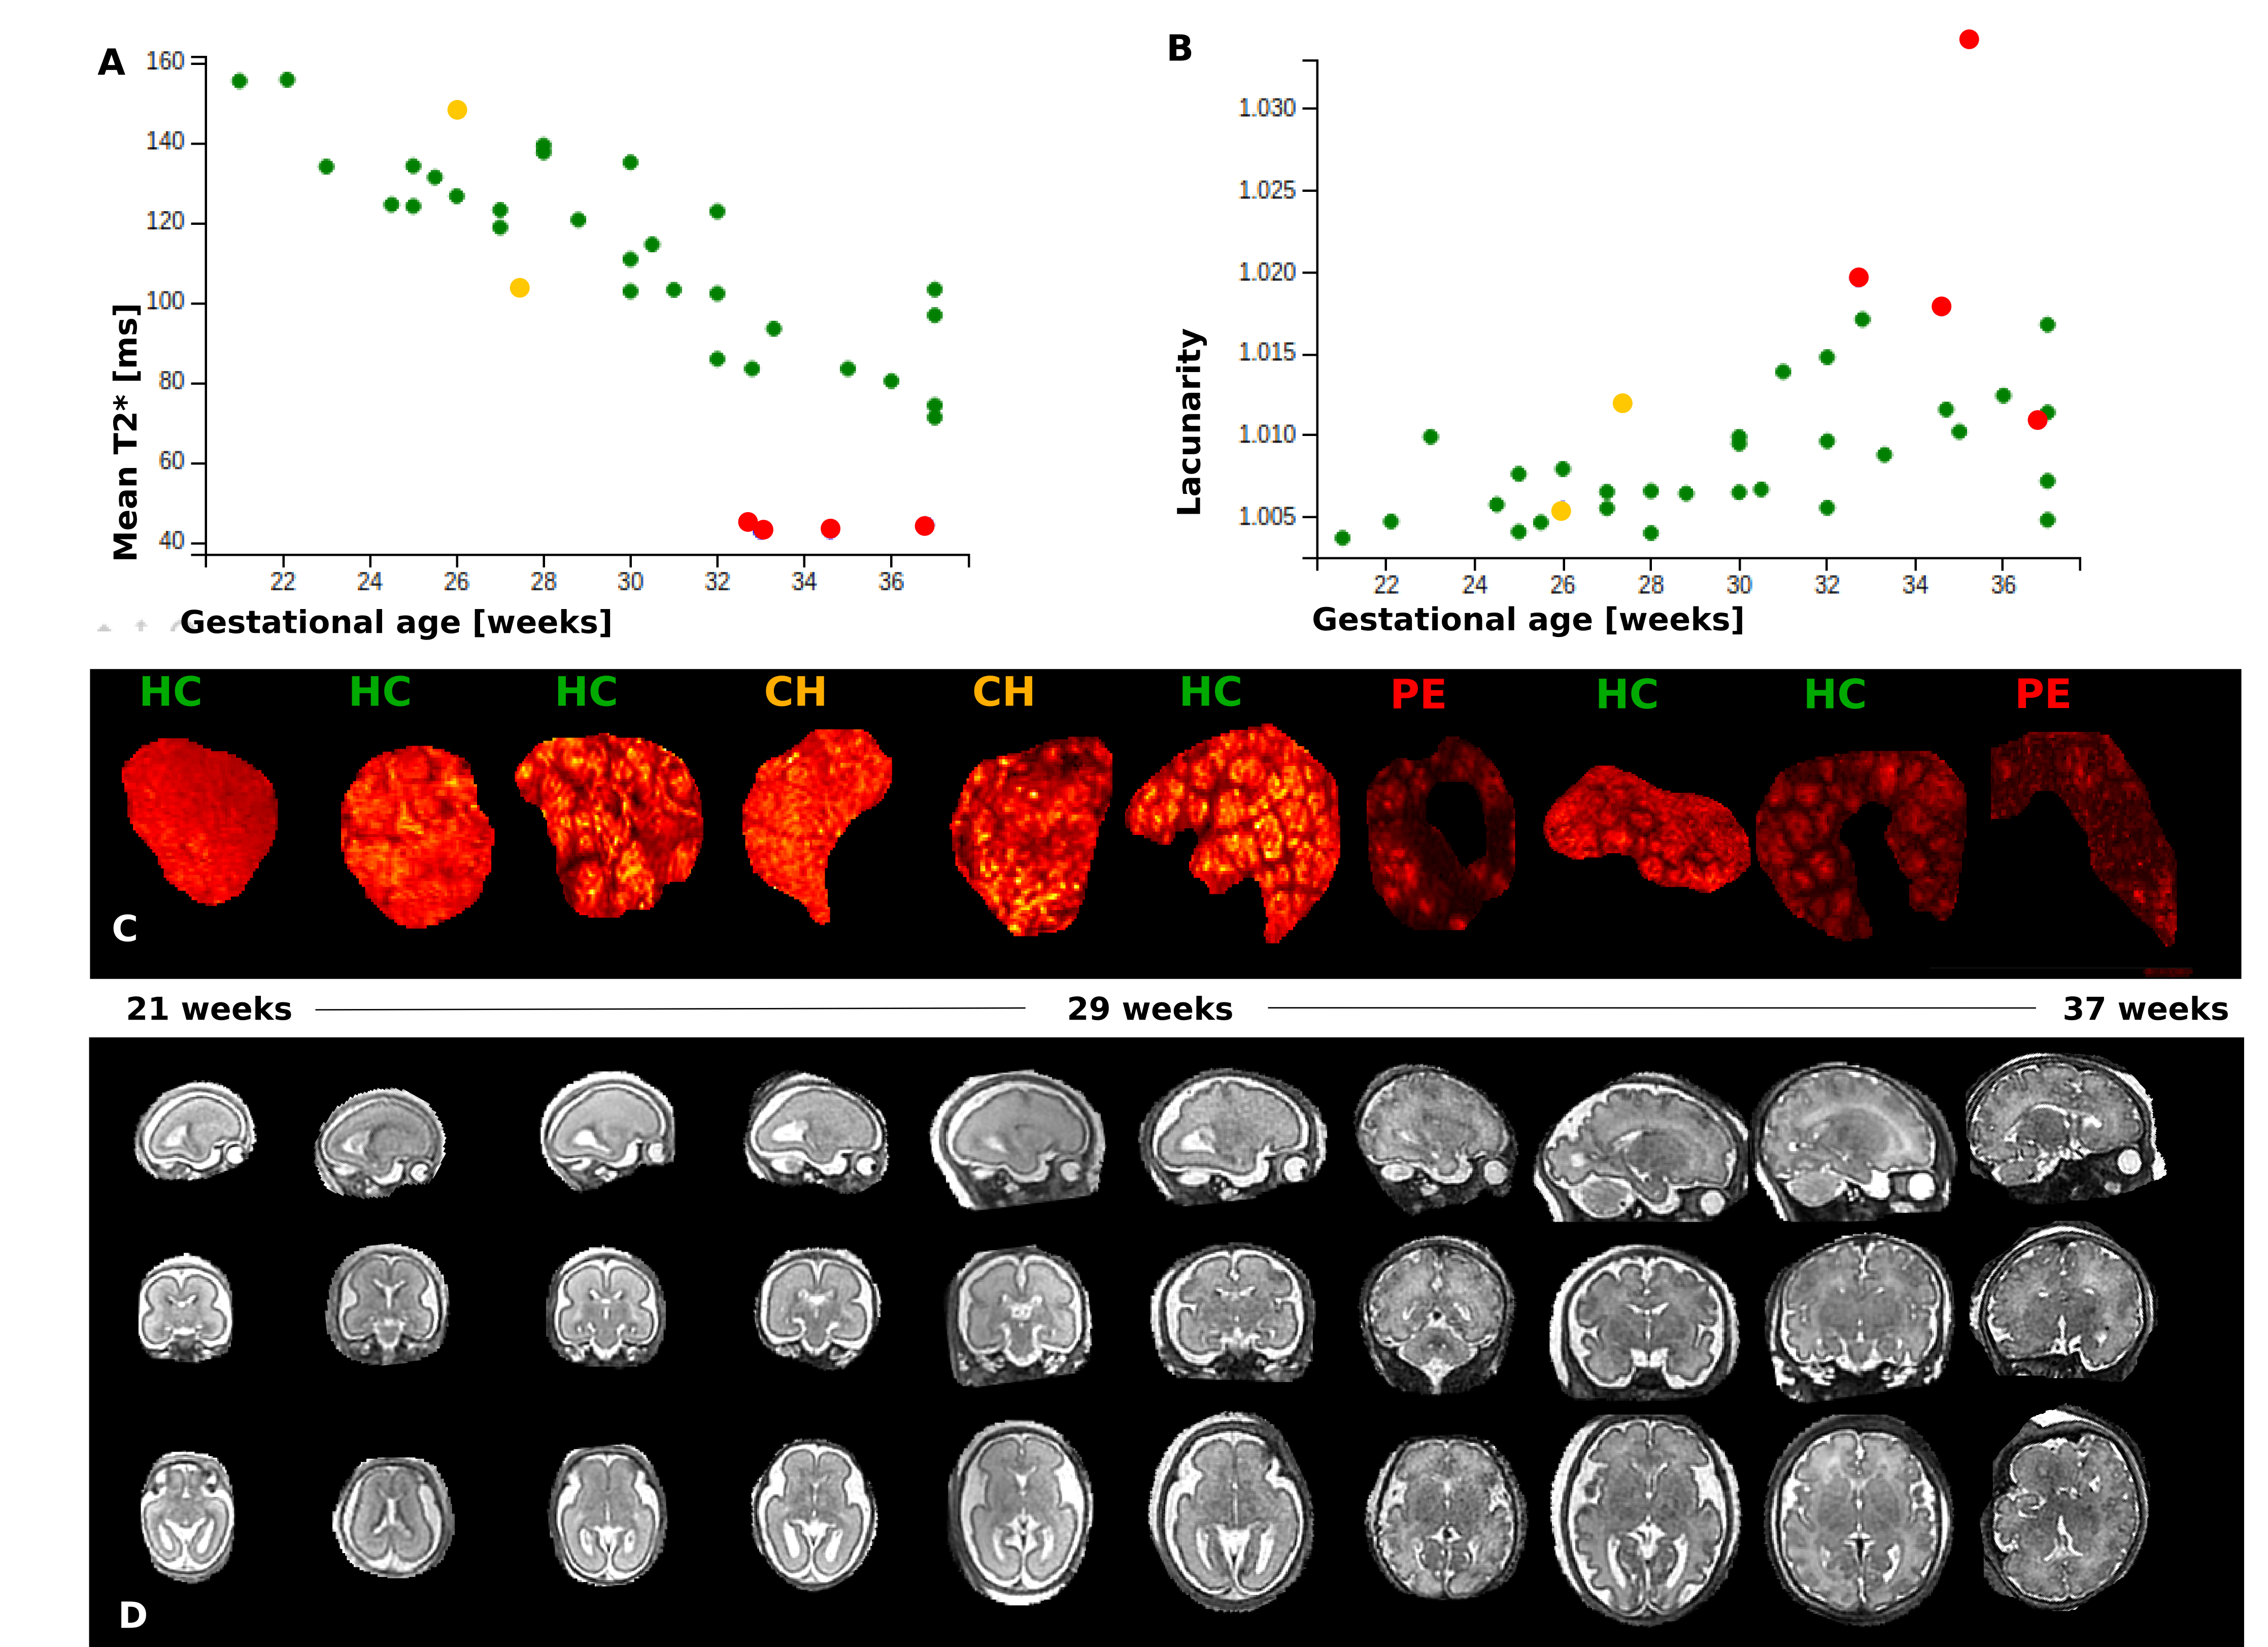
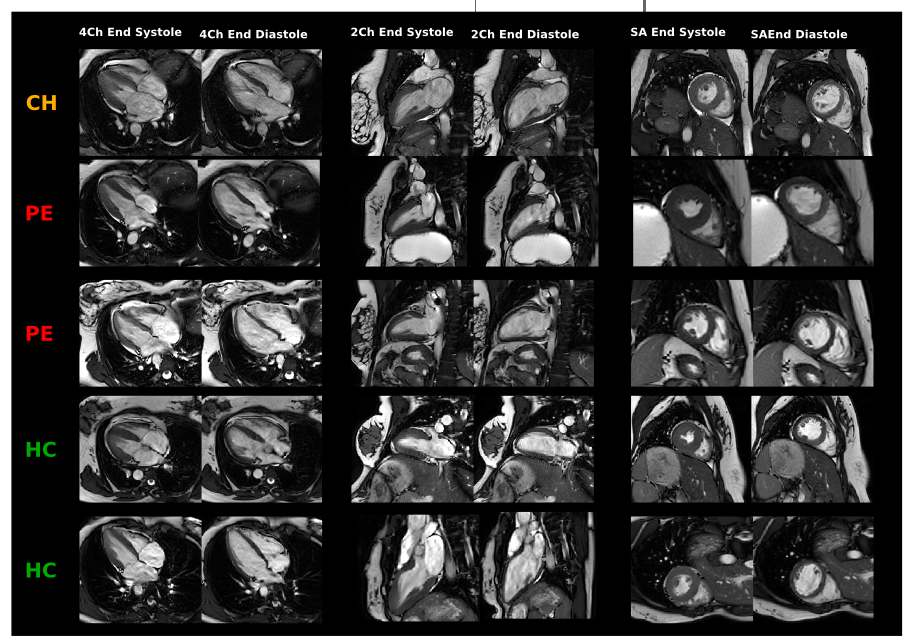
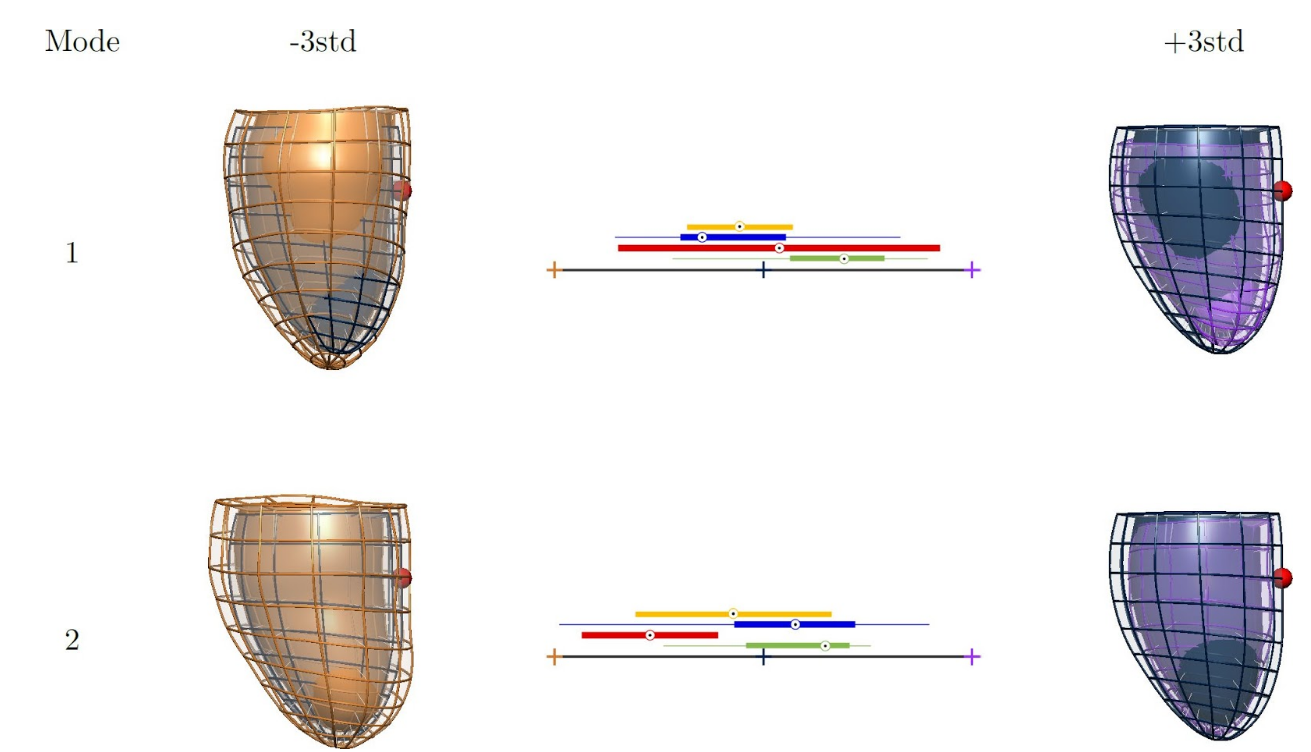
Complete combined datasets have been obtained from 9/10 participants (5 controls, 2 CH, 2 PE). The cardiac assessment could not be completed in 1 woman due to claustrophobia. The placental phenotype previously associated with pre-eclampsia was confirmed, consisting of decreased mean T2* and increased lacunarity (Fig2), both quantitatively (A-B) and qualitatively (C). The fetal brain data was successfully reconstructed to 3D volumes prepared for volumetric and surface analysis (D).The CMR protocol was successfully adapted for safe use in pregnancy while maintaining image quality as can be observed in Fig3 illustrating 2Ch, 4Ch and SA views in end-systole and end-diastole. Statistical cardiac mesh analysis shows a tendency in mode 2 to develop thicker cavities and walls in the evolution from control, CH and PE (Fig4). Finally, the calculated minimal volumes and acceleration values calculated from the flow data (Fig5) suggest a general trend towards increasing acceleration in the ascending aorta.Discussion & Conclusion
The initial results of this study show that it is possible to acquire comprehensive data from the placenta, fetal brain, maternal heart and major vessels in-vivo within 60min. Distinctive features in the abnormal cases are consistent with comparable data (placental T2*) and in line with postpartum results (enlarged ventricles) but allow for the first time combined interrelated data during pregnancy. The study thus has the potential to identify a unique window of opportunity for assessment and future potential intervention. Next steps will include comprehensive analysis of pregnancy MRI data in all 110 participants and comparison with additional collected biomarkers and postpartum CMRI results. Longer term, the data created from this study can potentially inform both screening for onset of PE and later cardiovascular life risk for women at high risk.Acknowledgements
The authors acknowledge all clinical and scanning team involved in these projects and are grateful to the patients and volunteers recruited for this project. This work was supported by the NIH Human Placenta Project grant 1U01HD087202-01 (Placenta Imaging Project (PIP)), the Wellcome Trust (Sir Henry Wellcome Fellowship, 201374/Z/16/Z), as well as the Wellcome EPSRC Centre for Medical Engineering at King;s College London (WT 203148/Z/16/Z) and by the National Institute for Health Research (NIHR) Biomedical Research Centre based at Guy’s and St Thomas’ NHS Foundation Trust and King’s College London. The views expressed are those of the authors and not necessarily those of the NHS, the NIHR or the Department of Health.References
[1] Pre-eclampsia, Steegers at al., The Lancet, 2010:376:9741:631-644
[2] Preeclampsia and Cardiovascular Disease in a Large UK Pregnancy Cohort of Linked Electronic Health Records, Leon et al., The Lancet 2019;140:1050–1060
[3] Multi-modal functional MRI to explore placental function over gestation, Hutter et al, MRM 2019. doi: 10.1002/mrm.27447.
[4] Reconstruction of fetal brain MRI with intensity matching and complete outlier removal, Med Image Anal. 2012 Dec;16(8):1550-64. doi: 10.1016/j.media.2012.07.004
[5] A. J. Lewandowskiet al.,“Preterm heart in adult life:cardiovascular magnetic resonance reveals distinct differences in left ventricular mass,geometry, and function,”Circulation,vol.127, pp. 197–206, 2013
[6] Lamata et al.,“An accurate, fast and robust method to generate patient-specific cubicHermite meshes,”Med. Image Anal., vol. 15, no. 6, pp. 801–813, 2011
Figures