0574
The additive value of quantitative contralateral background parenchymal enhancement for the prediction of residual disease in the I-SPY 2 TRIAL1University of California, San Francisco, San Francisco, CA, United States, 2'Quantum Leap Healthcare Collaborative, San Francisco, CA, United States
Synopsis
This study tested the additive value of quantitative background parenchymal enhancement (BPE) assessed in the contralateral breast in the prediction of treatment response for patients with locally advanced breast cancer undergoing neoadjuvant chemotherapy (NAC). BPE predictors were added to the prediction models together with functional tumor volume predictors. Our results showed that combined model achieved better prediction for pathologic complete response in HER2-positive HR-negative cancer subtype after 3 weeks of NAC. The additive values of BPE were also observed at inter-regimen (12-week) for triple negatives, and at the pre-surgery for HR-positive subtypes.
Introduction
Background parenchymal enhancement (BPE) is defined as the enhancement of normal fibroglandular tissue on DCE-MRI. Prominent BPE can cause overestimation in both the tumor volume calculation and prediction of treatment response. Interestingly, the decrease in BPE has also shown the association with treatment outcomes1. In this study, we fully automated the quantitative calculation of BPE in the contralateral breast in DCE-MRI and tested it as an extra feature in addition to the standard functional tumor volume (FTV)2, 3 to predict treatment response for women with locally advanced breast cancer undergoing neoadjuvant chemotherapy.Methods
Participants in I-SPY 2 receive 12 weekly doses of paclitaxel alone (standard of care) or in combination with an experimental agent, followed by anthracycline-cyclophosphamide (AC) prior to surgery. Patients with HER2+ cancer also received trastuzumab for the first 12 cycles. A subset of I-SPY 2 patients that were randomized to receive one of the eleven completed drug arms by October, 2016 was considered in this study. A DCE-MRI exam was performed at four time points during the treatment: pre-treatment (T0), early treatment (T1, 3 weeks after treatment initiation), inter-regimen (T2, between regimens), and pre-surgery (T3, after the completion of both regimens). Both FTV and BPE were calculated in each DCE-MRI exam using in-house software. FTV was assessed by summing voxels with early (approximately 2 and a half minutes after the contrast injection) percent enhancement (PE) above 70% and signal enhancement ratio (SER) above zero within a manually delineated 3-dimentional (3D) region of interest (ROI). Quantitative BPE was calculated as the mean PE among fibroglandular tissue in 5 continuous axial slices located in the geometrical center in the contralateral breast. Baseline and percent change of FTV or BPE at T1 to T3 were calculated as imaging predictors for treatment response. Pathologic complete response (pCR) was defined as absence of invasive residual disease in the breast and axillary lymph nodes at the time of surgical resection. Logistic regression modeling was used to study the association between imaging predictors and pCR status. The area under the ROC curve (AUC) applying 10-fold cross validation was used to evaluate the predictive performance. The optimized model was built by finding the model with the highest AUC among possible models with FTV predictors only (“FTV only”) and FTV plus BPE predictors (“FTV + BPE”) using all combinations of predictors available for testing at a specific time point. Optimized models were built separately for each cancer subtype defined by hormone receptor (HR +/-) and human epidermal growth factor receptor 2 (HER2 +/-). The 95% confidence interval (CI) of cross-validated AUC was estimated using 1,000 bootstrap resamples. The AUCs of two different ROC curves were compared using a 2-sided bootstrap test with 2,000 replicates. P-values of imaging predictors included in the logistic regression model were estimated using the likelihood ratio test of nested models. Results were considered as statistically significant if the relevant nominal p-value was less than 0.05.Results
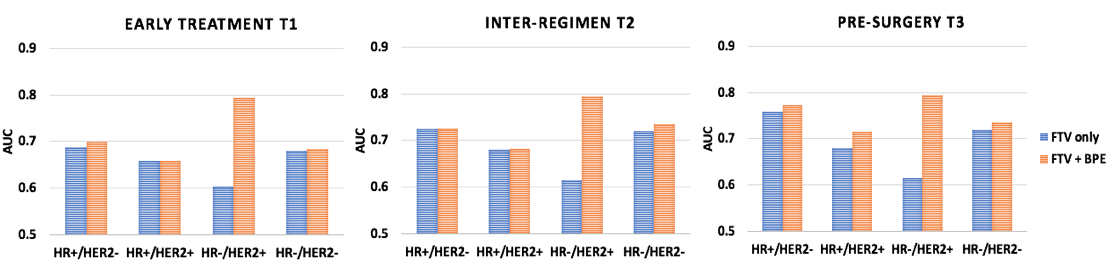
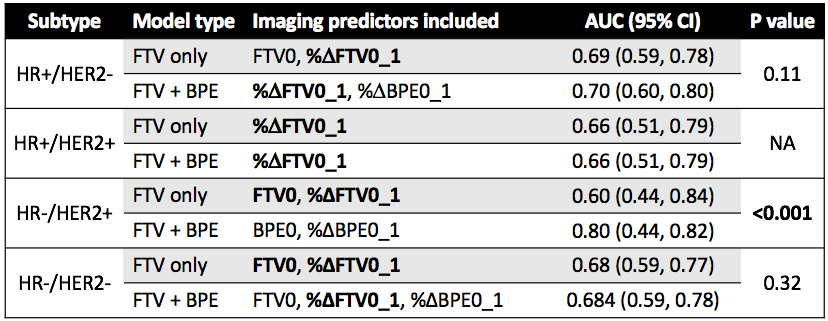
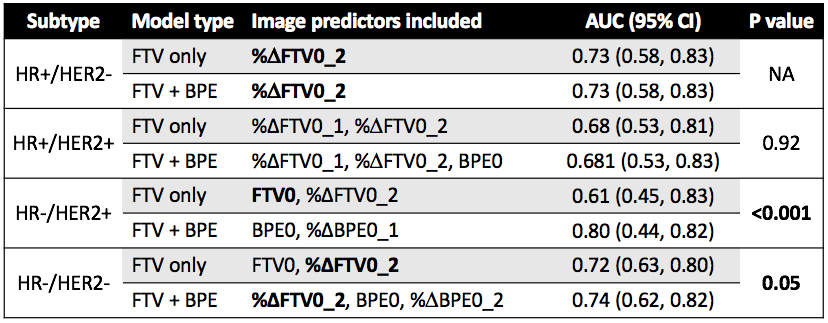
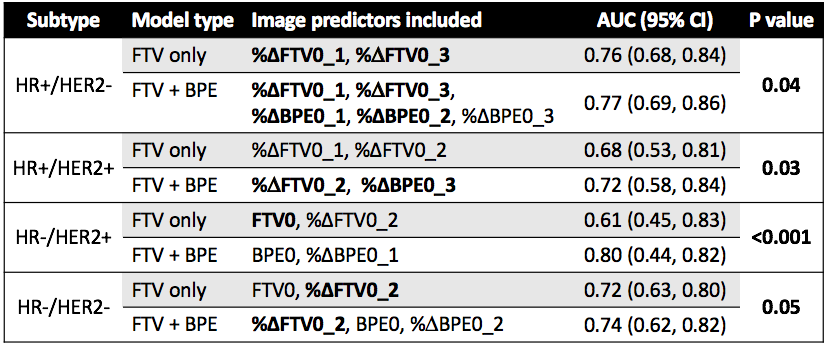
A total of 491 patients who had both FTV and BPE measurements at all four time points were included in this analysis, among which 172 patients (35%) achieved pCR. The number of patients and pCR rate differed among cancer subtypes: n = 212, pCR rate = 18% for HR+/HER2-; n = 78, pCR rate = 36% for HR+/HER2+; n = 42, pCR rate = 71% for HR-/HER2+; n=159, pCR rate = 47% for HR-/HER2- (triple negative). Figure 1 shows AUC plots based on using optimal models with FTV predictors only versus FTV and BPE combined at T1, T2, and T3 by HR/HER2 subtype. Figure 2–4 lists the corresponding AUC values with 95% CI, imaging predictors included in the optimal models, and p-values of the difference between AUCs of FTV only vs. FTV + BPE models. When examining the different subtypes, BPE resulted in a statistically significant increase in AUC for HR-/HER2+ at all time points (p < 0.001 in all time point comparisons). The form of optimized model remained the same across T1–T3, with BPE baseline and percent change of BPE at T1 included as the imaging predictors. For HR-/HER2-, the FTV + BPE model achieved higher AUC than FTV only at T2 and T3, with estimated AUCs being 0.74 (95% CI: 0.62–0.82). For HR+ subtypes (HER2+ or HER2-), FTV + BPE models achieved higher AUCs than FTV only models at T3 only.Discussion
The results of this study showed that adding BPE as an extra feature together with FTV can improve the predictive performance over FTV alone in all breast cancer subtypes. The additive value was observed at early-treatment for HR-/HER2+, inter-regimen for triple negatives, and pre-surgery for HR+ subtypes. The biggest impact was in the HR-/HER2+ subtype. Improving the quality and standardization of image acquisition will improve the ability to incorporate additional imaging features such as BPE to improve the accuracy and predictive power of MRI in the neoadjuvant breast cancer setting.In conclusion, the quantitative measured BPE in the contralateral breast can help provide additional predictive value to the standard functional tumor volume measured at the primary tumor bed, in the neoadjuvant therapies for locally advanced breast cancer.
Acknowledgements
This work was supported in part by NIH grants: R01 CA132870, U01 CA225427, and P01 CA210961.References
1. Liao GJ, Henze Bancroft LC, Strigel RM, et al: Background parenchymal enhancement on breast MRI: A comprehensive review. J Magn Reson Imaging jmri.26762, 2019
2. Hylton NM, Gatsonis CA, Rosen MA, et al: Neoadjuvant Chemotherapy for Breast Cancer: Functional Tumor Volume by MR Imaging Predicts Recurrence-free Survival-Results from the ACRIN 6657/CALGB 150007 I-SPY 1 TRIAL. Radiology 279:44–55, 2016
3. Hylton NM, Blume JD, Bernreuter WK, et al: Locally advanced breast cancer: MR imaging for prediction of response to neoadjuvant chemotherapy--results from ACRIN 6657/I-SPY TRIAL. Radiology 263:663–72, 2012
Figures