0573
Predicting response to neoadjuvant chemotherapy in breast cancer: machine learning-based analysis of radiomics features from baseline DCE-MRI1Department of Radiology, University of Cambridge, Cambridge, United Kingdom, 2Department of Radiology, Addenbrooke's Hospital, Cambridge, United Kingdom, 3Cancer Research UK, Cambridge, United Kingdom, 4GE Healthcare, Amersham, United Kingdom
Synopsis
This study investigated the prediction of pathological complete response (pCR) to neoadjuvant chemotherapy in breast cancer using radiomics features derived from pre-treatment DCE-MRI. 121 women with biopsy-confirmed breast cancers (44 pCR and 77 non-pCR) were imaged before treatment. 384 radiomics features were extracted from 5 post-contrast images. A logistic regression model trained on 21 of these features was able to predict pCR with an AUC of 0.78. The highest AUC (0.85) was achieved by using 7 features from only the 3rd post-contrast time point. Clinical and pathological features should be included to improve the accuracy of prediction.
Introduction
Neoadjuvant chemotherapy (NACT) is often used in the treatment of breast cancer patients with larger tumours to decrease the size of the tumour before surgery. Pathological complete response to chemotherapy (pCR), defined as the absence of residual invasive carcinoma in the breast or lymph nodes, has been shown to be an indicator of long-term survival1. Early prediction of response to treatment is crucial in avoiding unnecessary toxicity from ineffective treatment. Dynamic contrast-enhanced (DCE) magnetic resonance imaging (MRI) is increasingly used to monitor and assess response in breast cancer2, and pharmacokinetic parameters obtained from DCE-MRI have shown utility in the prediction of pCR3,4. Recent studies have shown that radiomics features extracted from pre-treatment DCE-MRI are associated with pCR5–8. This study investigated the selection of radiomics features derived from pre-treatment DCE-MRI, using machine learning techniques, to predict pCR in breast cancer.Methods
The data analysis workflow is shown in Figure 1.Data Acquisition: 121 patients with biopsy-confirmed breast cancers (44 pCR and 77 non-pCR) underwent imaging before neoadjuvant chemotherapy. All MR examinations were performed using a 3T system (MR750, GE Healthcare, Wakesha, WI) with a dedicated eight-channel breast array coil. DCE-MRI was acquired using a three-dimensional fast spoiled gradient-echo technique with k-space data sharing (volume image breast assessment-time-resolved imaging of contrast kinetics, or VIBRANT-TRICKS)9. 5 subtraction images were generated by subtracting pre-contrast images from post-contrast images acquired approximately 40s, 130s, 220s, 310s and 400s after contrast injection. Tumour regions were delineated on the second post-contrast image in the DCE-MRI series by a breast radiologist, and propagated to other time points in the DCE-image series and the subtraction images.
Radiomics Feature Extraction: For each subtraction volume, 74 features were extracted using the first-order histogram (18 features), Gray Level Co-occurrence Matrix (GLCM; 24 features), Gray Level Run Length Matrix (GLRLM; 16 features) and Gray Level Size Zone Matrix (GLSZM; 16 features). 14 shape features were also extracted from each tumour region. A total of 384 features were extracted for each lesion. Feature extraction was carried out using the Pyradiomics package10.
Statistical Analysis: The Mann-Whitney U-test was used to compare differences in features between the pCR and non-pCR groups. Features that showed statistically significant differences between groups (p < 0.05) were used to form a reduced feature-set that was utilised in subsequent analysis. Receiver operating characteristic curve (ROC) analysis was performed for each significant feature independently in the prediction of pCR.
Feature Selection and Predictive Modelling: Data were split in a patient-wise fashion into 80%:20% independent training and test datasets, with 10-fold cross-validation in the training set. Logistic regression classification models using the least absolute shrinkage and selection operator (LASSO), ridge regression and elastic net were trained on the training data, using the previously-derived reduced feature-set. The predictive performance of models was evaluated in the test set using ROC analysis, and sensitivity, specificity and area under the curve (AUC) were calculated. The model that achieved the highest AUC in predicting pCR and the features selected by the model were recorded. The analysis was repeated for each post-contrast time point individually using only shape features and the significant features from that time point.
Results
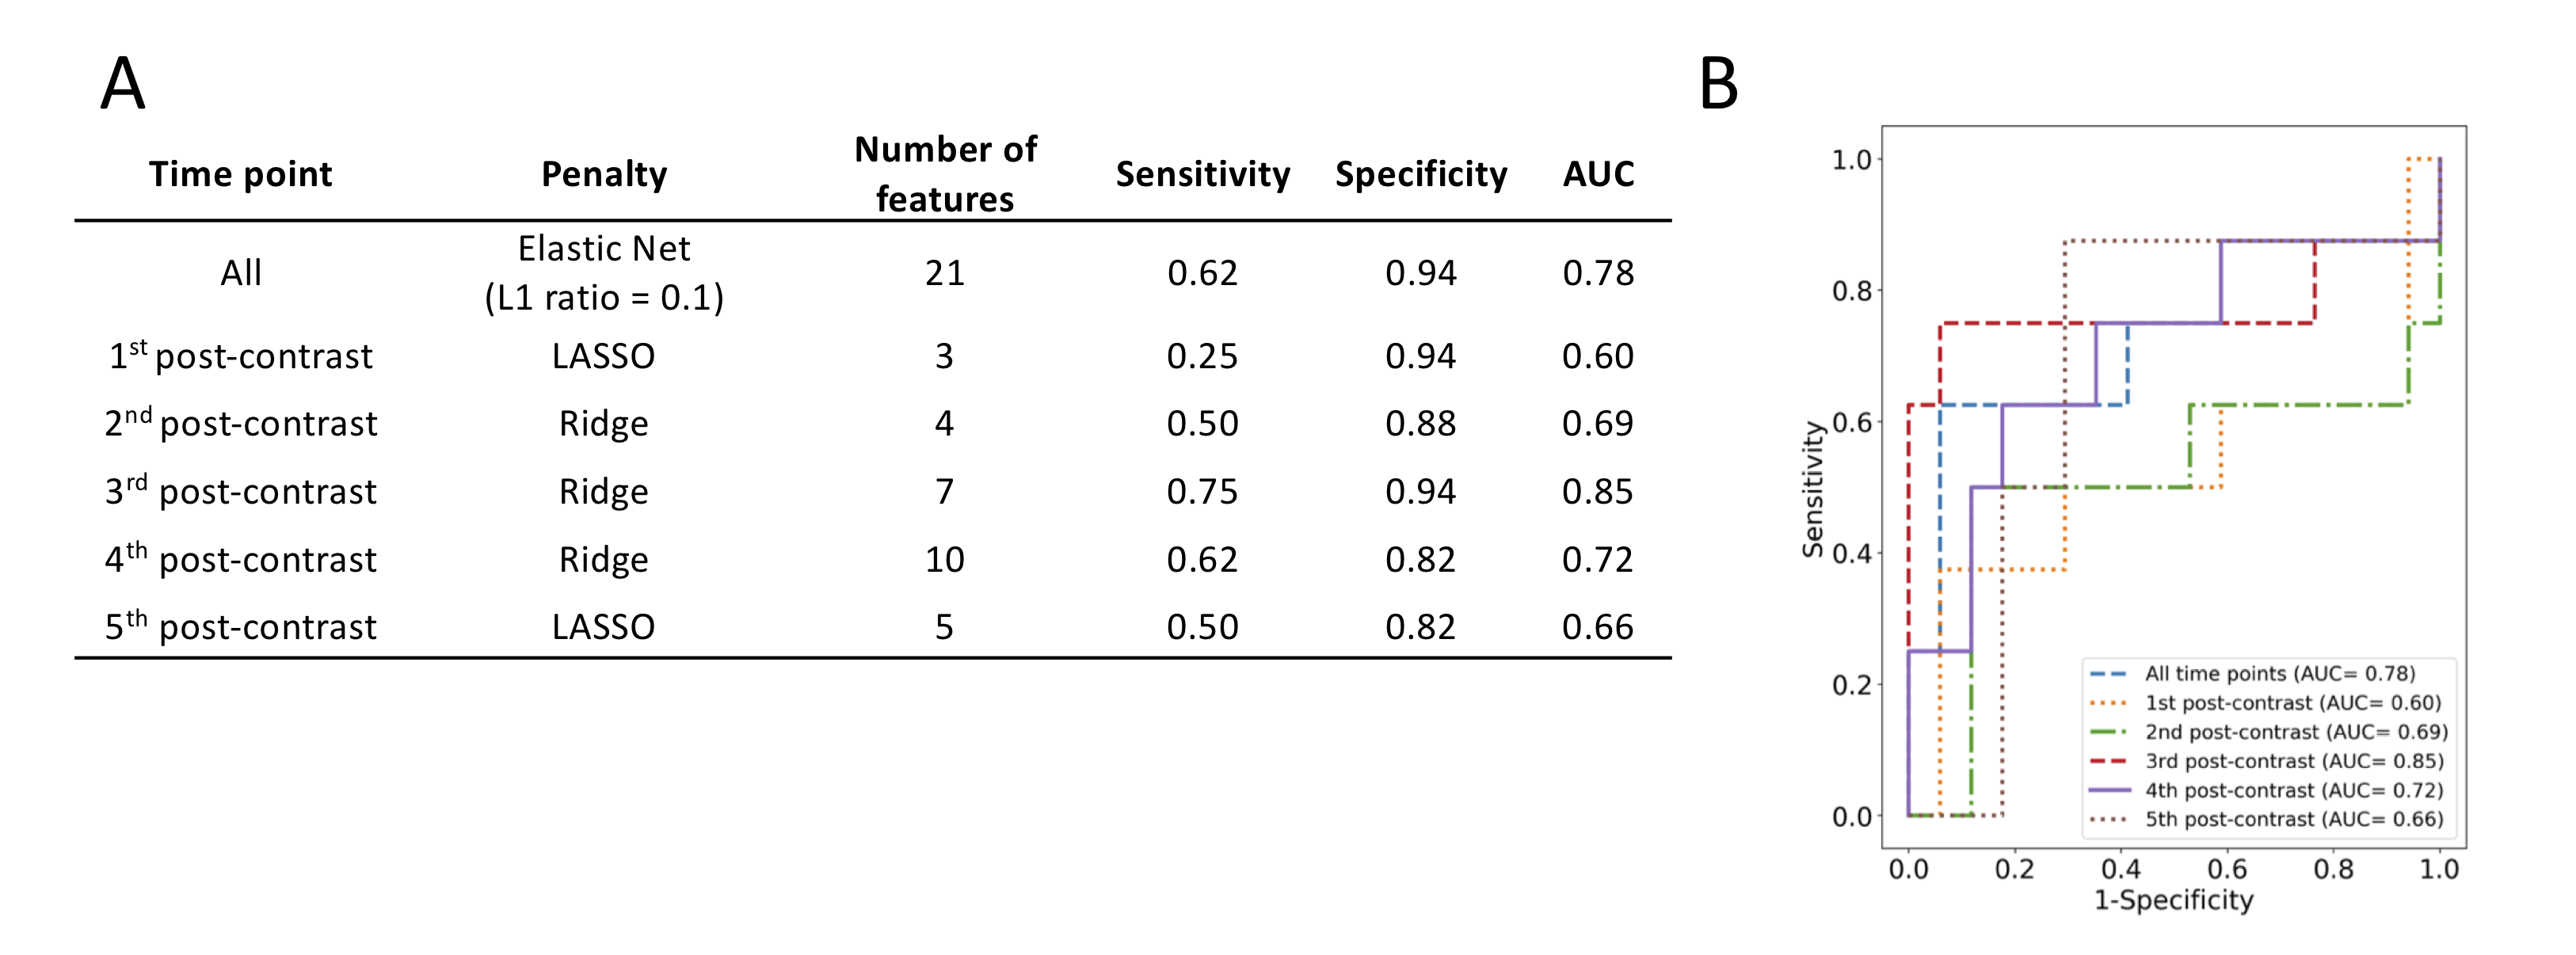
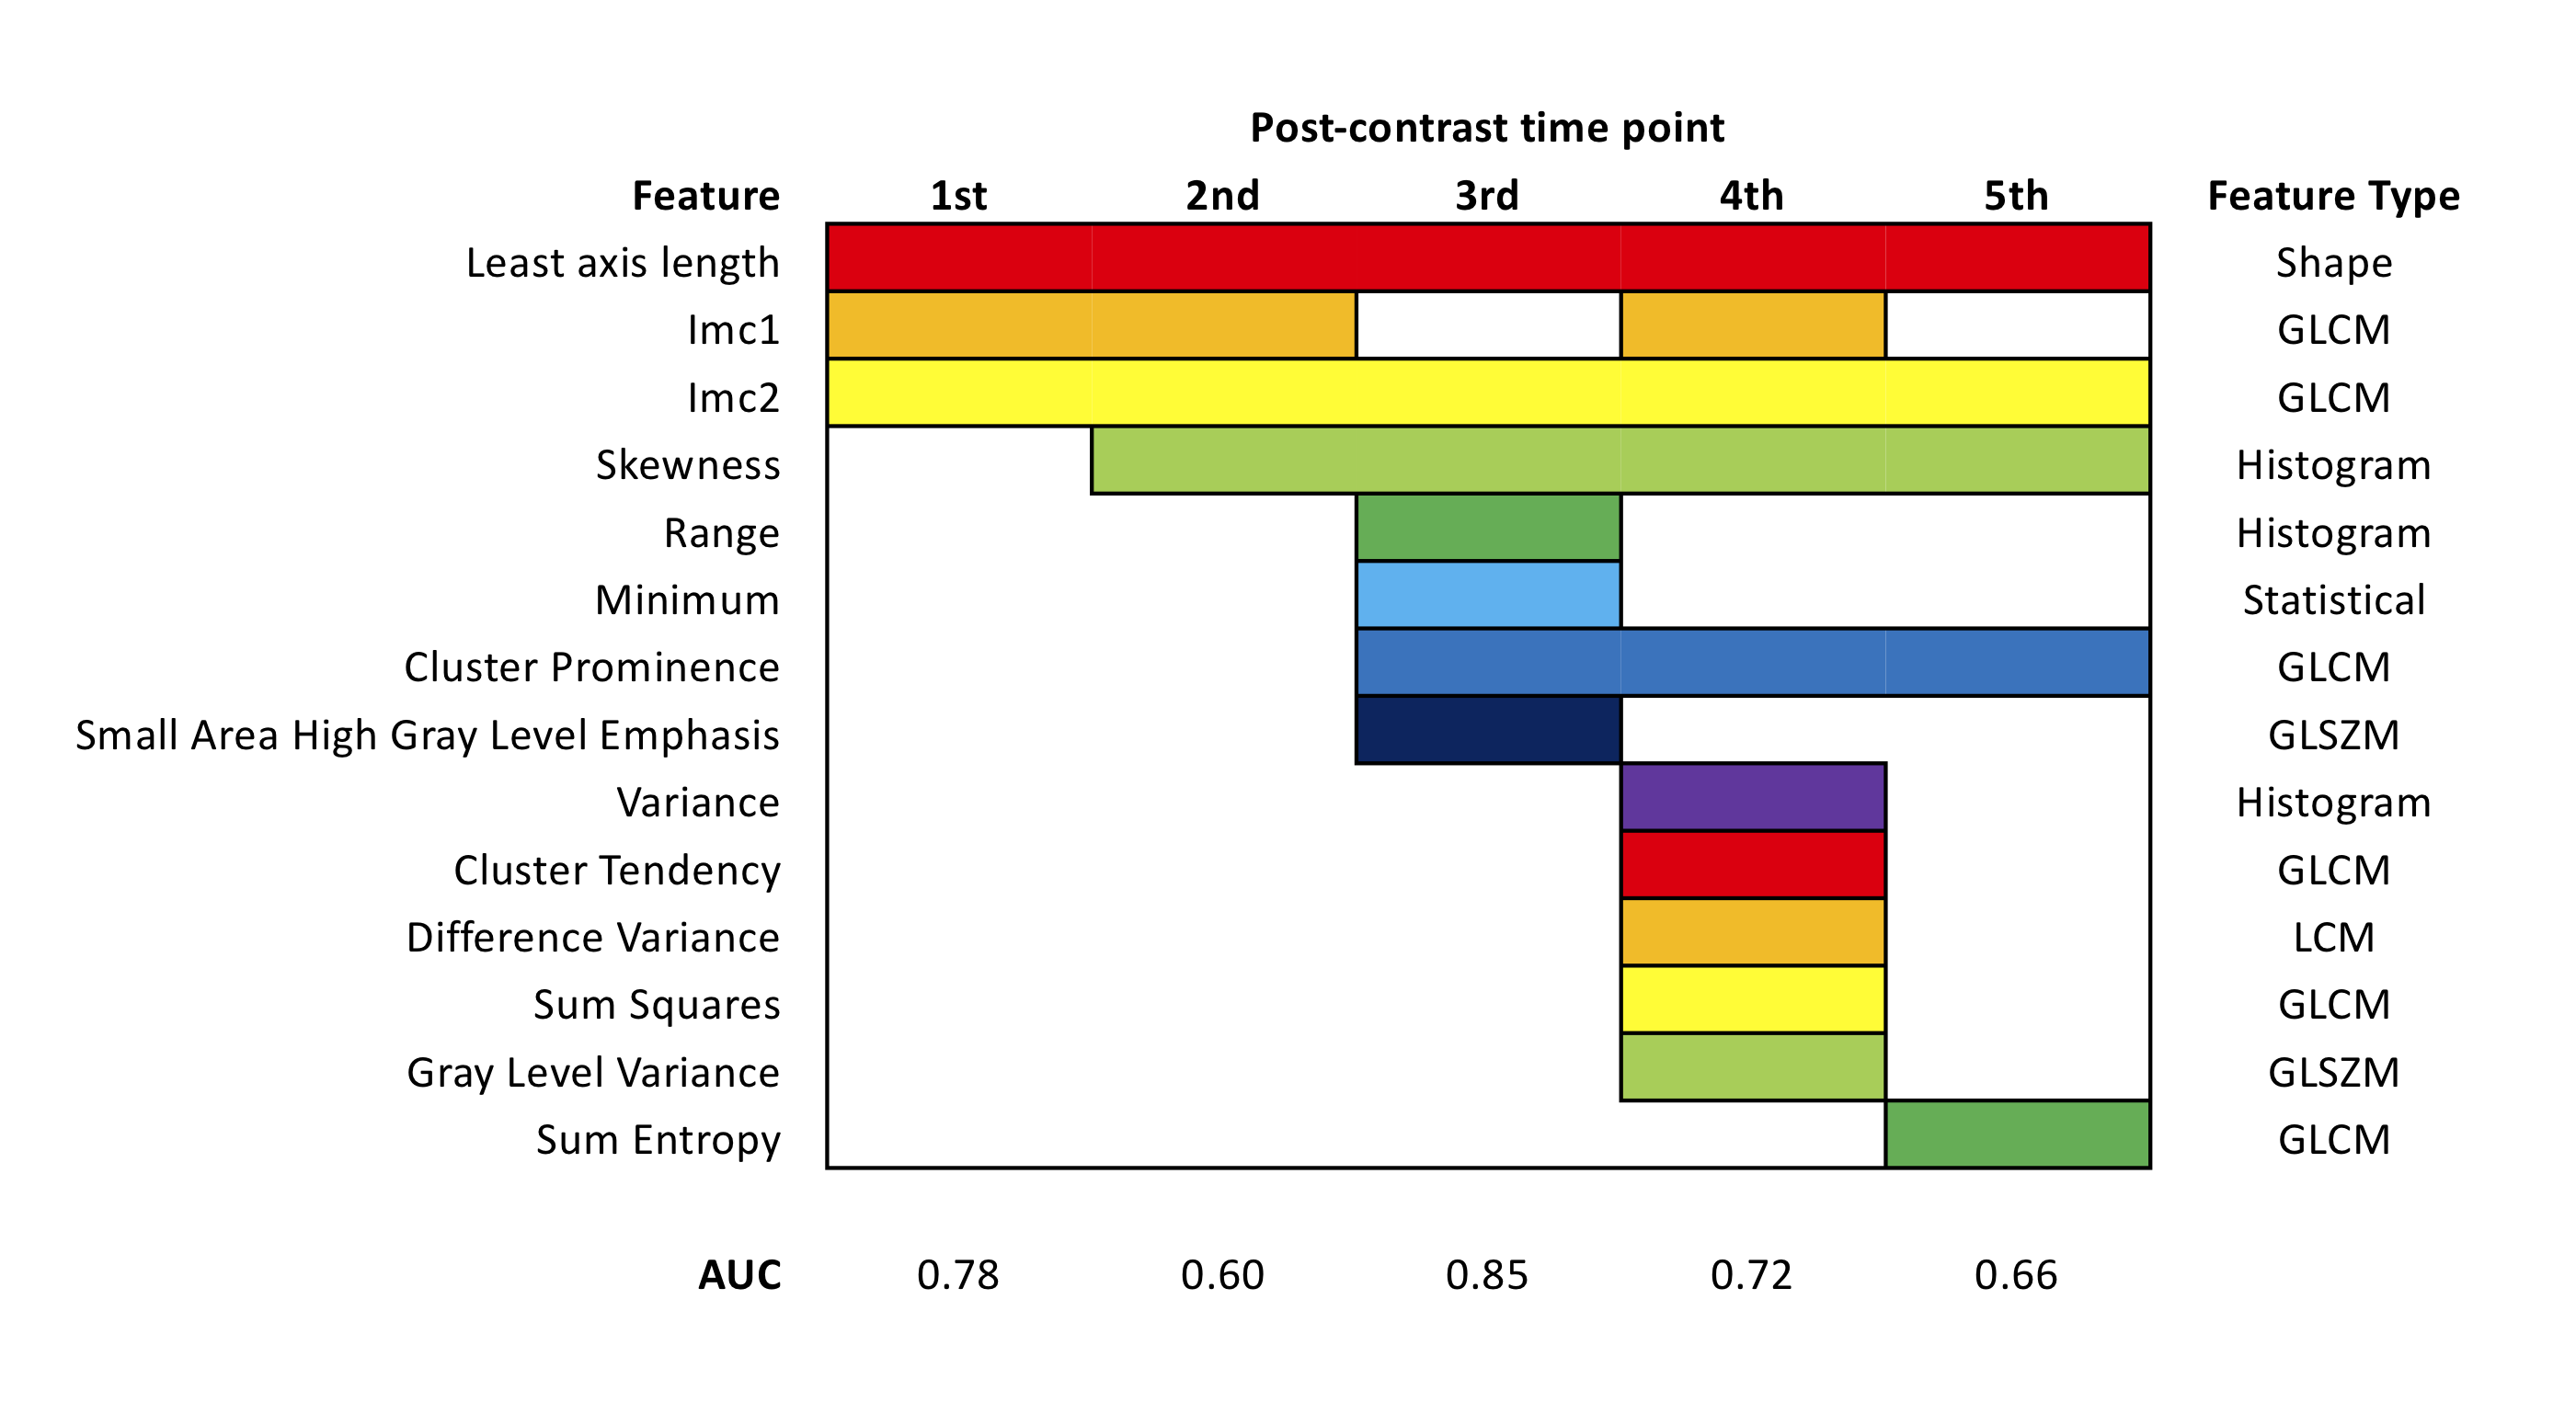
27 features showed statistically significant differences between pCR and non-pCR groups, 21 of which were selected for pCR prediction (Table 1, Figure 2). Texture features accounted for two-thirds of the features selected (14/21), the majority of which was extracted from the GLCM (12/21; 57%). Most of the features selected were derived from the 3rd, 4th and 5th post-contrast time points. Logistic regression using elastic net (L1 ratio = 0.1) achieved the highest AUC in predicting pCR, using features from all time points (AUC = 0.79).The diagnostic performance of models using features from each time point individually is given in Figure 3A. The highest AUC (0.89) was achieved using features from only the 3rd post-contrast time point (220s after contrast injection). ROC curves of the models are shown in Figure 3B. The features selected by the models at each time point are shown in Figure 4. Least axis length (shape) and Information Measure of Correlation 2 (GLCM) features were selected at all time points.
Discussion
Texture features derived from GLCM comprised the majority of features selected for pCR prediction. While these features have shown significance in predicting pCR, their link with tumour biology is not straightforward to interpret.The specificity of the models investigated was much higher than their sensitivity, suggesting these models are better at predicting non-responders. However, given the unequal number of responders vs non-responders in this study, subsequent analysis using a technique to account for group size imbalances, such as synthetic minority over-sampling technique (SMOTE), is anticipated to reduce classification bias.
Features derived from subtraction volumes achieved high performance in predicting pCR, potentially providing an alternative to pharmacokinetic mapping. Further work will investigate the addition of clinicopathological features (such as age, tumour subtype, receptor status), as this has been shown to significantly increase the performance of models predicting pCR11.
Conclusion
Radiomics features derived from pre-treatment DCE-MRI can predict pCR in breast cancer with a high accuracy. Clinical and pathological features should be included to improve the accuracy of prediction.Acknowledgements
No acknowledgement found.References
1. Esserman, L. J. et al. Pathologic complete response predicts recurrence-free survival more effectively by cancer subset: results from the I-SPY 1 TRIAL--CALGB 150007/150012, ACRIN 6657. J. Clin. Oncol. 30, 3242–9 (2012).
2. Mclaughlin, R. & Hylton, N. MRI in breast cancer therapy monitoring. NMR Biomed. 24, 712–720 (2011).
3. Lee, J., Kim, S. H. & Kang, B. J. Pretreatment prediction of pathologic complete response to neoadjuvant chemotherapy in breast cancer: Perfusion metrics of dynamic contrast enhanced MRI. Sci. Rep. 8, 9490 (2018).
4. Eom, H.-J. et al. Predictive Clinicopathologic and Dynamic Contrast-Enhanced MRI Findings for Tumor Response to Neoadjuvant Chemotherapy in Triple-Negative Breast Cancer. AJR. Am. J. Roentgenol. 208, W225–W230 (2017).
5. Ahmed, A., Gibbs, P., Pickles, M. & Turnbull, L. Texture analysis in assessment and prediction of chemotherapy response in breast cancer. J. Magn. Reson. Imaging 38, 89–101 (2013).
6. Teruel, J. R. et al. Dynamic contrast-enhanced MRI texture analysis for pretreatment prediction of clinical and pathological response to neoadjuvant chemotherapy in patients with locally advanced breast cancer. NMR Biomed. 27, 887–96 (2014).
7. Chamming’s, F. et al. Features from Computerized Texture Analysis of Breast Cancers at Pretreatment MR Imaging Are Associated with Response to Neoadjuvant Chemotherapy. Radiology 286, 412–420 (2018).
8. Cain, E. H. et al. Multivariate machine learning models for prediction of pathologic response to neoadjuvant therapy in breast cancer using MRI features: a study using an independent validation set. Breast Cancer Res. Treat. 173, 455–463 (2019).
9. Kershaw, L. E. & Cheng, H.-L. M. A general dual-bolus approach for quantitative DCE-MRI. Magn. Reson. Imaging 29, 160–6 (2011).
10. Van Griethuysen, J. J. M. et al. Computational radiomics system to decode the radiographic phenotype. Cancer Res. 77, e104–e107 (2017).
11. Xiong, Q. et al. Multiparametric MRI-based radiomics analysis for prediction of breast cancers insensitive to neoadjuvant chemotherapy. Clin. Transl. Oncol. (2019). doi:10.1007/s12094-019-02109-8
Figures