0572
Early Prediction of Breast Cancer Response to Neoadjuvant Chemotherapy Using Multi-Modal Diffusion MRI with Machine-Learning1Center for Magnetic Resonance Research, University of Illinois at Chicago, Chicago, IL, United States, 2Department of Bioengineering, University of Illinois at Chicago, Chicago, IL, United States, 3Department of Radiology, Cancer Hospital, Chinese Academy of Medical Sciences, Beijing, China, 4Departments of Radiology and Neurosurgery, University of Illinois at Chicago, Chicago, IL, United States
Synopsis
An early imaging assessment of breast cancer’s response to neoadjuvant chemotherapy (NAC) is critical for timely planning of treatment strategies. In this study, we develop a machine-learning-based approach to investigate whether the combined features obtained from the intravoxel incoherent motion and continuous-time random-walk diffusion models provide an early prediction of pathologic response in patients receiving NAC. Our results have shown that a gradient boosting classifier trained with the early-treatment parametric changes within tumor can predict the response with an accuracy that is 96% of the accuracy achieved by using the post-treatment parametric changes.
Introduction:
Neoadjuvant chemotherapy (NAC) can improve surgical management in both locally advanced inoperable and operable breast cancer1. For patients with insufficient response, however, receiving weeks of ineffective chemotherapy increases the toxic side effects; and more importantly delays alternative treatment. Therefore, an early imaging assessment of response to NAC is critical for managing breast cancer patients. Despite its success in predicting breast cancer response as early as after the first NAC cycle2-4, apparent diffusion coefficient (ADC) from diffusion-weighted MRI (DWI) has not been established as an imaging marker for breast cancer response to NAC5. While ADC has been shown to be associated with tissue cellularity, tumor tissue alterations during NAC often involve other changes, such as vascularity and structural heterogeneity. These various tumor tissue changes can be studied by utilizing a specific portion of the b-value “spectrum”6. For example, intravoxel incoherent motion (IVIM) model7 with low-b-values (~0-200; 800 s/mm2) can characterize micro-vascularity. High-b-value (~3500 s/mm2) non-Gaussian models, such as continuous-time random walk (CTRW) model8-10, can be used to probe tissue structural heterogeneity. In this study, we investigate the predictive power of multi-modal DWI, consisting of IVIM and CTRW models, for the pathologic response to NAC of breast cancer by utilizing a full b-value spectrum together with a machine-learning-based classification technique.Methods:
Patients: 26 histologically confirmed breast cancer patients with scheduled NAC were recruited to the study. Patients with Miller-Payne grade 4 or 5 were categorized as having a pathologic response (pR, n=10), and with grades 1-3 as not having a pR (npR, n=16).Image Acquisition: All patients were scanned on a 3T scanner (GE Healthcare, MR750) at three time points: before (pre-Tx), after the second course of (mid-Tx), and after (post-Tx) chemotherapy. The DWI was performed with 12 b-values (0 to 3000s/mm2), TR/TE=3500/80ms, slice thickness=5.5mm, FOV=34cm×34cm, and matrix=256×256.
DWI Analysis: The co-registered multi-b-value diffusion-weighted images11-13 at each time point were first analyzed with a CTRW model8,
$$S/S_0=E_α (-(bD_m )^β), (1)$$
by using all the 12 b-values. In Eq. (1), Dm is an anomalous diffusion coefficient, α and β are temporal and spatial diffusion heterogeneity parameters, respectively, and Eα is a Mittag-Leffler function. The diffusion-weighted images were also analyzed with an IVIM model7,
$$S/S_0 =fe^ \left(-b(D_{diff}+D_{perf} )\right) +(1-f)e^ \left(-bD_{diff} \right) , (2)$$
in the low b-value range (50-800 s/mm2). In Eq. (2), f is the perfusion fraction, Ddiff is diffusion coefficient, and Dperf is the pseudo-diffusion coefficient.
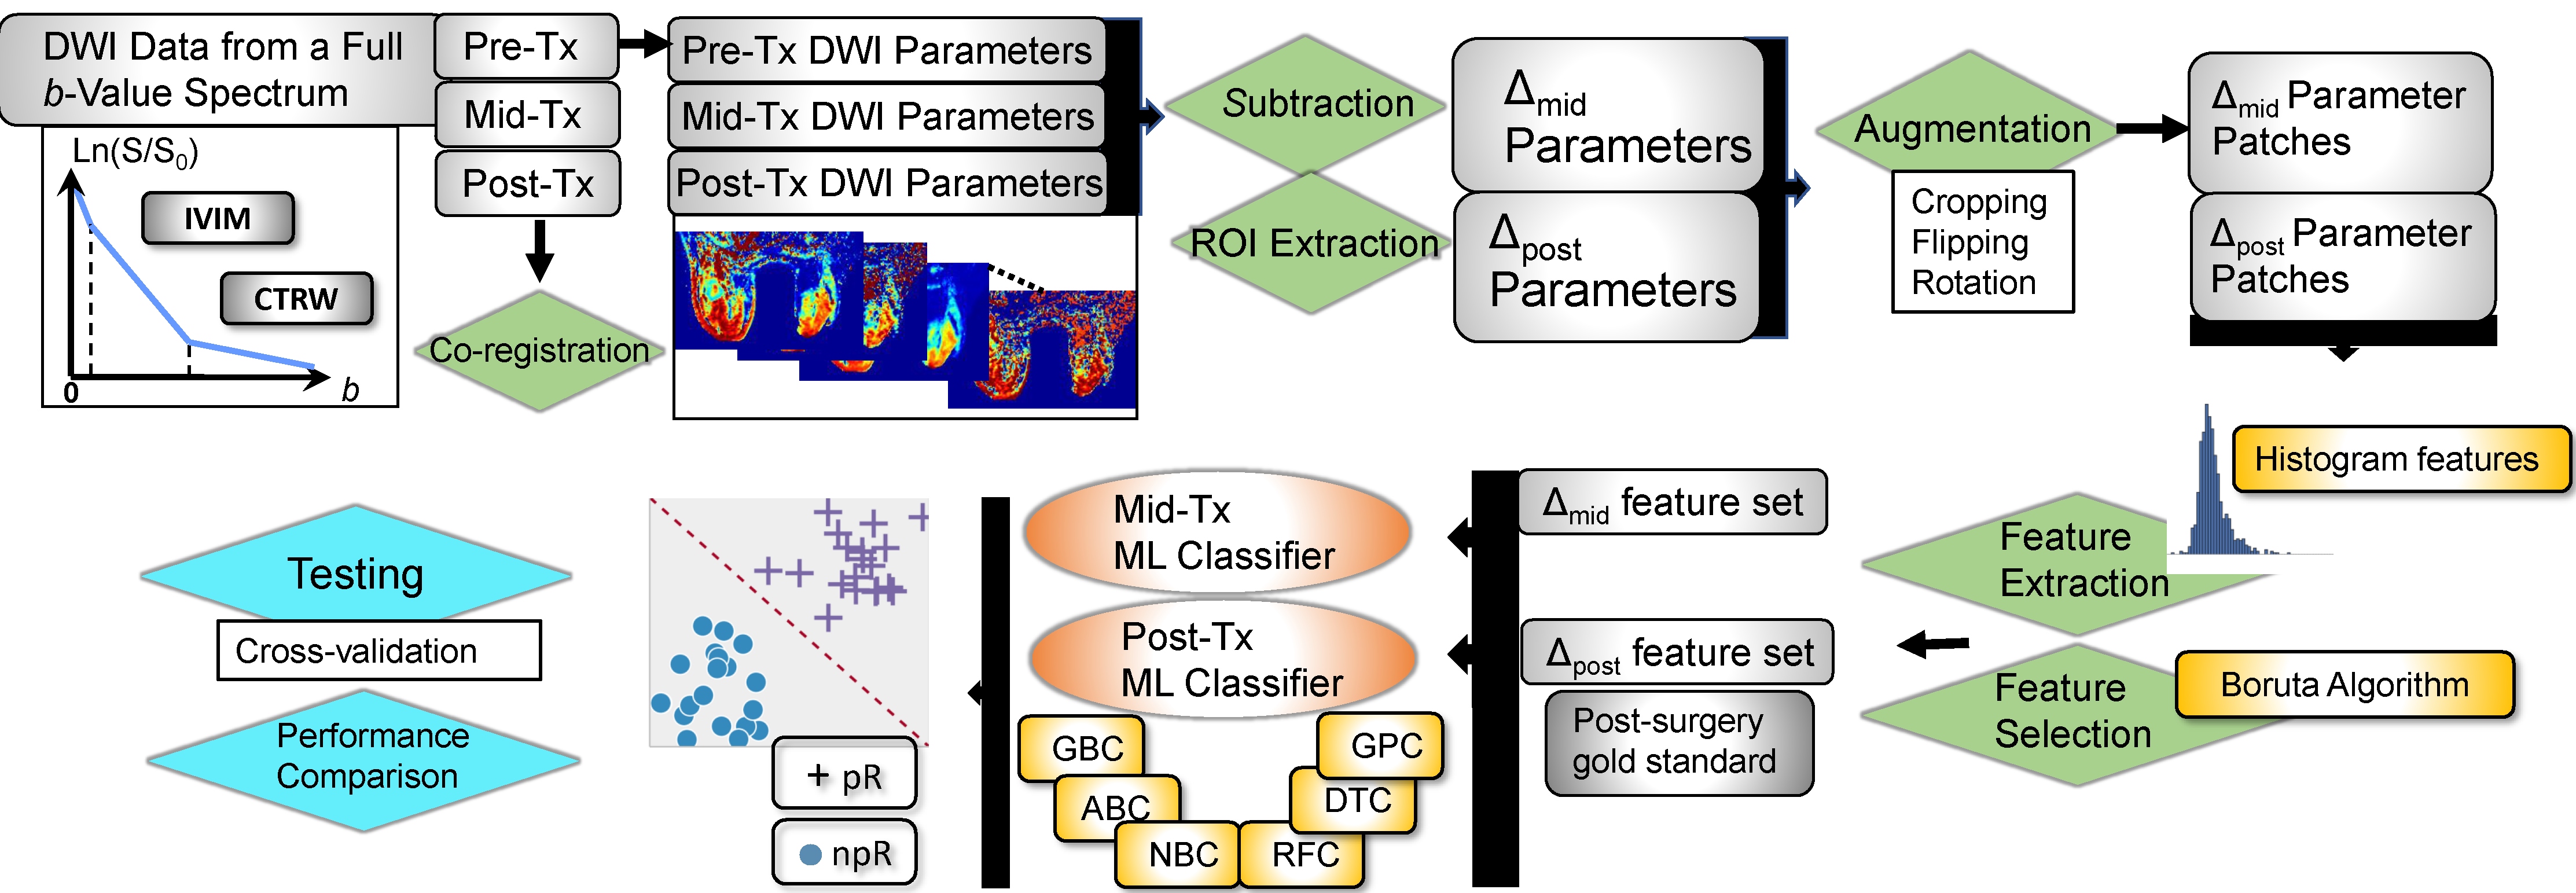
Pre-Processing: The tumor regions of interest (ROIs) were drawn on the pre-treatment images by a radiologist; and propagated to the parameter maps computed from the co-registered diffusion-weighted images. This was followed by obtaining relative difference maps at mid-Tx or post-Tx by Δmid/post P=(Pmid/post-Ppre)/Ppre for each DWI parameter, P. The ROIs were then randomly cropped, flipped, and rotated to prevent overfitting and increase the effective size of the dataset.
Feature Extraction and Selection: Nine histogram features were generated from each ROIs: kurtosis, skewness, variance, mean, median, interquartile range, 10% quantile, first, and third quartiles, resulting in 54 features. A recursive feature selection was performed by using a Boruta algorithm with a modified two-stage multiple testing methodology process using Benjamin Hochberg FDR and Bonferroni correction.
Machine-learning-based Classification: The predictive performance of the mid-Tx features from multi-modal DWI was evaluated by training a machine-learning classifier using the postsurgical histopathology as a gold standard. The same procedure was repeated by using the post-Tx features. Gradient boosting (GB), adaBoost (AB), naïve Bayes (NB), random forest (RF), decision tree (DT), and Gaussian process (GP) algorithms were employed for comparison by splitting the training and test sets to a ratio of 80/20. After performing a preliminary comparison between the classifiers, the best performer classifier was fine-tuned using grid search with a stratified cross-validation of 10 repeated 5-folds. The workflow of the data analysis is shown in Figure 1.
Results:
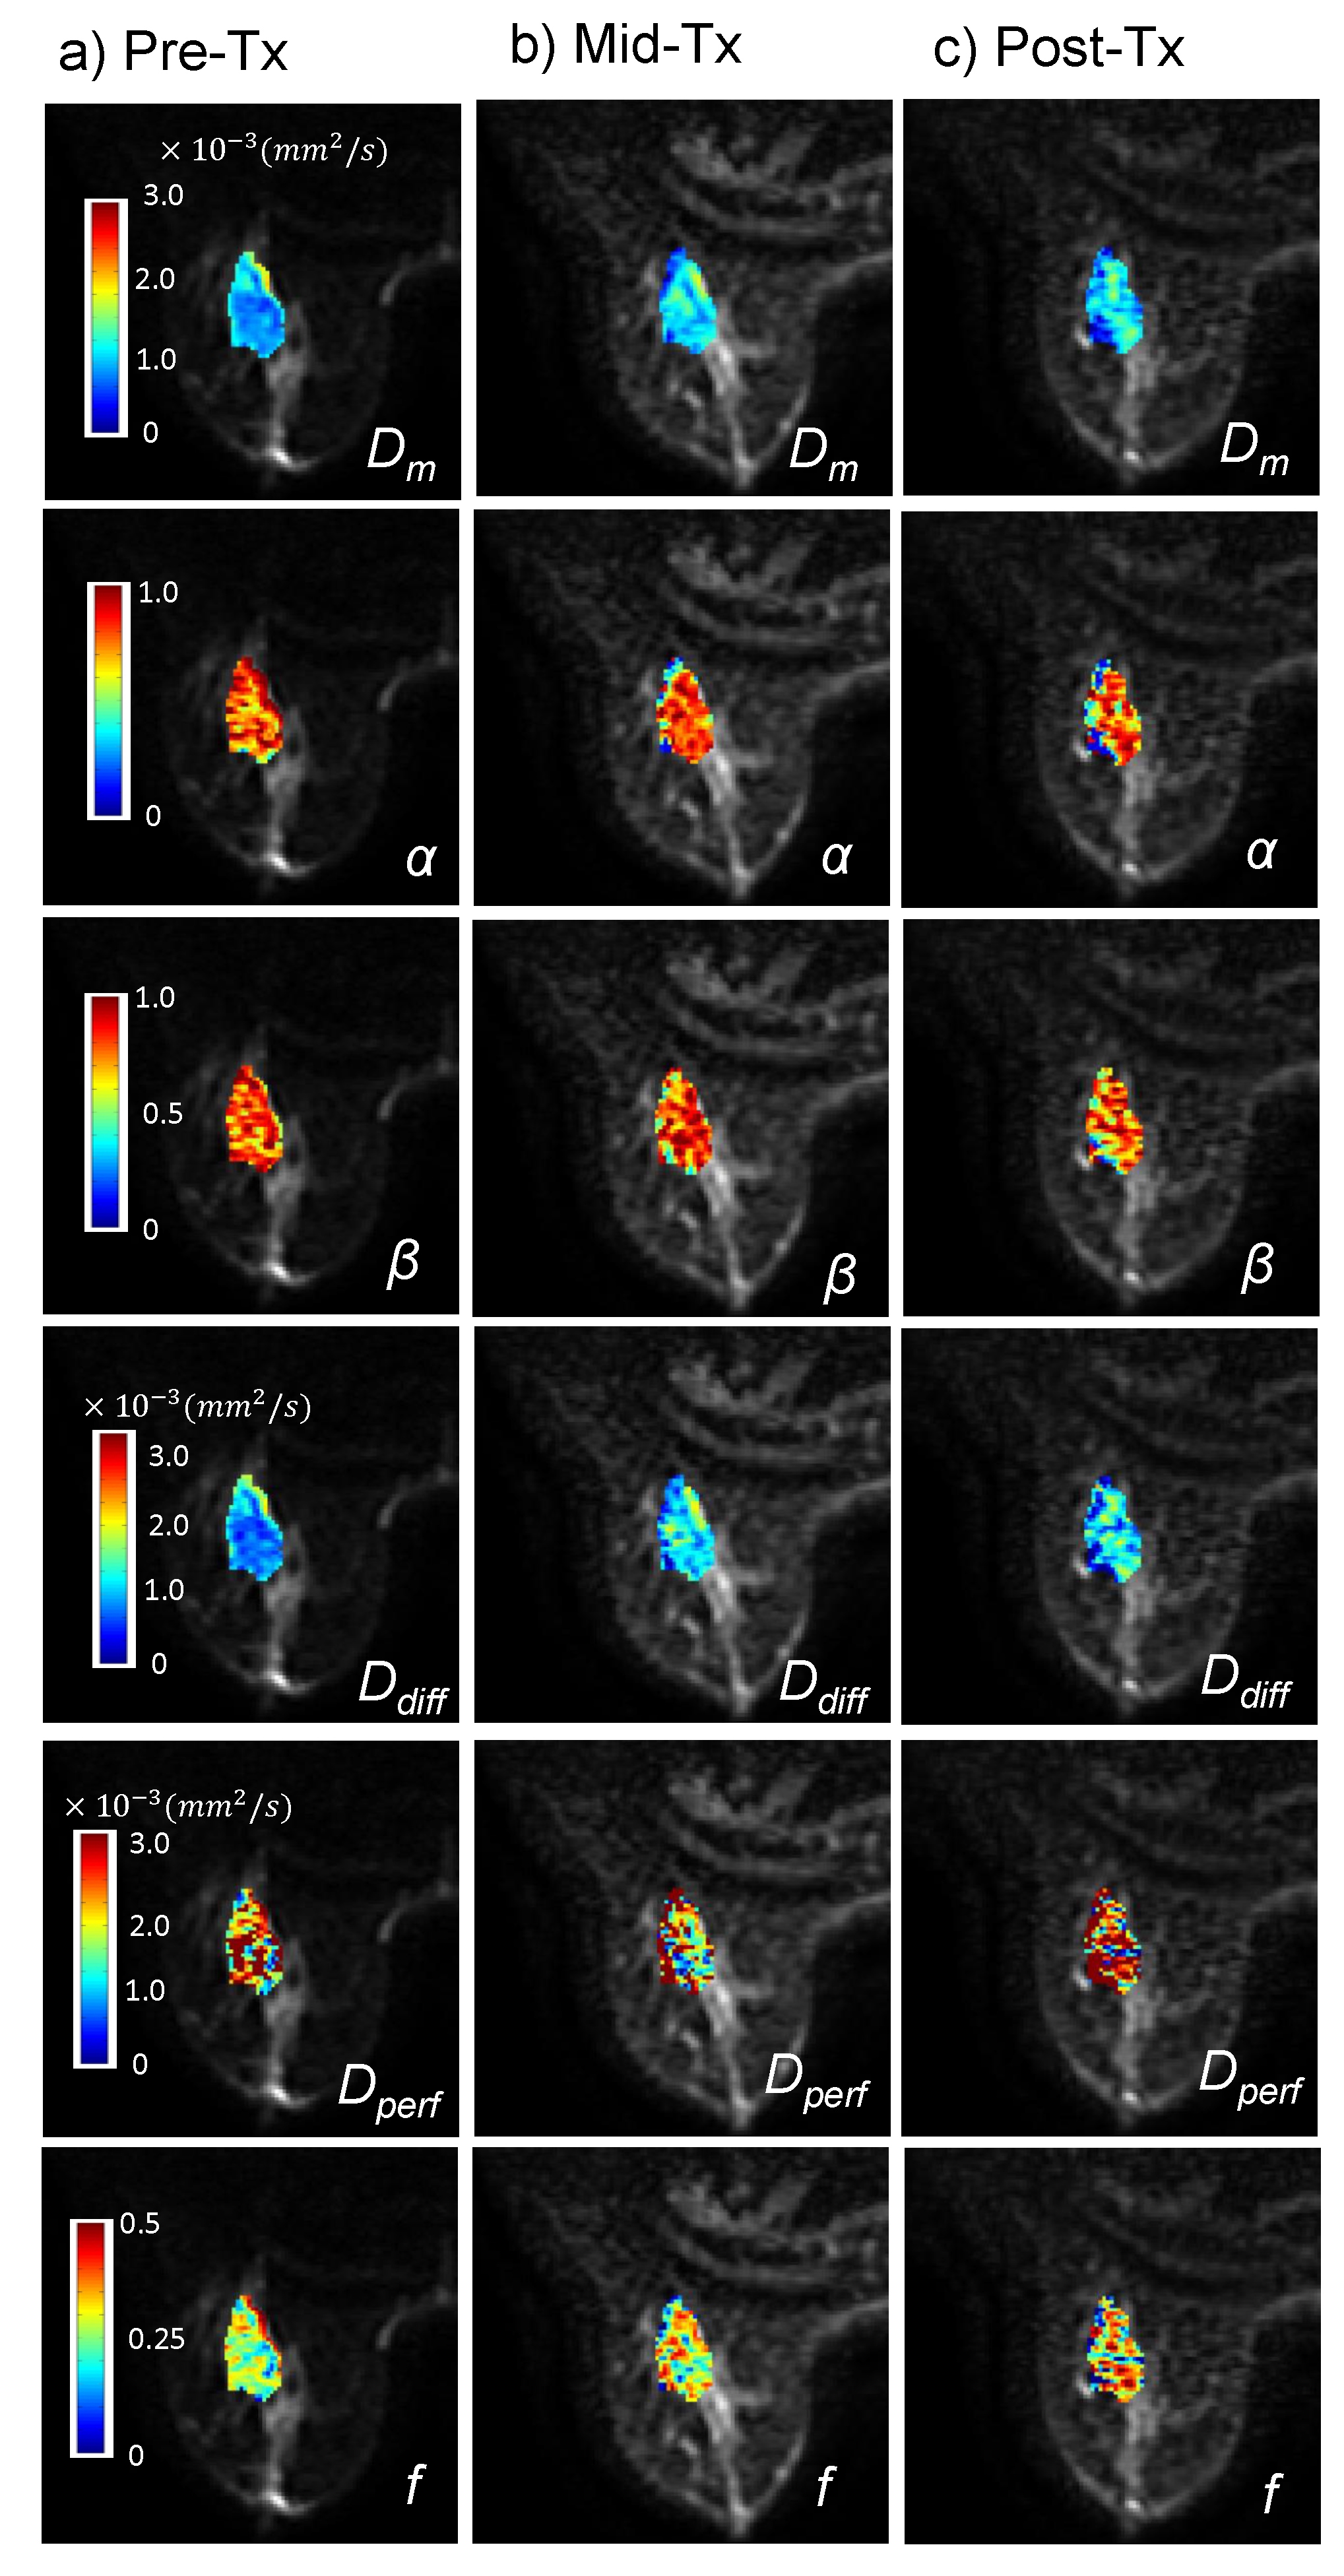
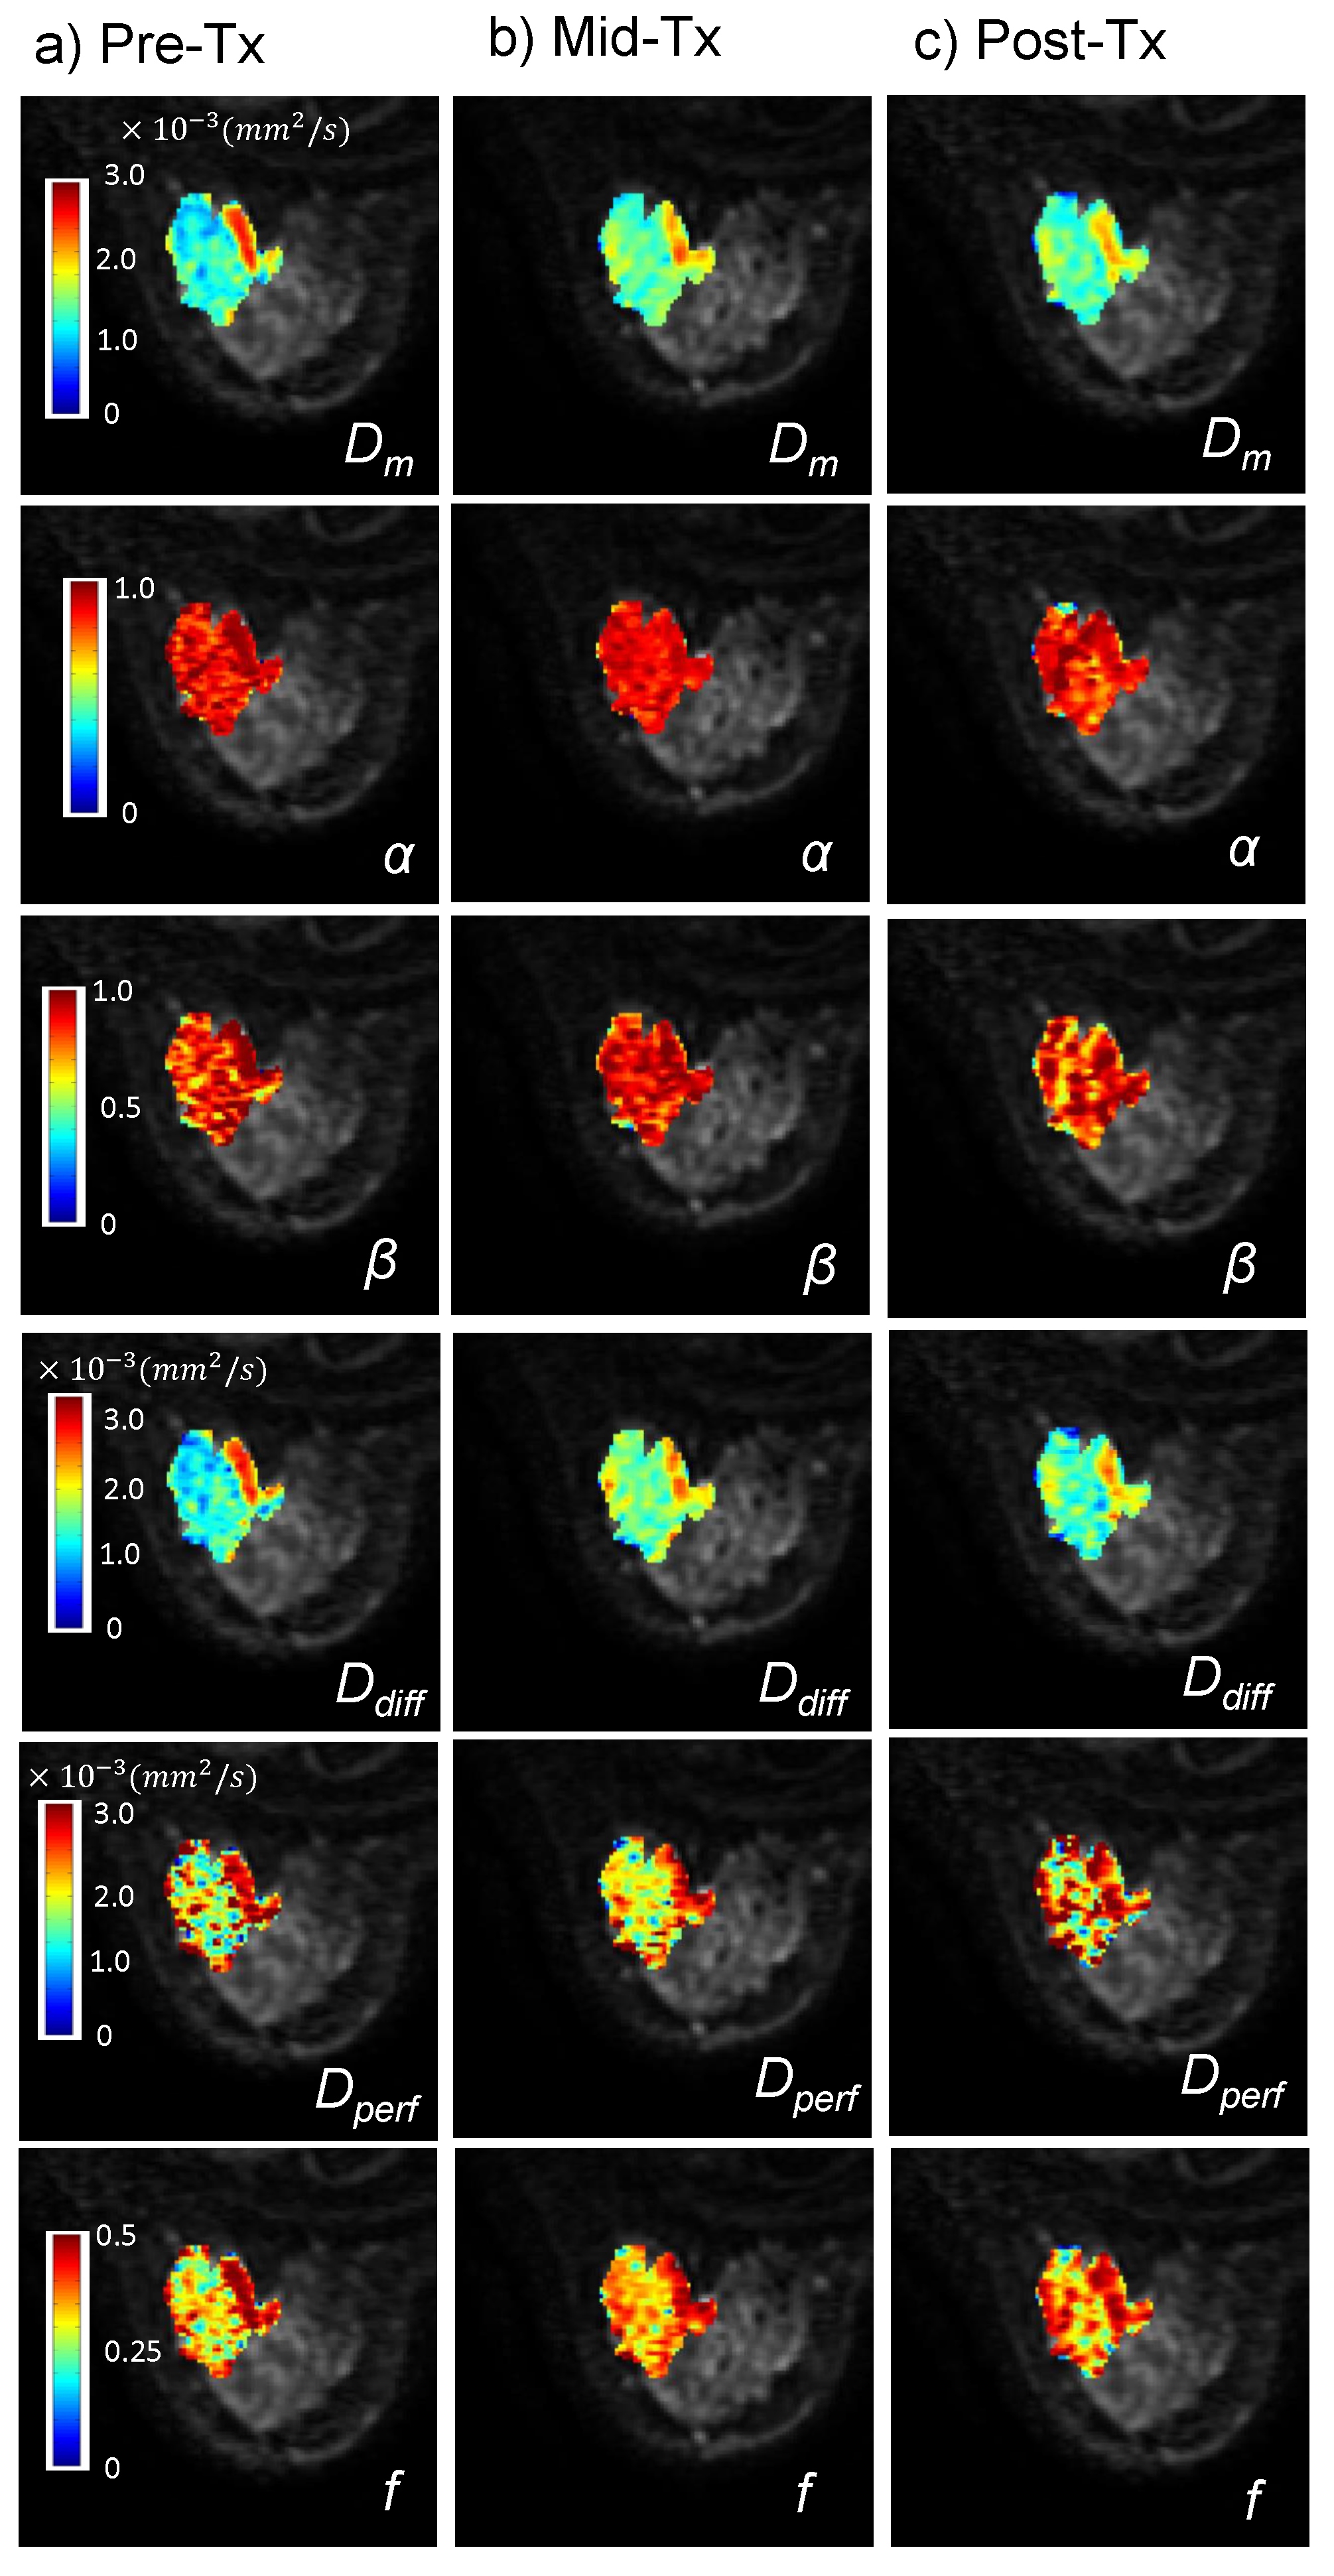
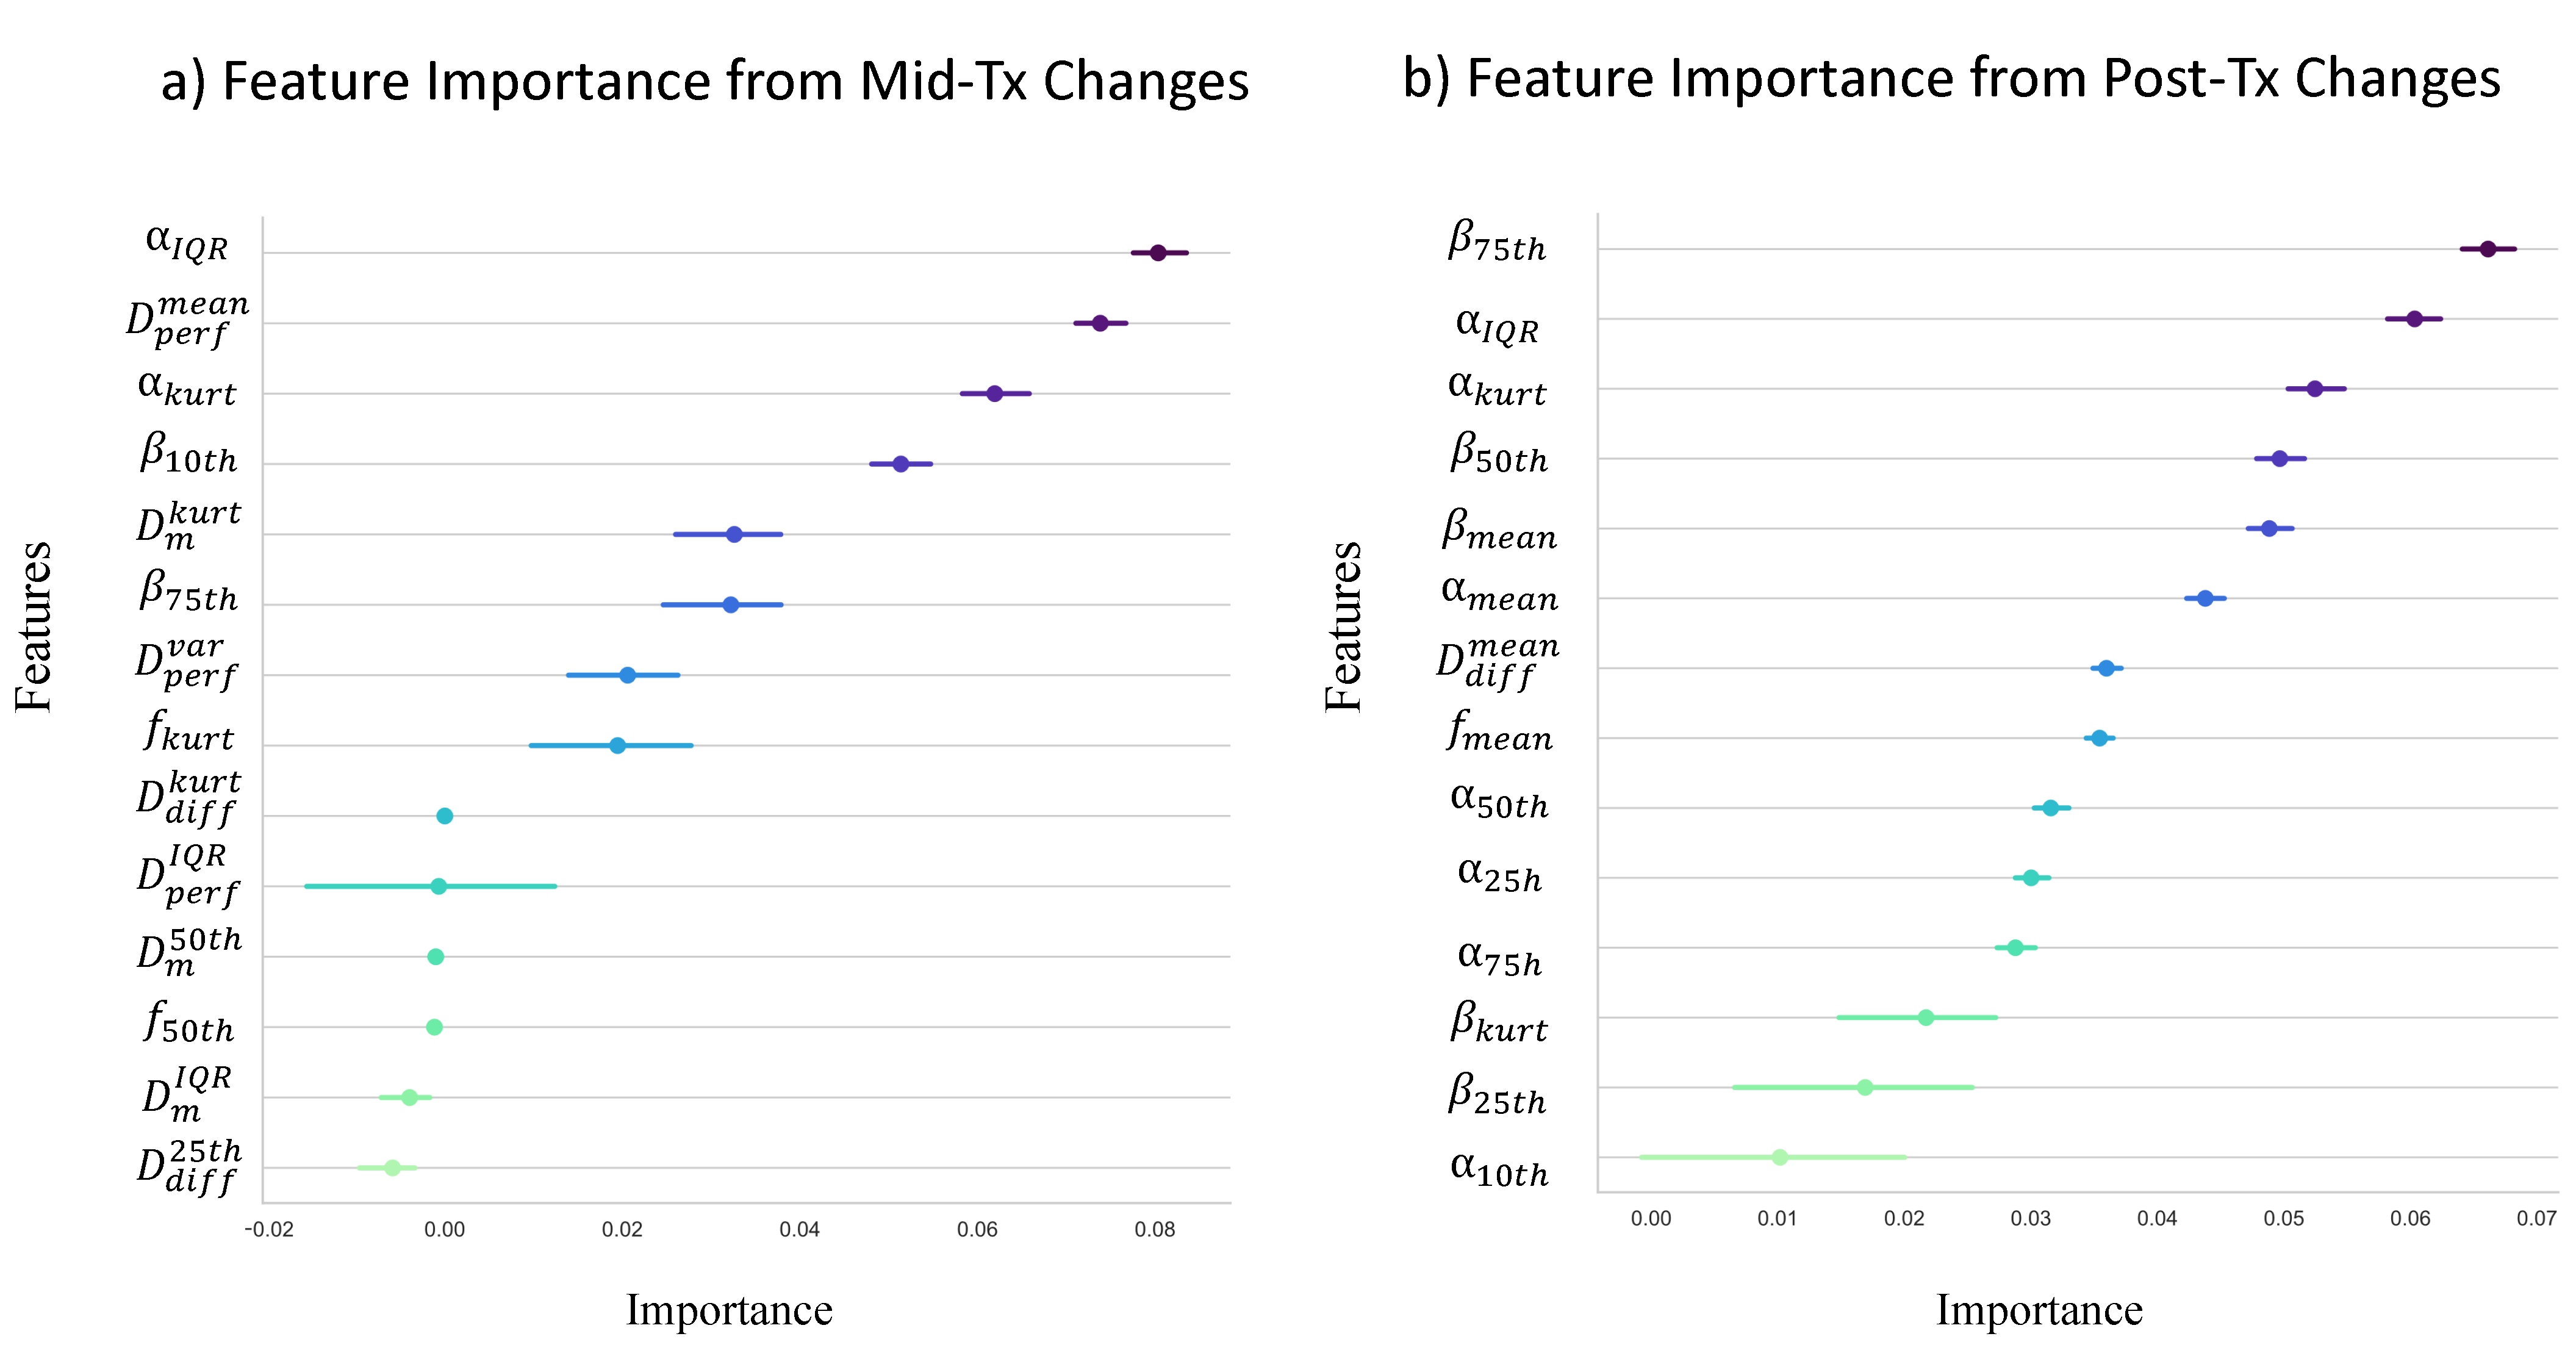
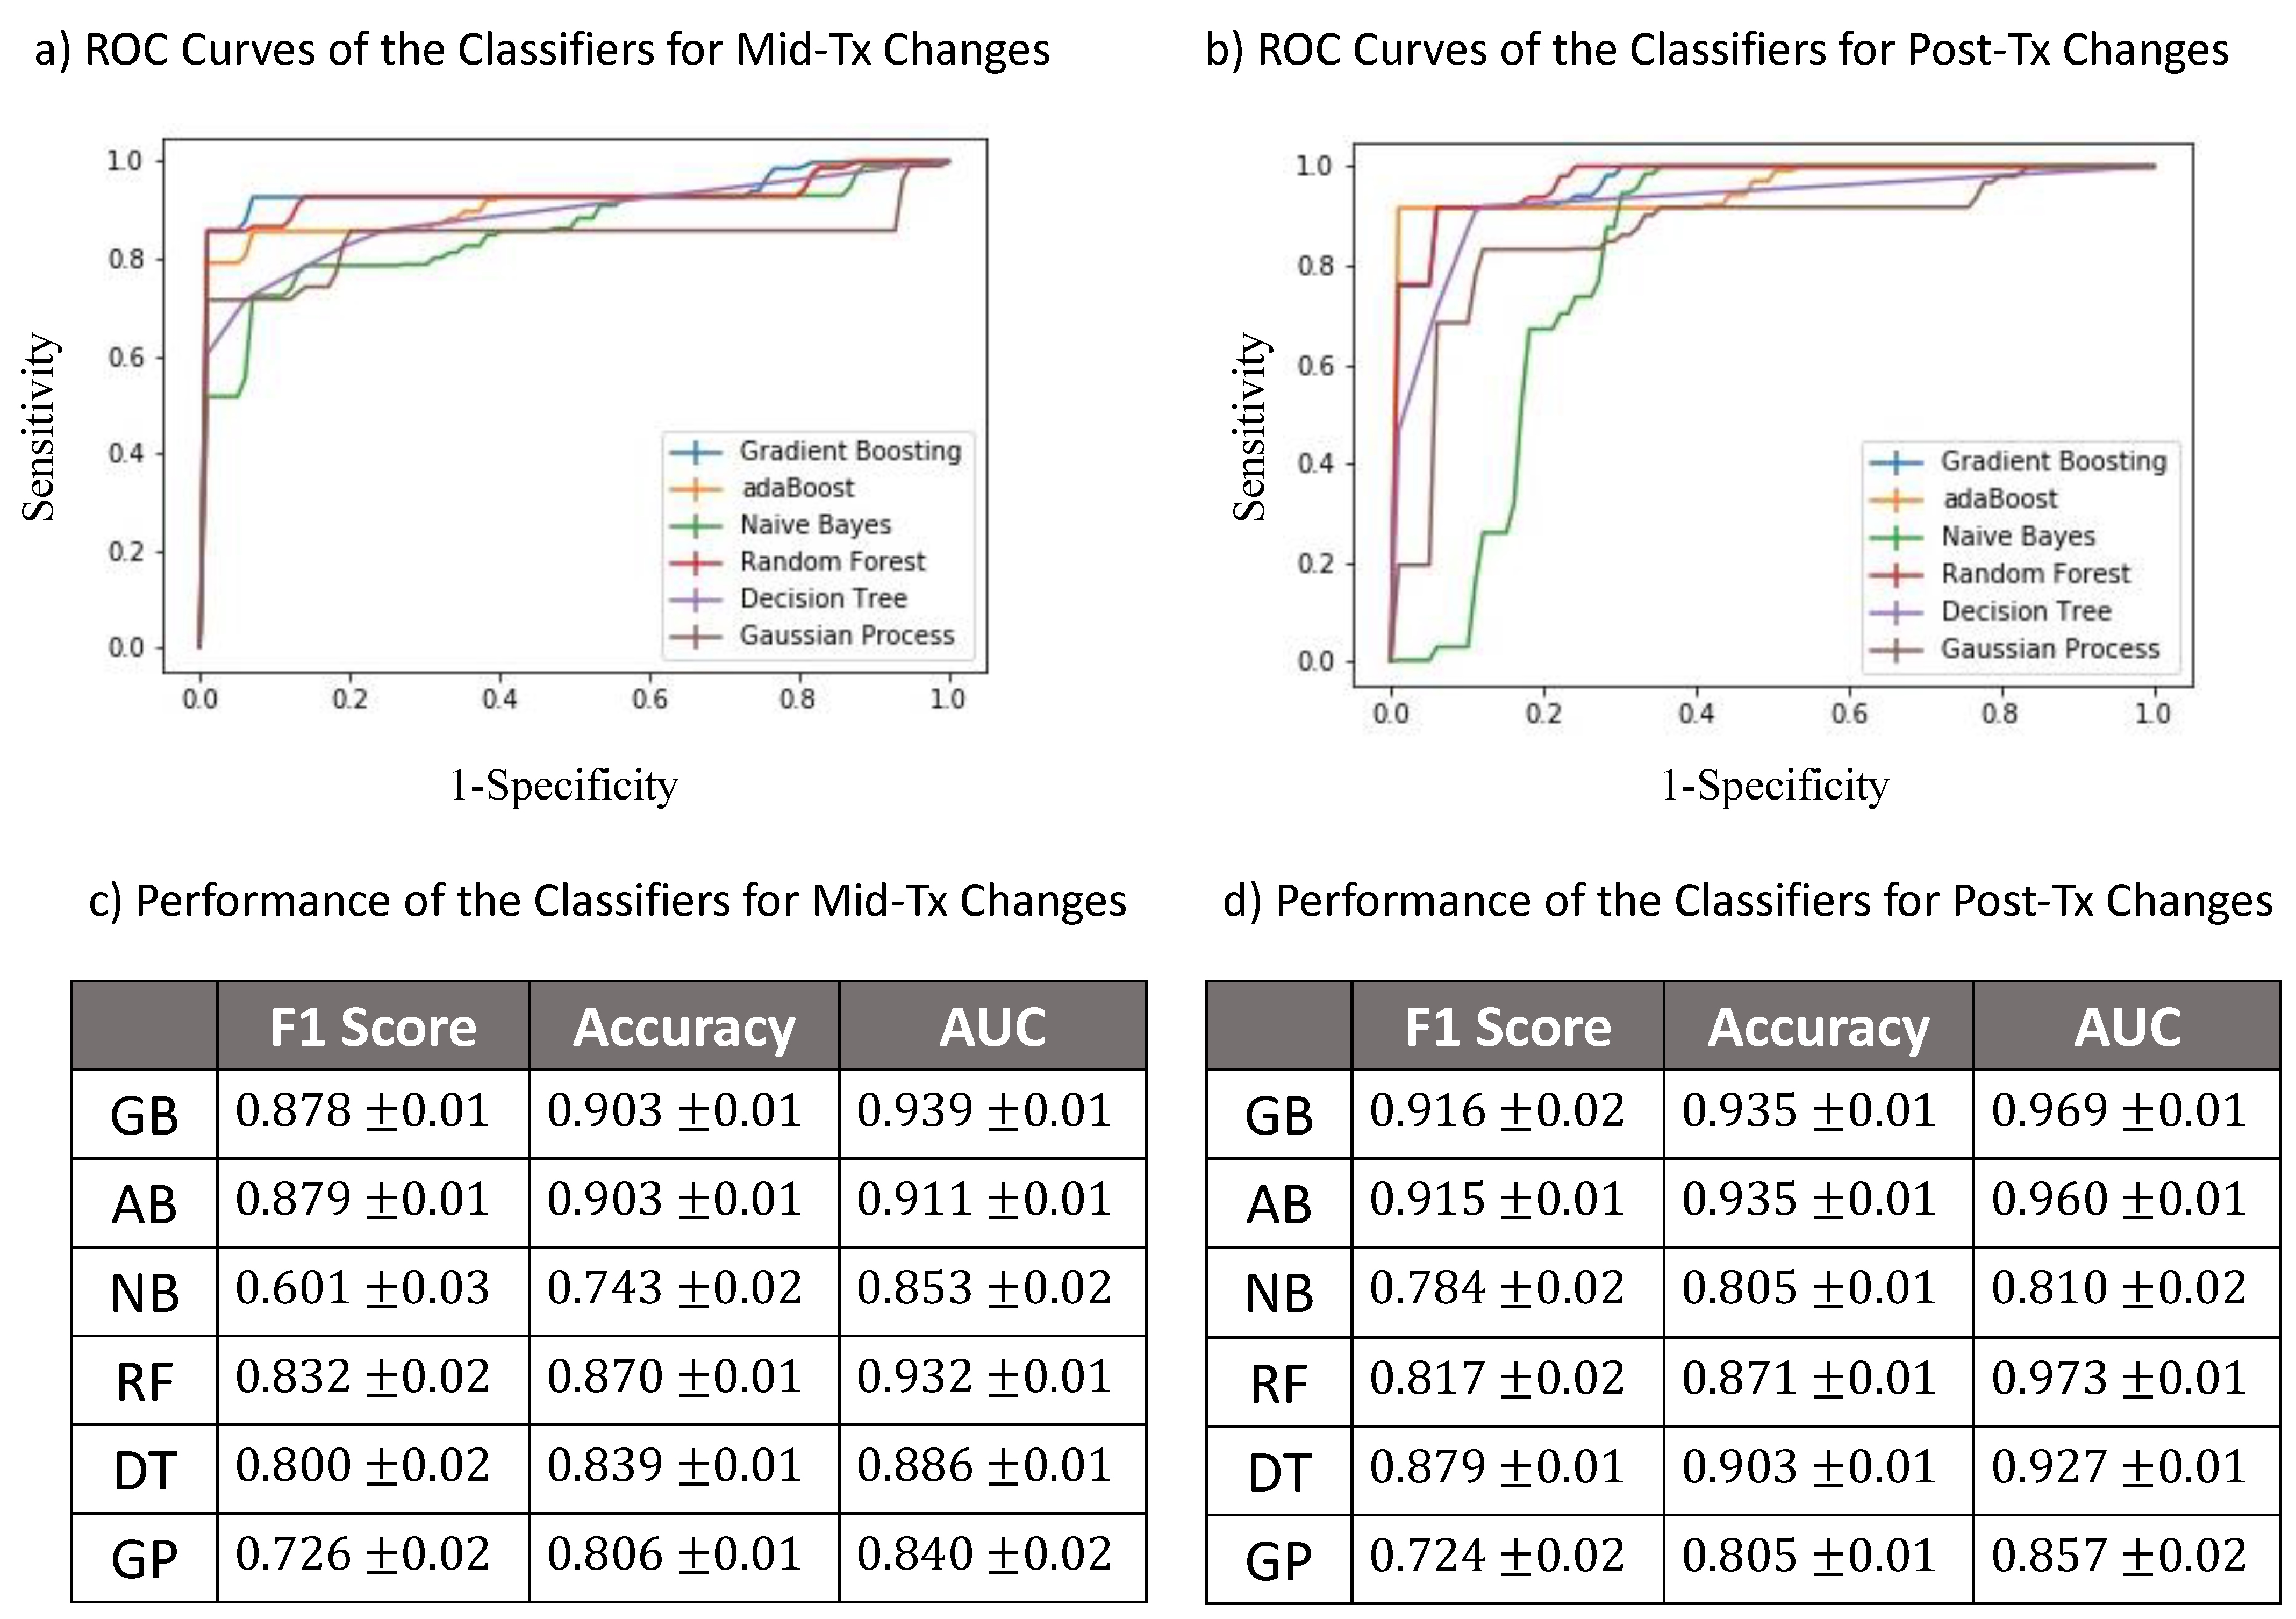
Figs.2a-2c show Dm, α, β, Ddiff, Dperf, and f maps of a representative patient from the pR group at pre-Tx, mid-Tx, and post-Tx while the results from a representative patient in the npR group are shown in Fig.3. The parameters, Dm, α, Ddiff, and f exhibited greater changes in the pR patient than the npR patient starting from the mid-Tx. The features extracted from the CTRW and IVIM parameters collectively contributed to the “top performing features” to predict treatment response using mid-Tx (Fig.4a) or post-Tx changes (Fig.4b). The GB classifier provided the best prediction performance with a mean area-under-the-curve of 0.939 and 0.969, accuracy of 0.903 and 0.935, and F1 score of 0.878 and 0.916 for both the mid-Tx (Fig.5a,5c) and post-Tx changes (Fig.5b,5d), respectively.Discussion and Conclusion:
We have demonstrated the prognostic value of multi-modal DWI in early prediction of tumor response to treatment in breast cancer. This study suggests that a machine-learning-based approach, using multiple features from a combination of DWI models, can comprehensively probe various tumor tissue changes during NAC. Our results showed that the parametric changes at mid-Tx can predict breast cancer’s response to NAC with an accuracy that is 96% of the accuracy achieved by using post-Tx changes. This encouraging predictive power demonstrates the potential of multi-modal DWI for monitoring NAC for improved breast cancer management.Acknowledgements
No acknowledgement found.References
[1] Charfare H, Limongelli S, Purushotham AD. Neoadjuvant chemotherapy in breast cancer. Br J Surg. 2005; 92(1):14-23.
[2] Pickles MD, Gibbs P, Lowry M, et al. Diffusion changes precede size reduction in neoadjuvant treatment of breast cancer. Magn Reson Imaging. 2006;24(7):843-847.
[3] Partridge SC, Nissan N, Rahbar H, et al. Diffusion-weighted breast MRI: Clinical applications and emerging techniques. J Magn Reson Imaging. 2017;45(2):337-355.
[4] Li X, Abramson RG, Arlinghaus LR, et al. Multiparametric magnetic resonance imaging for predicting pathological response after the first cycle of neoadjuvant chemotherapy in breast cancer. Invest Radiol. 2015;50(4):195-204.
[5] Nilsen L, Fangberget A, Geier O, et al. Diffusion-weighted magnetic resonance imaging for pretreatment prediction and monitoring of treatment response of patients with locally advanced breast cancer undergoing neoadjuvant chemotherapy. Acta Oncol. 2010;49(3):354-360.
[6] Tang L, Zhou XJ. Diffusion MRI of cancer: From low to high b-values. J Magn Reson Imaging. 2019;49(1):23-40.
[7] Le Bihan D, Breton E, Lallemand D, et al. MR imaging of intravoxel incoherent motions: application to diffusion and perfusion in neurologic disorders. Radiology. 1986;161(2):401-407.
[8] Karaman MM, Sui Y, Wang H, et al. Differentiating low- and high-grade pediatric brain tumors using a continuous-time random-walk diffusion model at high b-values. Magn Reson Med. 2016;76(4):1149-1157.
[9] Zhang J, Weaver TE, Zhong Z, et al. White matter structural differences in OSA patients experiencing residual daytime sleepiness with high CPAP use: a non-Gaussian diffusion MRI study. Sleep Med. 2019;53:51-59.
[10] Zhong Z, Merkitch D, Karaman M, et al. High-Spatial-Resolution Diffusion MRI in Parkinson Disease: Lateral Asymmetry of the Substantia Nigra. Radiology. 2019;291(1):149-157.
[11] Thirion JP. Image matching as a diffusion process: an analogy with maxwell's demons. Med Image Anal. 1998; 2(3):243-260.
[12] Kroon DJ and Slump CH. MRI modality transformation in demon registration. IEEE International Symposium on Biomedical Imaging: From Nano to Macro, 2009; 1-2:963-966.
[13] Dan G, Karaman M, Che S, et al. Co-registration of breast diffusion MR images across multiple time points in a longitudinal study to evaluate the response to neoadjuvant chemotherapy. In: International Society for Magnetic Resonance in Medicine 27th Scientific Meeting, 0280; 2019.
Figures