0571
Quantitative Evaluation of Tumor-related Vessels on Ultrafast Dynamic Contrast-enhanced MRI: Image Biomarker of Breast Cancer Proliferation1Faculty of Medicine, Kyoto University, Kyoto, Japan, 2Department of Diagnostic Imaging and Nuclear Medicine,, Kyoto University Graduate School of Medicine, Kyoto, Japan, 3Osaka Institute of Technology, Osaka, Japan, 4Siemens Healthcare GmbH, Erlangen, Germany, 5Department of Diagnostic Pathology, Kyoto University Graduate School of Medicine, Kyoto, Japan, 6Department of Breast Surgery, Kyoto University, Kyoto, Japan
Synopsis
For quantitative evaluation of tumor-related vessels, convolution filter processing was applied to ultrafast dynamic contrast-enhanced (UF-DCE) MRI of 51 lesions to obtain vessel length and crossing count as quantitative markers. The current analysis showed that these imaging markers were associated with a subtype of invasive breast cancer, the Ki-67 index, among invasive breast cancers. This opens a new approach to the evaluation of tumor-related vessels and tumor microenvironment.
Introduction
Tumor-related vessels in dynamic contrast-enhanced (DCE) MRI are known to be associated with ipsilateral malignant breast tumors and considered to reflect neovascularization [1,2]. Image-derived information of these tumor-related vessels can be a biomarker of tumor growth. However, most of such trials depend on visual evaluation, and only a few studies have employed a quantitative approach [2]. Ultrafast dynamic contrast-enhanced (UF-DCE)-MRI of the breast enables clear visualization of the feeding artery and drainage veins of the breast tumor [3]. Image processing may help to quantify smaller tumor-related abnormal vessels. In this study we aimed to1) Evaluate the effect of convolution filtering tailored for 3D-voxels, on tumor-related vessels.
2) Obtain the quantitative value of the vessel features including vessel length and complexity through skeletonization and crossing counting, and
3) Investigate the potential of these values in predicting a pathological diagnosis or proliferative biomarkers, including Ki-67 index, among breast cancers.
Methods
Our study population consisted of female patients suspected of breast cancer who underwent breast MRI with UF-DCE-MRI from December 2015 to March 2018. Those with poor image quality and without any enhancing lesion were excluded. A total of 51 lesions (46 malignant:5 benign) from 46 patients were analyzed. MR images were obtained with 3T MR units (MAGNETOM Prisma/Skyra, Siemens Healthcare, Erlangen, Germany). Gadobutrol/Gadoteridol was intravenously infused (2.0ml/sec). UF-DCE-MRI (15sec before 60sec after the contrast injection, 3.7sec×20frames) was followed by standard DCE-MRI. UF-DCE-MRI was acquired by a prototype based on the 3D gradient-echo VIBE sequence using a CS reconstruction (TR/TE 5.0/2.5ms, FA 15deg, FOV 360×360mm2, matrix 384×269, thickness 2.5mm, CS acceleration=16.5) with 30 iterations.In-house image analysis included pre-processing using convolution filtering with an additional maximum intensity projection (MIP). Convolution filtering, an established 2D image technology, was applied to the 3D voxels. In order to make the most of the 3D data, we developed an 3D-convolution filter that utilizes neighboring pixels not only in the given slice but also in the adjacent slices. An extended Gaussian filter (reducing noise) and repeated edge enhancement filters (detecting subtle structures) were used. Finally, a MIP was used to collapse the voxel into 2D. The frame just after the feeding arteries started to enhance was selected. The tumor and vessels were separately segmented by three readers, supervised by an experienced breast radiologist. A segmented image was trimmed to a 128x128-pixel square containing tumor-related vessels. Segmented vessels were skeletonized to minimize the effect of vessel thickness. The pixel count of skeletonized vessels was used to represent total vessel length. Then, crossing points of these skeletonized vessels were identified and counted as a marker of vessel network complexity (fig.1). These parameters (skeletonized vessel length, number of crossing points) and their association with pathology/Ki-67 index were analyzed. Invasive cancers were grouped into high (≥14) and low (<14) Ki-67 index groups. ROC analysis was performed to examine the performance of vessel length and number of crossing point in diagnosing cancer with high Ki-67 index.
Results
Impact of convolution filtering: Tumor-related vessels become more visible, with mean total vessel length increased from 179 to 269 pixels (Wilcoxon signed-rank test: p<0.001) after filtering. The mean number of crossing points also increased from 5.7 to 10.4 after filtering (p<0.001).Association with pathology and subtypes (fig.2): Among invasive breast cancers (n=37), non-luminal A type (n=19: luminal B, Triple negative, HER2+, and Luminal HER2+) showed significantly longer vessel length than luminal A type (n=18) before and after filtering (Wilcoxon rank-sum test: p<0.001 for both). The number of crossing points was significantly higher among non-luminal A type compared with those among luminal A type, which became more obvious after filtering (p=0.007 and p<0.001, respectively).
Association with Ki-67 index (fig.3): Vessel length was significantly longer among the high Ki-67 index group both before and after filtering (Wilcoxon rank-sum test: p<0.001). Crossing points were significantly increased among high Ki-67 index group, which became more obvious after filtering (p=0.003 and p<0.001, respectively).
In ROC analysis, AUC of vessel length and number of crossing points after filtering were 0.92/0.90 in predicting breast cancer with high Ki-67 index.
Discussion
The current study demonstrated the usefulness of convolution filtering to enhance detailed vascular structures, with significant increase in vessel length and crossing points. This preliminary comparison indicates that the enhanced detectability can be explained by the 3D convolution filter applied before the MIP, since any operation will fail to utilize the 3rd dimension once the images are collapsed into a MIP.The two quantitative markers were associated with invasive cancer subtypes and the Ki-67 index, a marker of proliferation. ROC analysis indicated that these markers can be used to identify high Ki-67 index cancers without the need of tissue sampling.
Tumor-related vessels are tortuous, saccular, chaotic, and leaky [4]. These vascular features reflect the tumor microenvironment. Our proposed image processing and quantification can be used to evaluate and monitor these abnormal tumor-related vessels noninvasively (see fig.4).
Limitations include retrospective design, small sample size, and manual segmentation of the vessels.
Conclusion
With the use of convolution filter technology, tumor-related vessels on UF-DCE MRI can be quantitatively evaluated by vessel length and the number of crossings. These markers are associated with tumor subtype and Ki-67 index.Acknowledgements
KAKENHI-JP15K09922References
1. Kul, S., et al., Contrast-enhanced MR angiography of the breast: Evaluation of ipsilateral increased vascularity and adjacent vessel sign in the characterization of breast lesions. AJR Am J Roentgenol, 2010. 195(5): p. 1250-4.
2. Wu, C., et al., Quantitative analysis of vascular properties derived from ultrafast DCE-MRI to discriminate malignant and benign breast tumors. Magn Reson Med, 2019. 81(3): p. 2147-2160.
3. Onishi, N., et al., Ultrafast dynamic contrast-enhanced mri of the breast using compressed sensing: breast cancer diagnosis based on separate visualization of breast arteries and veins. J Magn Reson Imaging, 2018. 47(1): p. 97-104.
4. Jain, R.K., Normalizing tumor microenvironment to treat cancer: bench to bedside to biomarkers. J Clin Oncol, 2013. 31(17): p. 2205-18.
Figures
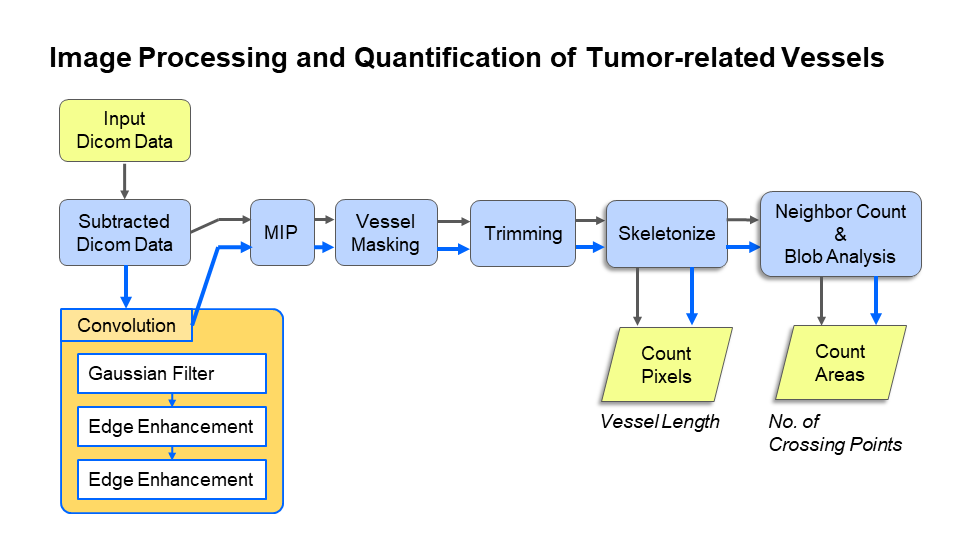
Fig.1 Image Processing and Quantification of Tumor-related Vessels The blue arrows indicate the processing of the images which underwent convolution filtering (left lower orange box).
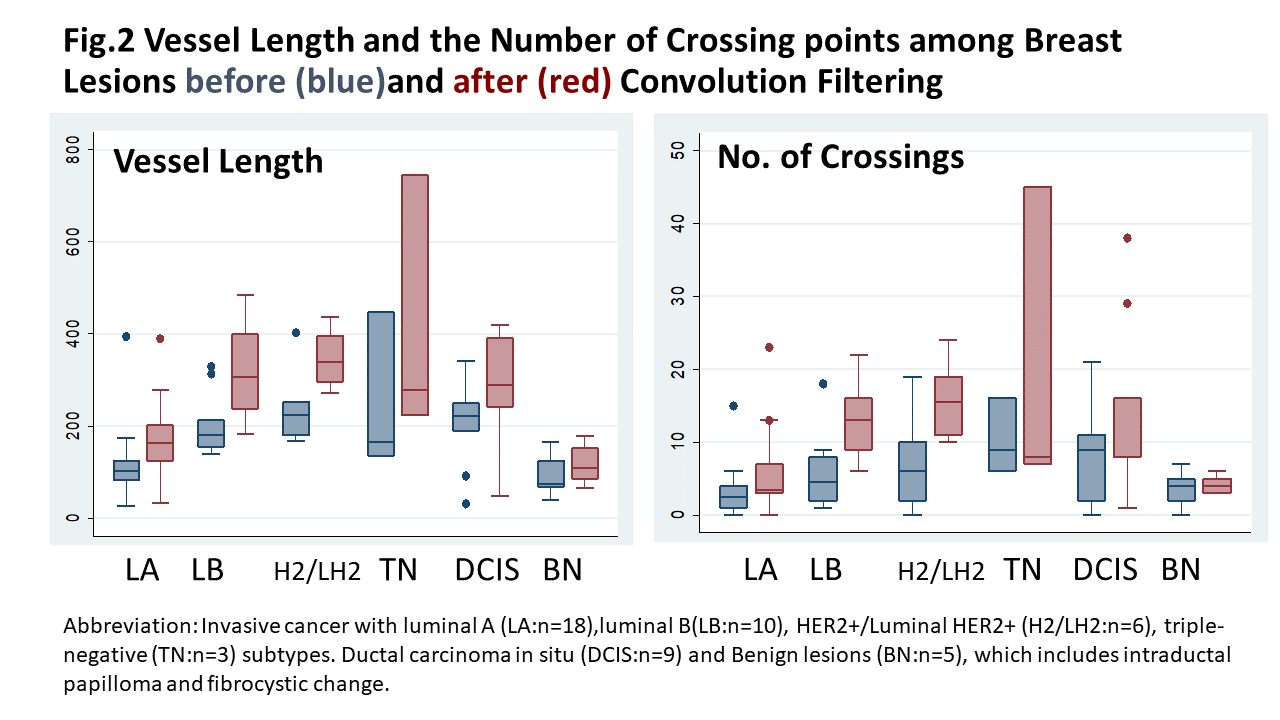
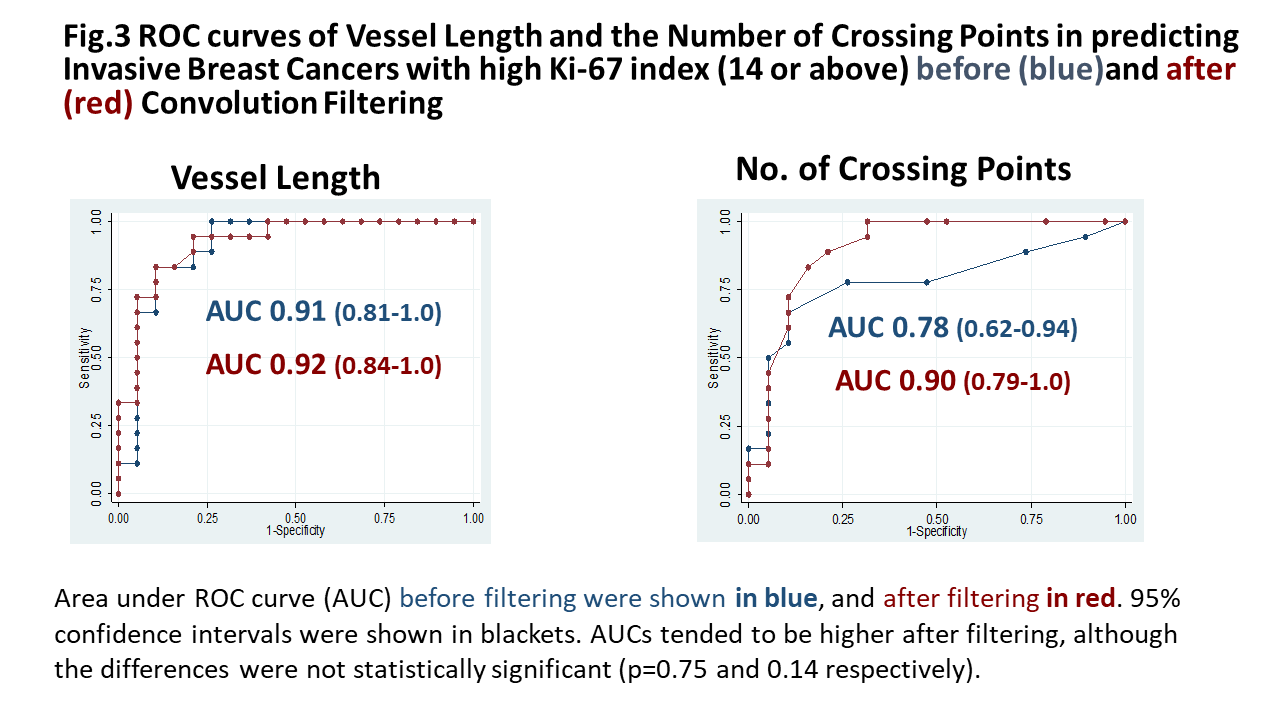
Fig.3 ROC curves of Vessel Length and the Number of Crossing Points in predicting Invasive Breast Cancers with high Ki-67 index (14 or above) before and after Convolution Filtering.
Area under ROC curve (AUC) before filtering were shown in blue, and after filtering in red. 95% confidence intervals were shown in blackets. AUCs tended to be higher after filtering, although the differences were not statistically significant (p=0.75 and 0.14 respectively). Maximum accuracy was obtained at the cut-off of 233 with sensitivity /specificity of 94 /79%.
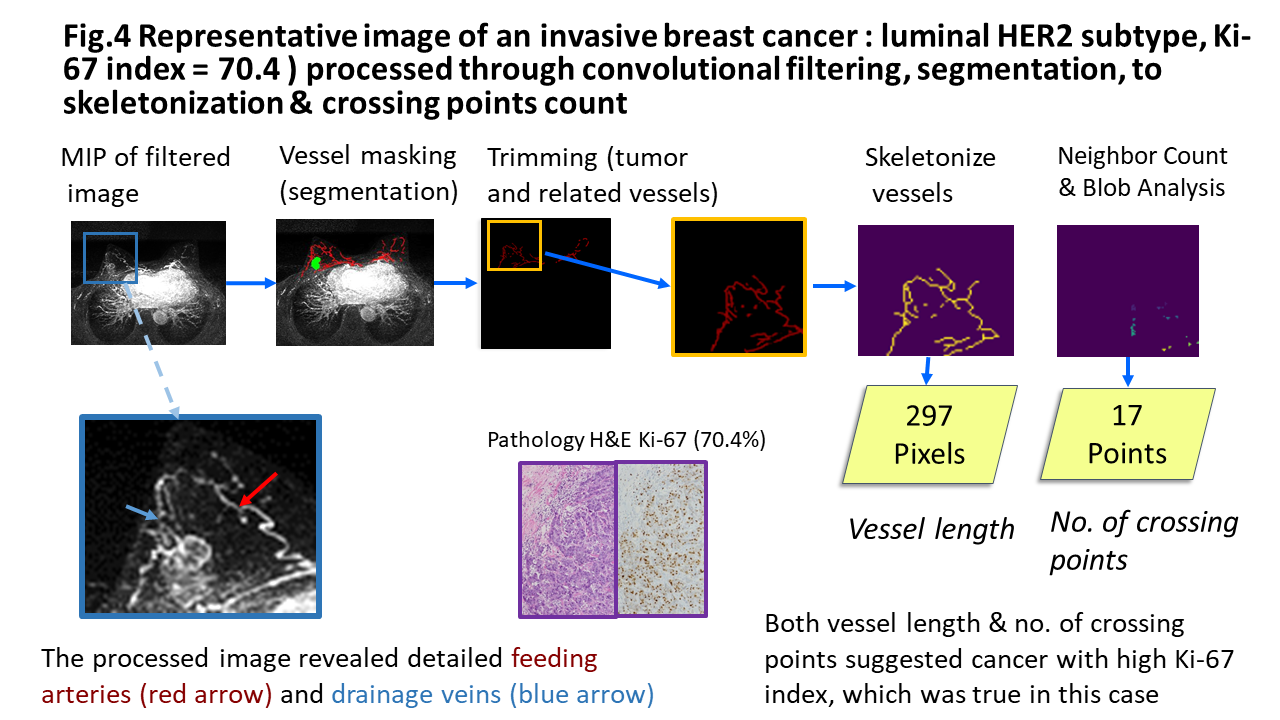
Fig.4 Representative image of an invasive breast cancer : luminal HER2, Ki-67 index = 70.4 ) processed through convolutional filtering, segmentation, to skeletonization & crossing points count.The upper row demonstrated the processing of the filtered MIP image, masked image (green;cancer, red;vessels) to the quantification. The lower row showed the magnified view of the filtered image with detailed tumor-related vessels and corresponding pathology of the tumor.Both vessel length & no. of crossing points suggested cancer with high Ki-67 index, which was true in this case.