0568
The Utility of Amide Proton Transfer-weighted Imaging and Diffusion Kurtosis Imaging in the Diagnosis of Benign and Malignant Breast Lesions1Department of Radiology, Zhengzhou University People’s Hospital & Henan Provincial People’s Hospital, Academy of Medical Sciences, Zhengzhou University, Zhengzhou, China, 2Department of MRI, the First Affiliated Hospital of Xinxiang Medical University, Weihui, China, 3Department of Pediatrics, Zhengzhou Central Hospital, Zhengzhou University, Zhengzhou, China, 4GE Healthcare, MR Research China, Beijing, China, 5Department of Radiology, Zhengzhou University People’s Hospital & Henan Provincial People’s Hospital, Zhengzhou, China
Synopsis
Amide proton transfer-weighted imaging (APTWI) has unique advantages in displaying the metabolism of diseased proteins. Diffusion kurtosis imaging (DKI) can quantify the diffusion state water molecules in tissues with a non-gaussian model, thus correcting the deviation of the DWI model and improving the detection of lesions. Our results show that compared with APTWI, the DKI is more effective in the diagnosis of benign and malignant breast tumors.
Introduction
Breast cancer is a life-threatening disease among women, with its age of onset becoming younger. Breast magnetic resonance imaging (MRI) has been increasingly used in diagnosing patients with suspicious breast lesions owing to its excellent soft-tissue contrast and noninvasive nature compared with other imaging modalities 1. Amide proton transfer-weighted imaging (APTWI) could be employed to detect the free protein and peptide content in living tissue without the use of exogenous magnetic resonance contrast agent 2. Diffusion kurtosis imaging (DKI) is based on the non-Gaussian diffusion model, which can better address the problem of restricted water diffusion within the complex microstructure of biological tissues 3. At present, several studies have explored the possibility of using APTWI 4 or DKI 5 alone for diagnosis of benign or malignant breast lesions, but there are few comparative studies on APTWI and DKI in breast lesions. This research aims to explore the possibility of using APTWI and DKI to identify and diagnose benign and malignant breast lesions, and to compare which technique has a better diagnostic effect.Materal and Methods
With pathological results as the gold standard, 92 patients were selected in this research, including 39 patients with benign breast lesions(20 fibroadenoma, 14 breast hyperplasia, and 5 mastitis lesions,) and 53 patients with malignant breast lesions (40 infiltrating ductal carcinomas, 8 ductal carcinomas in situ, 3 invasive papillary carcinomas, and 2 mucinous cancer). Studies were conducted on a 3.0 T MR scanner (Discovery MR750, GE Healthcare) with an 8 channel phased-array breast coil. The DKI sequence was set with the following parameters: TR, 2500 ms; TE, 79.3 ms; b-values, 0, 500, 1000, 1500, and 2000 s/mm2; and 30 uniformly distributed dispersion directions. After the DKI scan was completed, under the guidance of an experienced radiologist, all layers containing the tumor subject were scanned using the APTWI sequence layer by layer. The scanning parameters were as follows: TR, 3000 ms; TE, 12.0 ms; RF, 2.0 μT; saturation time, 500 ms (4 pulses were applied for saturation); frequency list, 5000, 5000, 5000, ±600, ±575, ±550, ±525, ±500, ±475, ±450, ±425, ±400, ±375, ±350, ±325, ±300, ±275, ±250, ±225, ±200, ±175, ±150, ±125, ±100, ±75, ±50, ±25 Hz. The ROI was placed to cover as many solid tumor parts as possible to avoid large vessels and hemorrhagic, calcified, cystic and necrotic areas.SPSS 23.0 and Medcalc 15.0 were used for data analysis. The independent sample t-test was applied for between-group analyses. The correlation between MTRasym (3.5ppm) and MK, MD were analyzed by using the Pearson correlation coefficient. The ROC curve was generated to evaluate each parameter’s diagnostic accuracy and threshold. The Delong method was used to compare the AUCs of different parameters. P<0.05 is considered statistically significant.Results
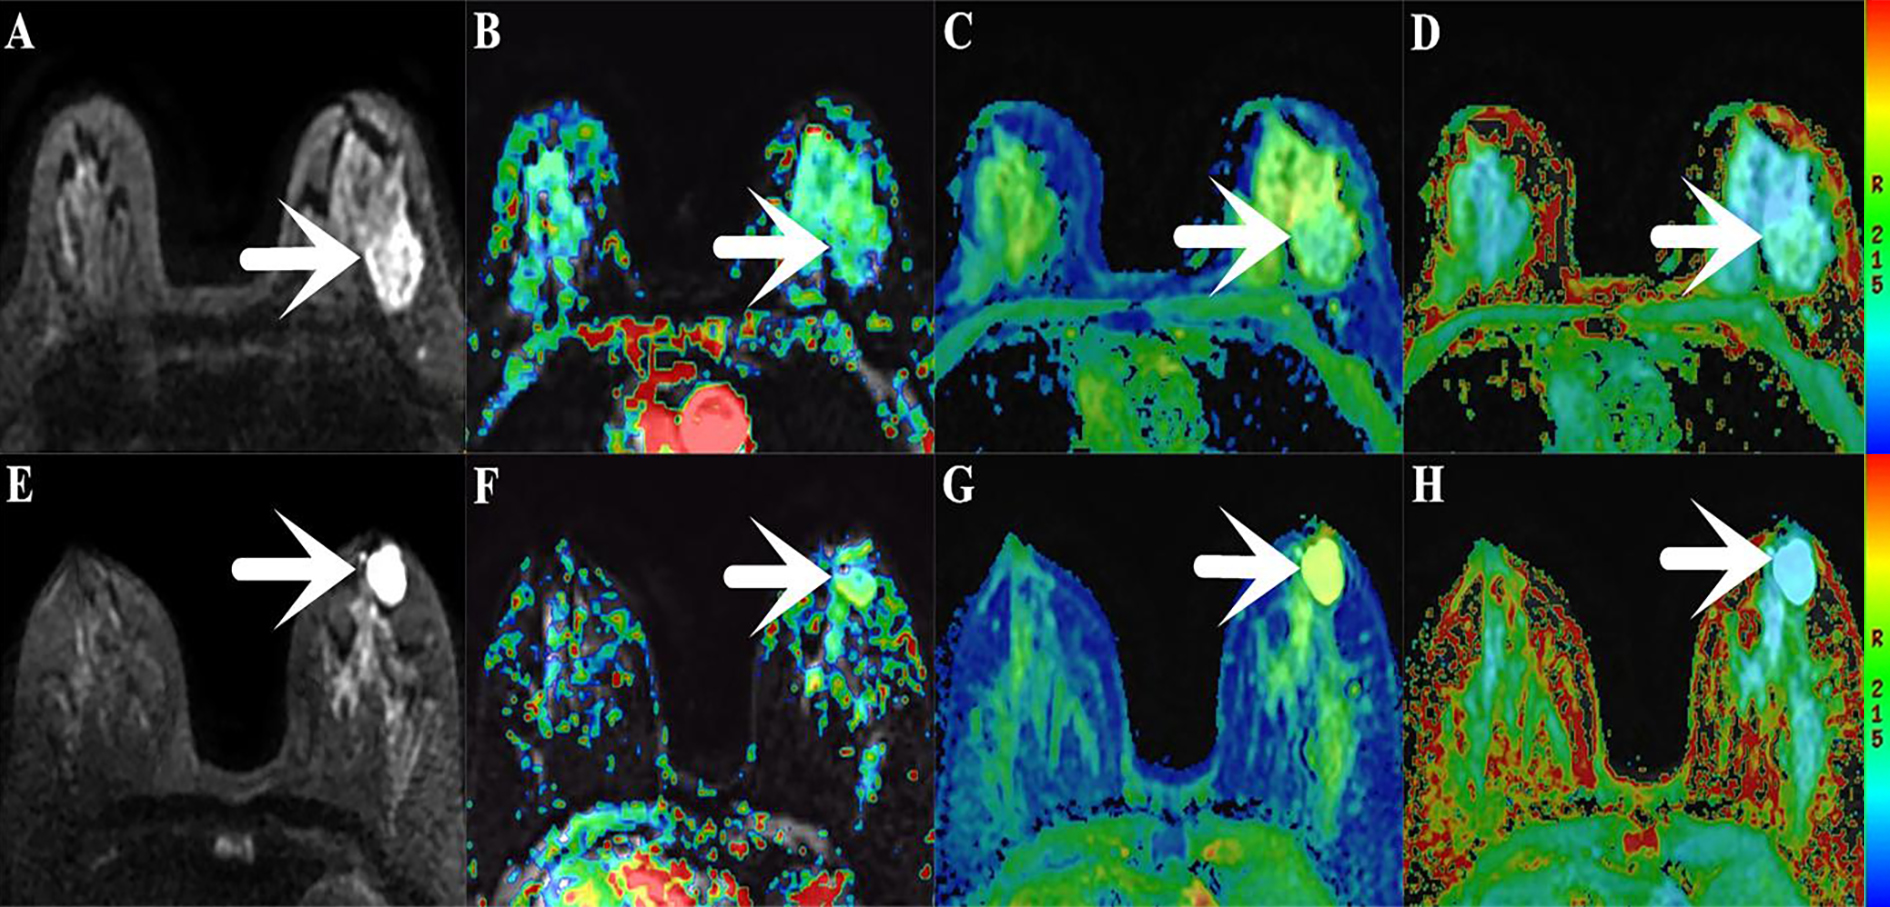
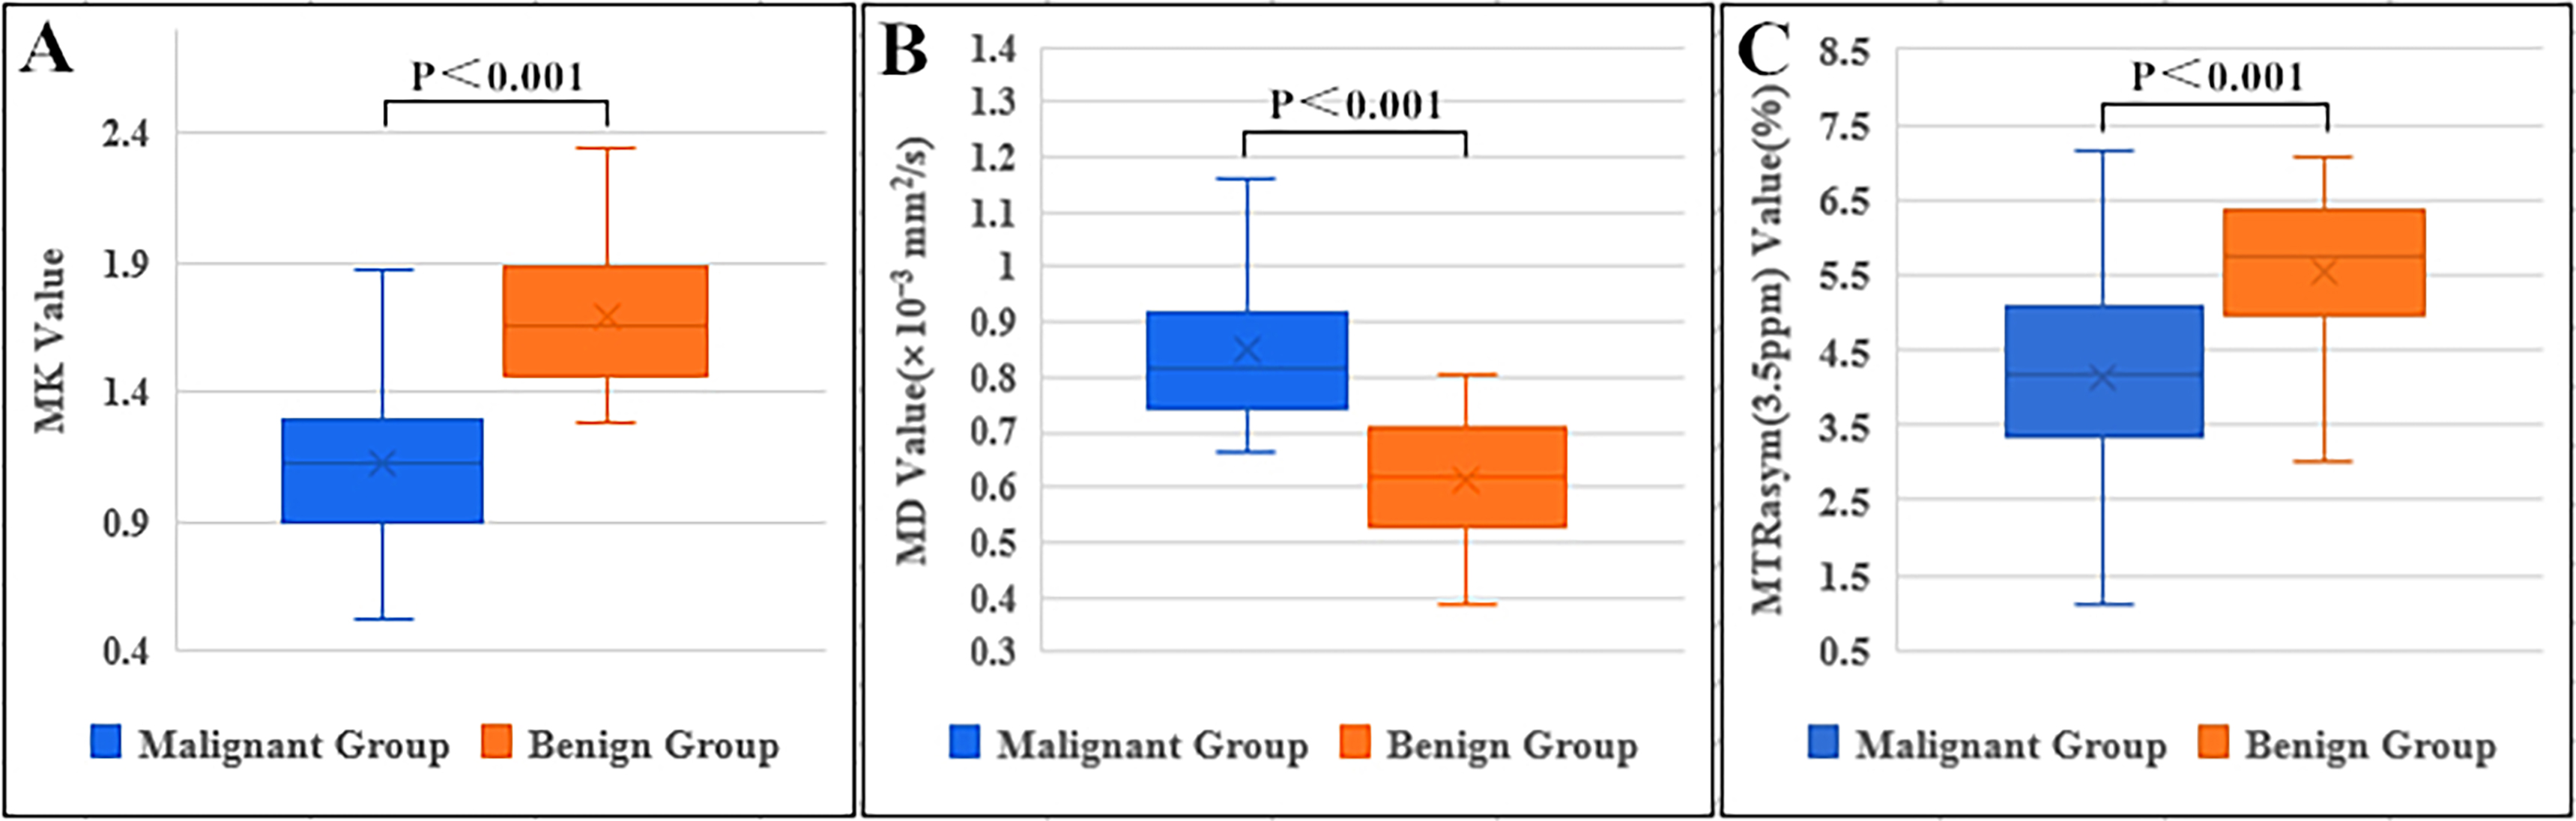
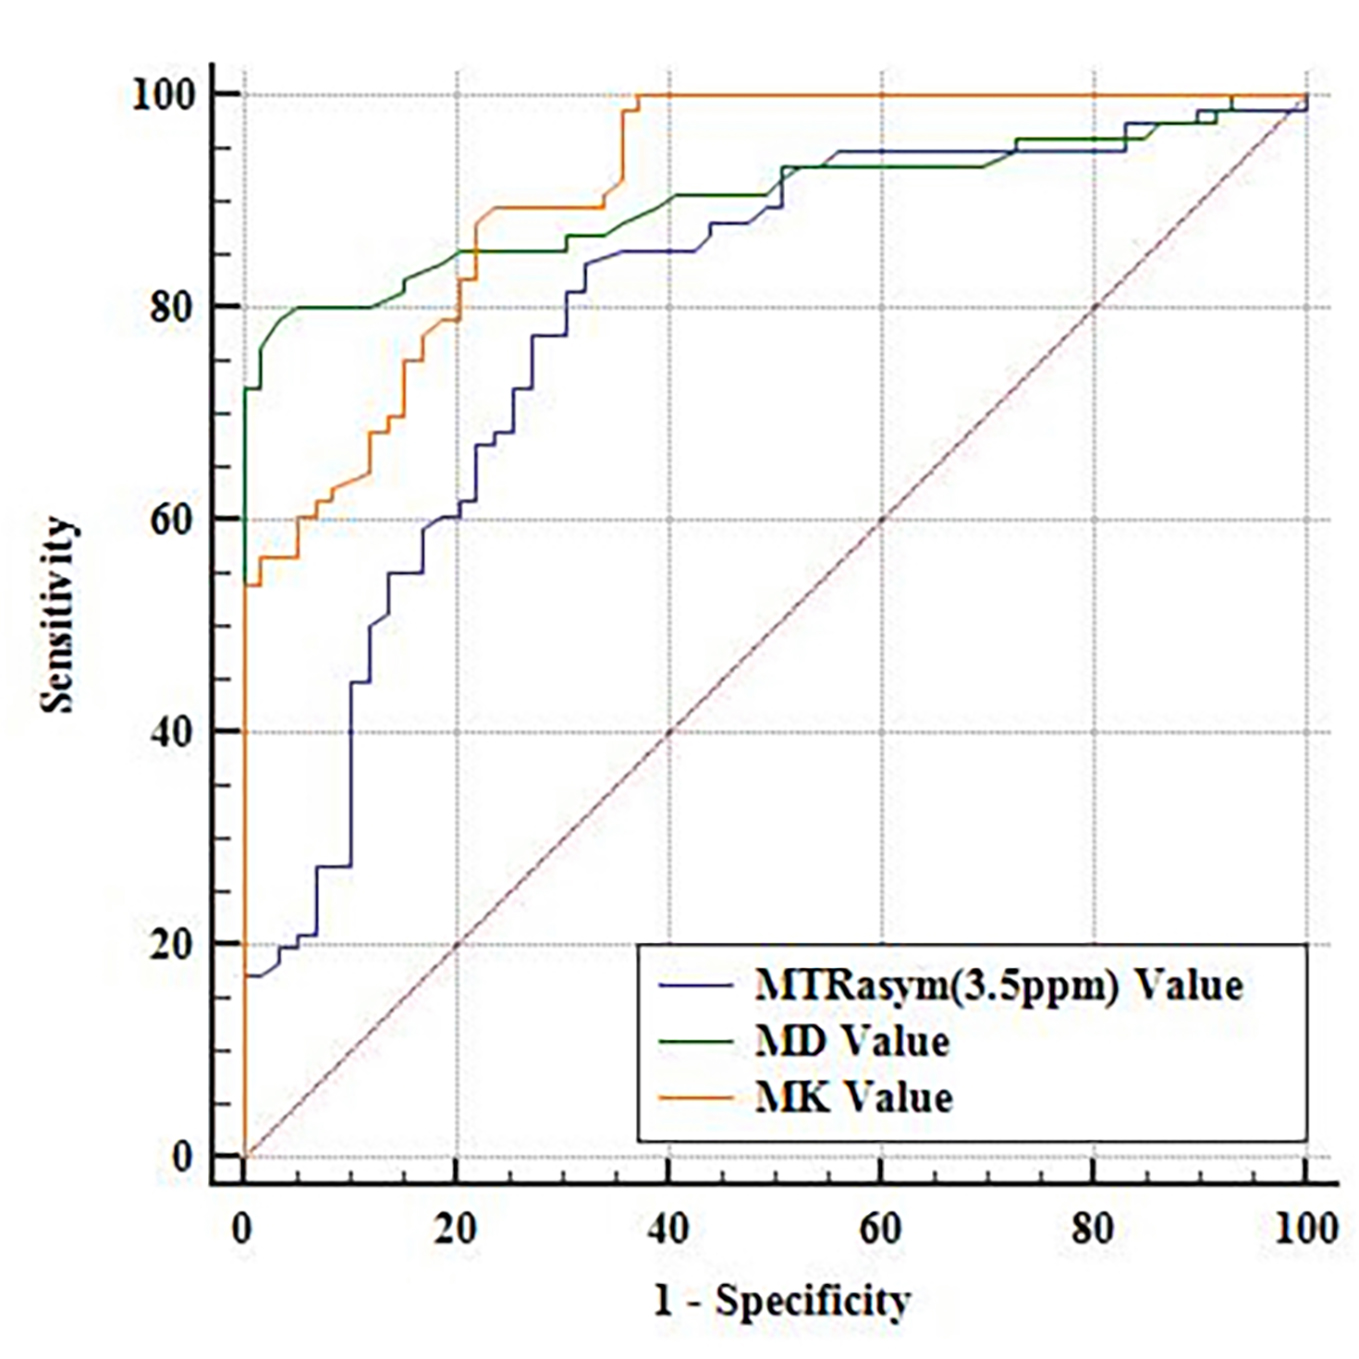
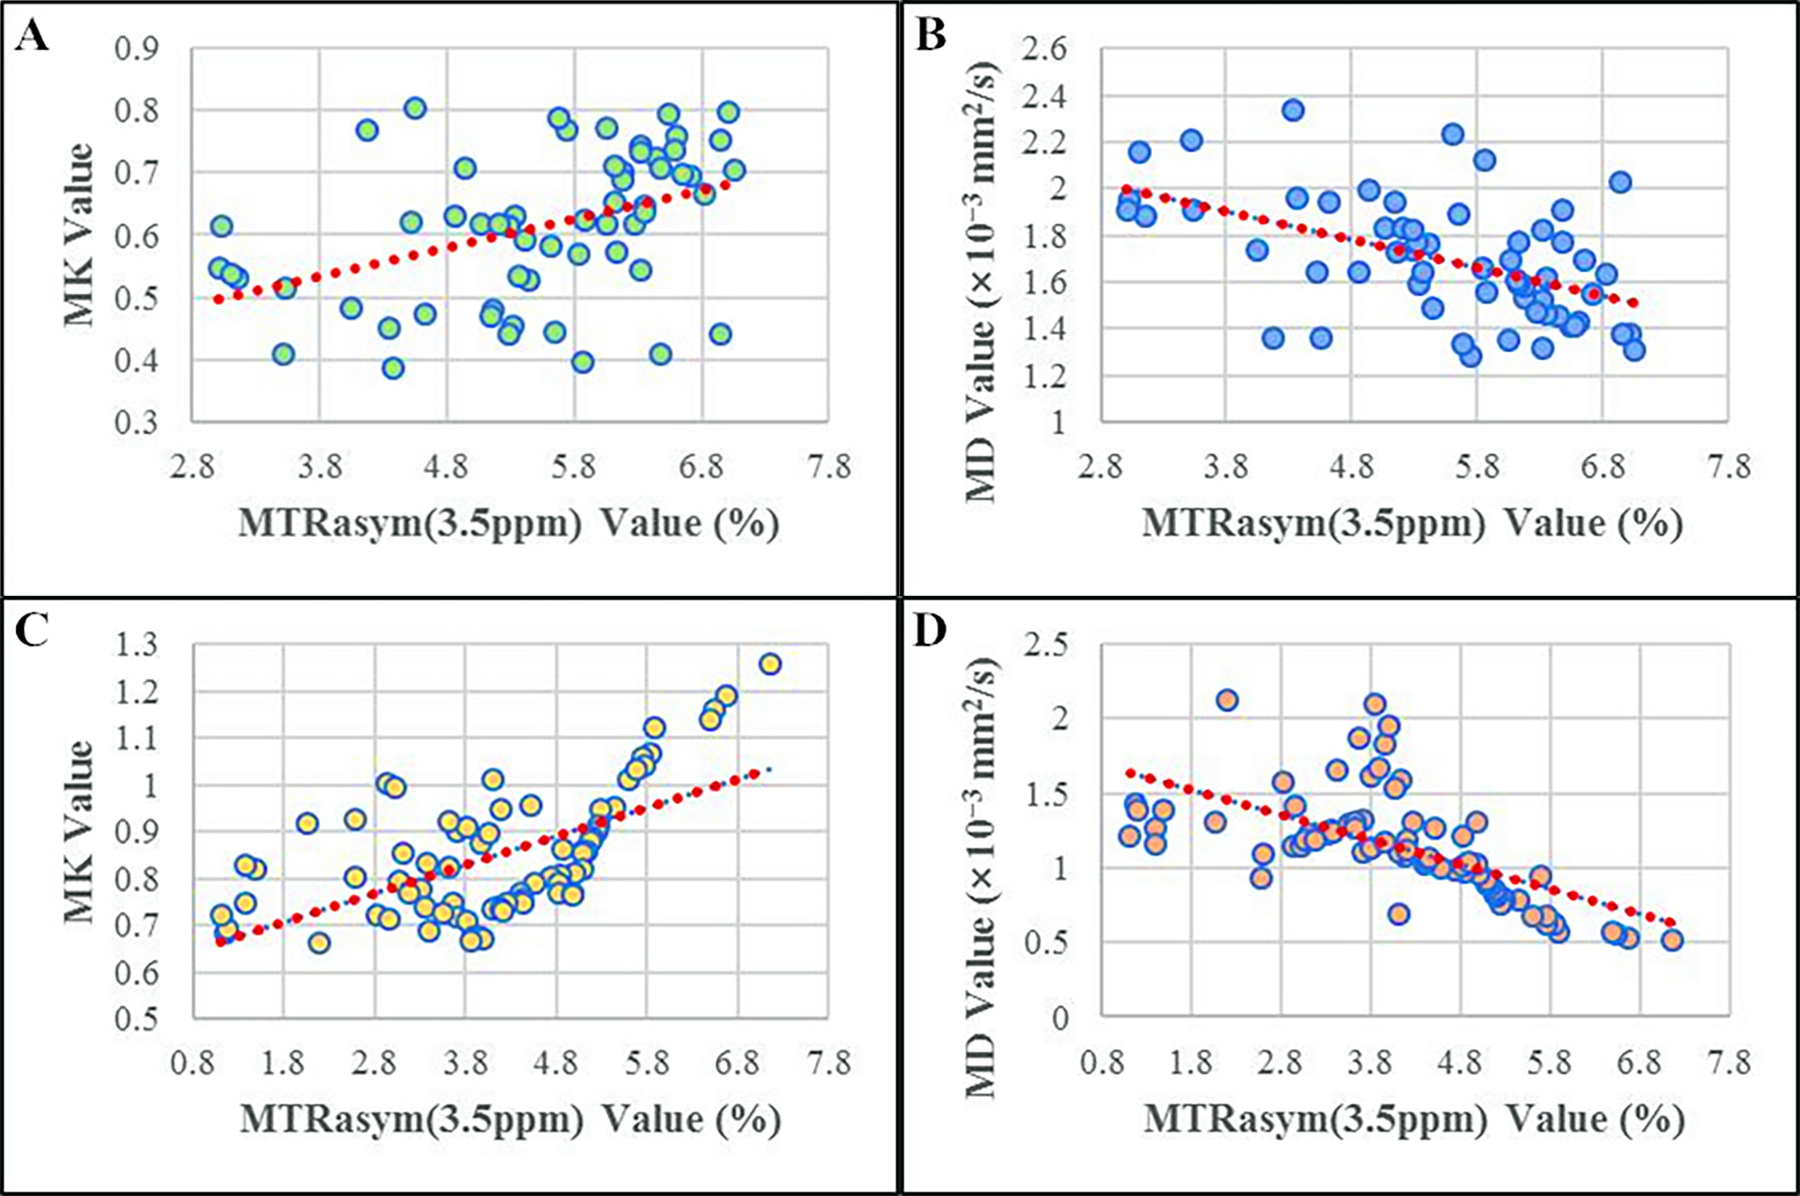
The MTRasym(3.5ppm) and MD values of the benign (5.53 ± 1.09, 1.69 ± 0.26) group are higher than that in the malignant (4.13 ± 1.34, 1.13 ± 0.36) group, MK value in the benign (0.61 ± 0.12) group is lower than that of the malignant (0.85 ± 0.14) group (Figure 1, 2). The MK from DKI demonstrated the highest AUC of 0.913, which is significantly higher than the MTRasym(3.5ppm) derived from APTWI (Z=2.277, P= 0.023); The MD from DKI demonstrated the second highest AUC of 0.903, which is also significantly higher than the MTRasym(3.5ppm) derived from APTWI (Z=1.991, P=0.046) ( Figure 3 ). In benign and malignant groups, the MTRasym(3.5ppm) were both moderately positively correlated with MK with r values of 0.417, 0.602, and moderately negatively correlated with MD with r values of -0.516, -0.625 ( Figure 4 ).Discussion
The MTRasym(3.5ppm), MK and MD values are significantly different between benign lesions and malignant lesions. These differences may be associated with the structure and function of cells. The structure and function of benign lesions are similar to normal breast tissue, which is loose in structure and can secrete a large amount of mucus to increases the content of proteins and peptides 6, benefiting the diffusion of water molecules. Compared with benign lesions, the malignant lesions have higher cellularity and more complex microstructure 7, which not only restrict the movement of water molecules but also destroy the secretory function of normal glands. In addition to these reasons, these results may also be related to the heterogeneous microenvironment and tissue microvessel density.Conclusion
We concluded that APTWI and DKI are both useful techniques for breast lesions, but DKI maybe better in the diagnosis of benign and malignant lesions.Acknowledgements
The National Natural Science Foundation of China (grants 81271565 and 31470047) and the National Clinical Key Specialty of China.References
1. Filli L, Ghafoor S, Kenkel D, et al. Simultaneous multi-slice readout segmented echo-planar imaging for accelerated diffusion-weighted imaging of the breast. Eur J Radiol 2016;85:274–278.
2. Takayama Y, Nishie A, Togao O, et al. Amide Proton Transfer MR Imaging of Endometrioid Endometrial Adenocarcinoma: Association with Histologic Grade. Radiology, 2018, 286(3): 909-917.
3. Jensen JH, Helpern JA, Ramani A, et al. Diffusional kurtosis imaging: the quantification of non-gaussian water diffusion by means of magnetic resonance imaging[J]. Magnetic resonance in medicine, 2005,53(6):1432-1440.
4. Krikken E, Khlebnikov V, Zaiss M, et al.Amide chemical exchange saturation transfer at 7T: a possible biomarker for detecting early response to neoadjuvant chemotherapy in breast cancer patients[J].Breast cancer research : BCR,2018,20(1):51.
5. Park VY, Kim SG, Kim EK, et al. Diffusional kurtosis imaging for differentiation of additional suspicious lesions on preoperative breast MRI of patients with known breast cancer[J].Magnetic resonance imaging,2019,62():199-208.
6. Ohno Y, Yui M, Koyama H, et al.Chemical Exchange Saturation Transfer MR Imaging: Preliminary Results for Differentiation of Malignant and Benign Thoracic Lesions. Radiology,2016,279(2):578-589.
7. Li T, Yu T, Li L, et al. Use of diffusion kurtosis imaging and quantitative dynamic contrast-enhanced MRI for the differentiation of breast tumors[J]. Journal of magnetic resonance imaging: JMRI,2018,48(5):1358-1366.
Figures