0567
Low-Dose, High-Temporal-Resolution Dynamic Contrast Enhanced MRI With Dynamic T1 Mapping Using Multitasking: An Initial Study on Breast Cancer1Biomedical Imaging Research Institute, Cedars-Sinai Medical Center, Los Angeles, CA, United States, 2Department of Bioengineering, University of California, Los Angeles, Los Angeles, CA, United States, 3Beijing Chaoyang Hospital, Beijing, China, 4Radiation Oncology, Cedars-Sinai Medical Center, Los Angeles, CA, United States
Synopsis
DCE MRI is a well-accepted tool in the management of breast cancer, but continues to face technical challenges and concerns regarding gadolinium deposition. In this work, we proposed a novel Multitasking DCE technique, which enables adequate breast coverage, 0.9-mm isotropic spatial resolution, 1.5-s temporal resolution, dynamic T1 mapping throughout all DCE phases, and reduced dose of 0.02mmol/kg for the imaging of breast cancer. The in vivo studies demonstrated that the low-dose Multitasking DCE showed equivalent tumor delineation compared to standard DCE. The quantitative DCE parameters were repeatable in vivo and significantly different between normal breast and breast cancer.
Introduction
Dynamic contrast-enhanced (DCE) MRI is a well-accepted MRI technique in the management of breast cancer, known for its superior sensitivity1-4. However, conventional DCE methods continue to face technical challenges. One major obstacle is the difficulty in achieving adequate coverage, high spatial resolution and high temporal resolution at the same time5. Clinical DCE protocols usually adopt 1-millimeter spatial resolution for sufficient anatomical delineation with poor temporal resolution (60s to 90s per phase), which obscures the kinetic information and limits the ability to quantify the functional characteristics of cancer. Another concern for DCE MRI is the risk of Gadolinium (Gd) retention in human body such as brain, bone, and kidneys, as recently reported6-9. Quantitative DCE has the capability to evaluate tissue microvascular features and may have the potential to reduce Gd dose while maintaining tissue conspicuity. In this work, we proposed a novel DCE MRI technique based on the MR Multitasking framework10, which enables adequate breast coverage, 0.9-mm isotropic spatial resolution, 1.5-s temporal resolution, and dynamic T1 mapping throughout all DCE phases for accurate quantification of tissue vascularity properties. The feasibility of using this method with a reduced dose of 0.02mmol/kg (20% of the standard dose) was tested on volunteers and patients.Methods
Sequence design: A continuous-acquisition pulse sequence with water-excited 3D FLASH readouts in between periodic saturation recovery (SR) preparations was used to generate T1 contrast, as described in our previous work11. A 3D Cartesian sampling pattern was designed with randomized Gaussian-density reordering in both phase and partition encoding directions to collect imaging data. The center k-space line was collected in anterior-posterior direction every 8 readouts as training data.Reconstruction: The 5D image $$$I(x,y,z,\tau,t)$$$ was presented as a three-way tensor $$$\mathcal{A}$$$ with voxel location index $$$\mathbf{r}=(x,y,z)$$$, an SR dimension $$$\tau$$$, and a DCE time course $$$t$$$. High image correlation along and across dimensions induces $$$\mathcal{A}$$$ to be low-rank, which can be factorized as $$$\mathbf{A}_{(1)}=\mathbf{U}\mathbf{\Phi}$$$, where $$$\mathbf{A}_{(1)}$$$ is the unfolded matrix form of the tensor. The factor $$$\mathbf{\Phi}$$$ containing temporal bases describing T1 relaxation and contrast dynamics is first determined by Bloch-constrained low-rank tensor completion of the training data. The spatial coefficient $$$\mathbf{U}$$$ is then recovered by fitting $$$\mathbf{\Phi}$$$ to the acquired imaging data $$$\mathbf{d}$$$:$$\widehat{\mathbf{U}}=\arg\min_{\mathbf{U}}\|\mathbf{d}-\Omega(\mathbf{F}\mathbf{S}\mathbf{U}\mathbf{\Phi})\|_{2}^{2}+R(\mathbf{U}),$$with undersampling operator $$$\Omega$$$, Fourier transform $$$\mathbf{F}$$$, coil sensitivity operator $$$\mathbf{S}$$$, and regularization function $$$R(\cdot)$$$ (in this work, a spatial total-variation sparsity penalty).
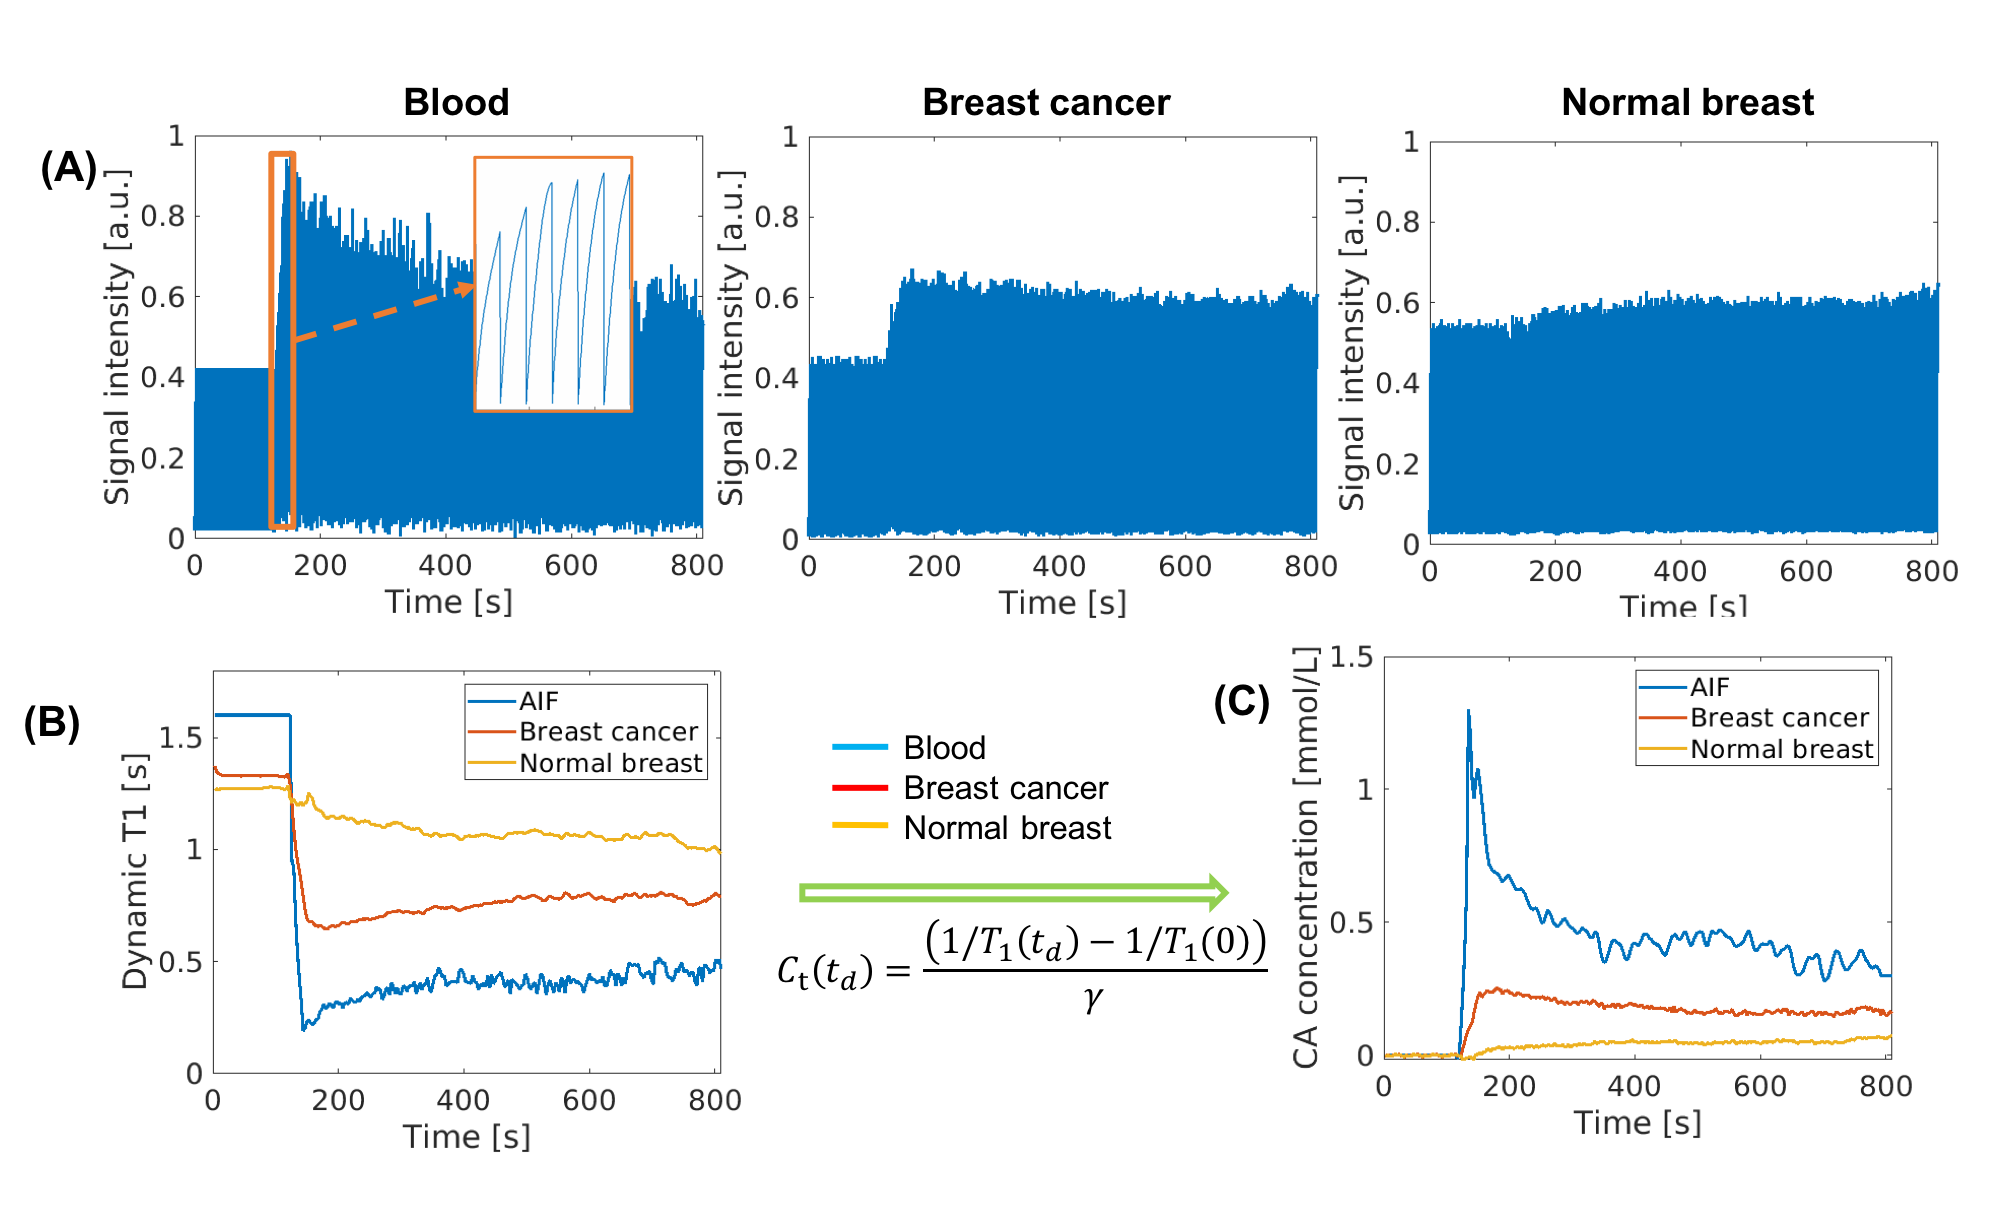
Dynamic T1 quantification and kinetic modeling: The T1 for each SR period was estimated from the signal model:$$s\left(A,\alpha,B,n,T_{1}(t)\right)=A\frac{1-e^{-T_{R}/T_{1}(t)}}{1-e^{-T_{R}/T_{1}(t)}\cos\alpha}\left[1+(B-1)\left(e^{-T_{R}/T_{1}(t)}\cos\alpha\right)^{n}\right]\sin\alpha,$$with DCE time point $$$t$$$, amplitude $$$A$$$, SR pulse efficiency $$$B$$$, and recovery time point $$$n=1,2,...,N$$$ ($$$N$$$=276 per SR period). The dynamic T1 $$$R_{1}(t)$$$ was then converted to contrast agent (CA) concentration according to relaxivity:$$C_{\mathrm{t}}(t)=\frac{1/T_{1}(t)-1/T_{1}(0)}{\gamma},$$where $$$\gamma$$$ is the relaxivity rate. The two-compartment extended Tofts model was used to evaluate the kinetic properties12.
Imaging experiment: All the data were acquired on a 3T scanner (VIDA, Siemens) in transversal orientation with the following parameters: TE/TR=2.4/5.2ms, FOV=350x250x176mm3, spatial resolution=0.9mm isotropic, temporal resolution=1.5s, flip angle=5°, scan time=13.5min. Gd contrast media (Gadavist, 0.02mmol/kg, 5-time dilute) was administered at the rate of 2.0ml/s. For clinical DCE, FOV=350x350x200mm3, spatial resolution=0.9mm isotropic, temporal resolution=82s, scan time=10.5min, and Gd contrast media is Gadavist at 0.1mmol/kg.
Volunteer study: Female volunteers (N = 15) without a history of breast disease were recruited as the control group. Seven volunteers underwent two low-dose Multitasking DCE scans in the same imaging session to evaluate repeatability. The other eight volunteers underwent one low-dose and one standard-dose (0.1mmol/kg) Multitasking DCE scan to assess correlation of the kinetic parameters estimated by low-dose and standard-dose Multitasking DCE.
Patient study: Patients (N = 6) were recruited with pathologically-confirmed triple-negative breast cancer (TNBC). All patients were scanned with low-dose Multitasking DCE followed by standard-dose clinical DCE. The diagnostic results from low-dose Multitasking DCE were evaluated and compared to the output of clinical images.
Results and Discussion
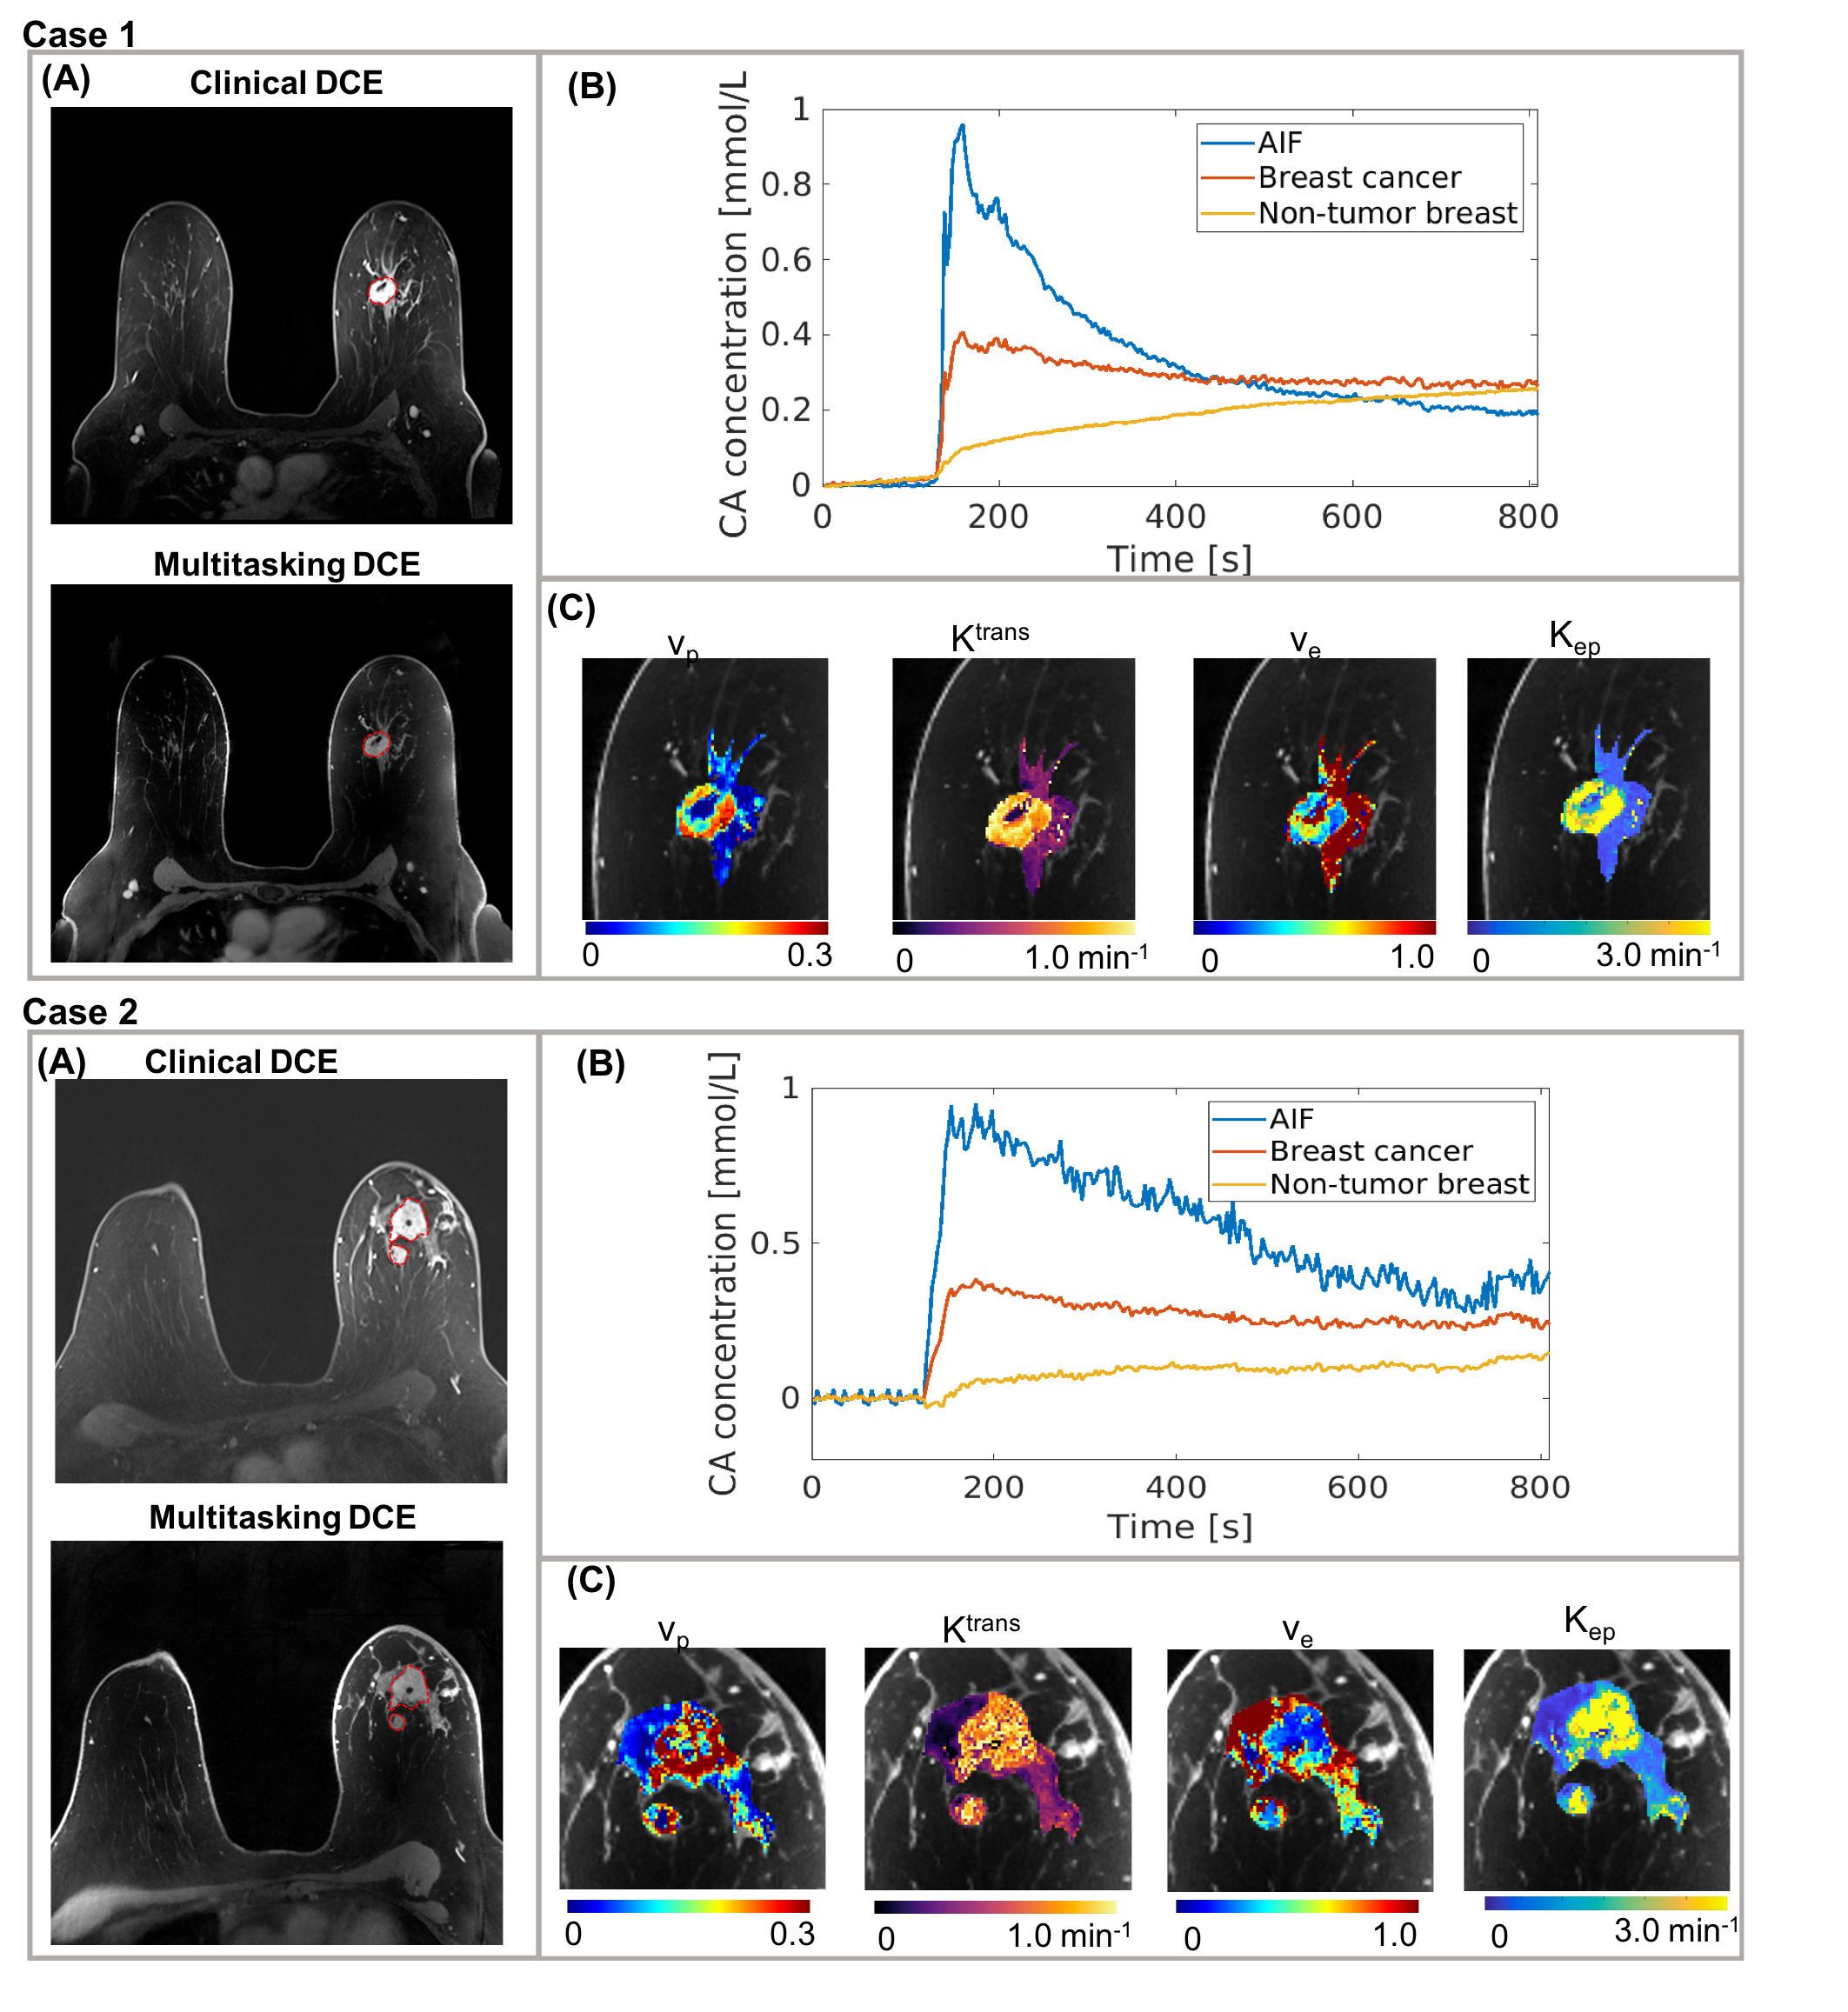
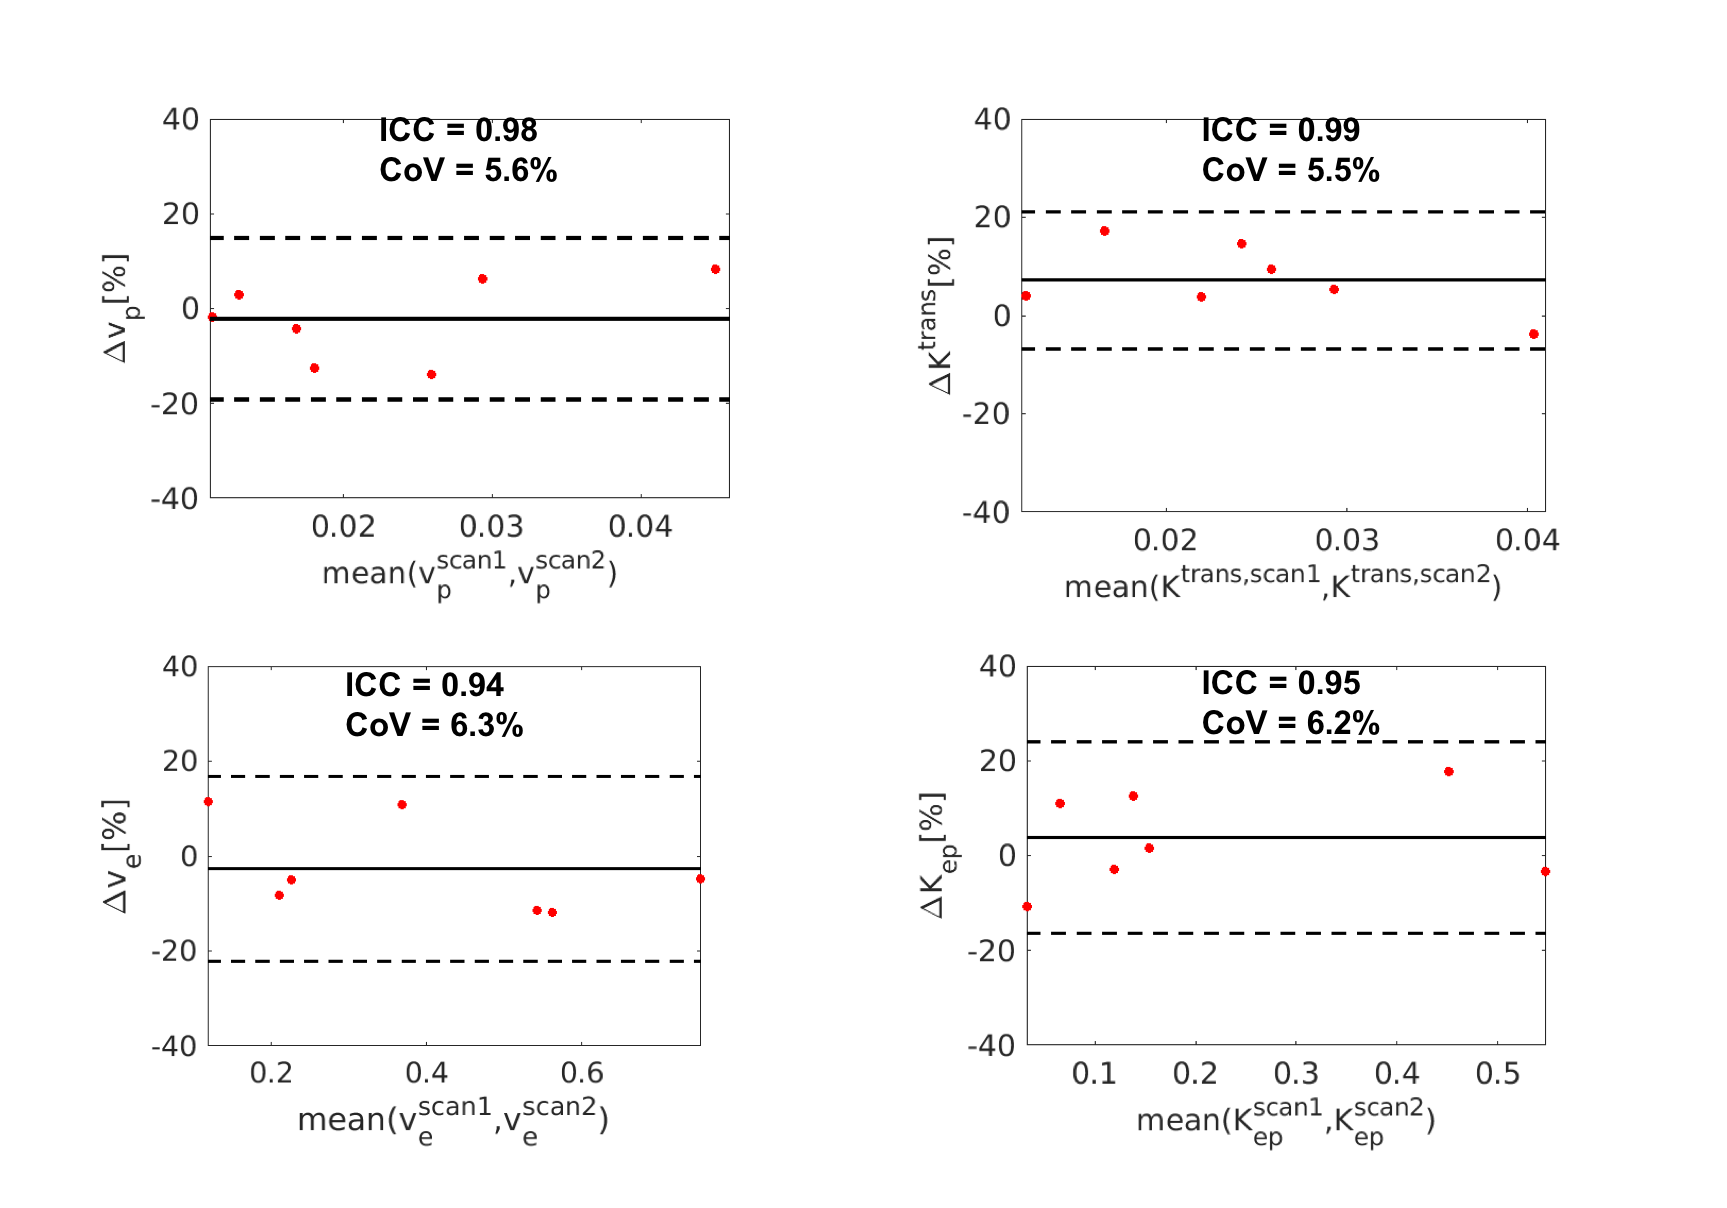
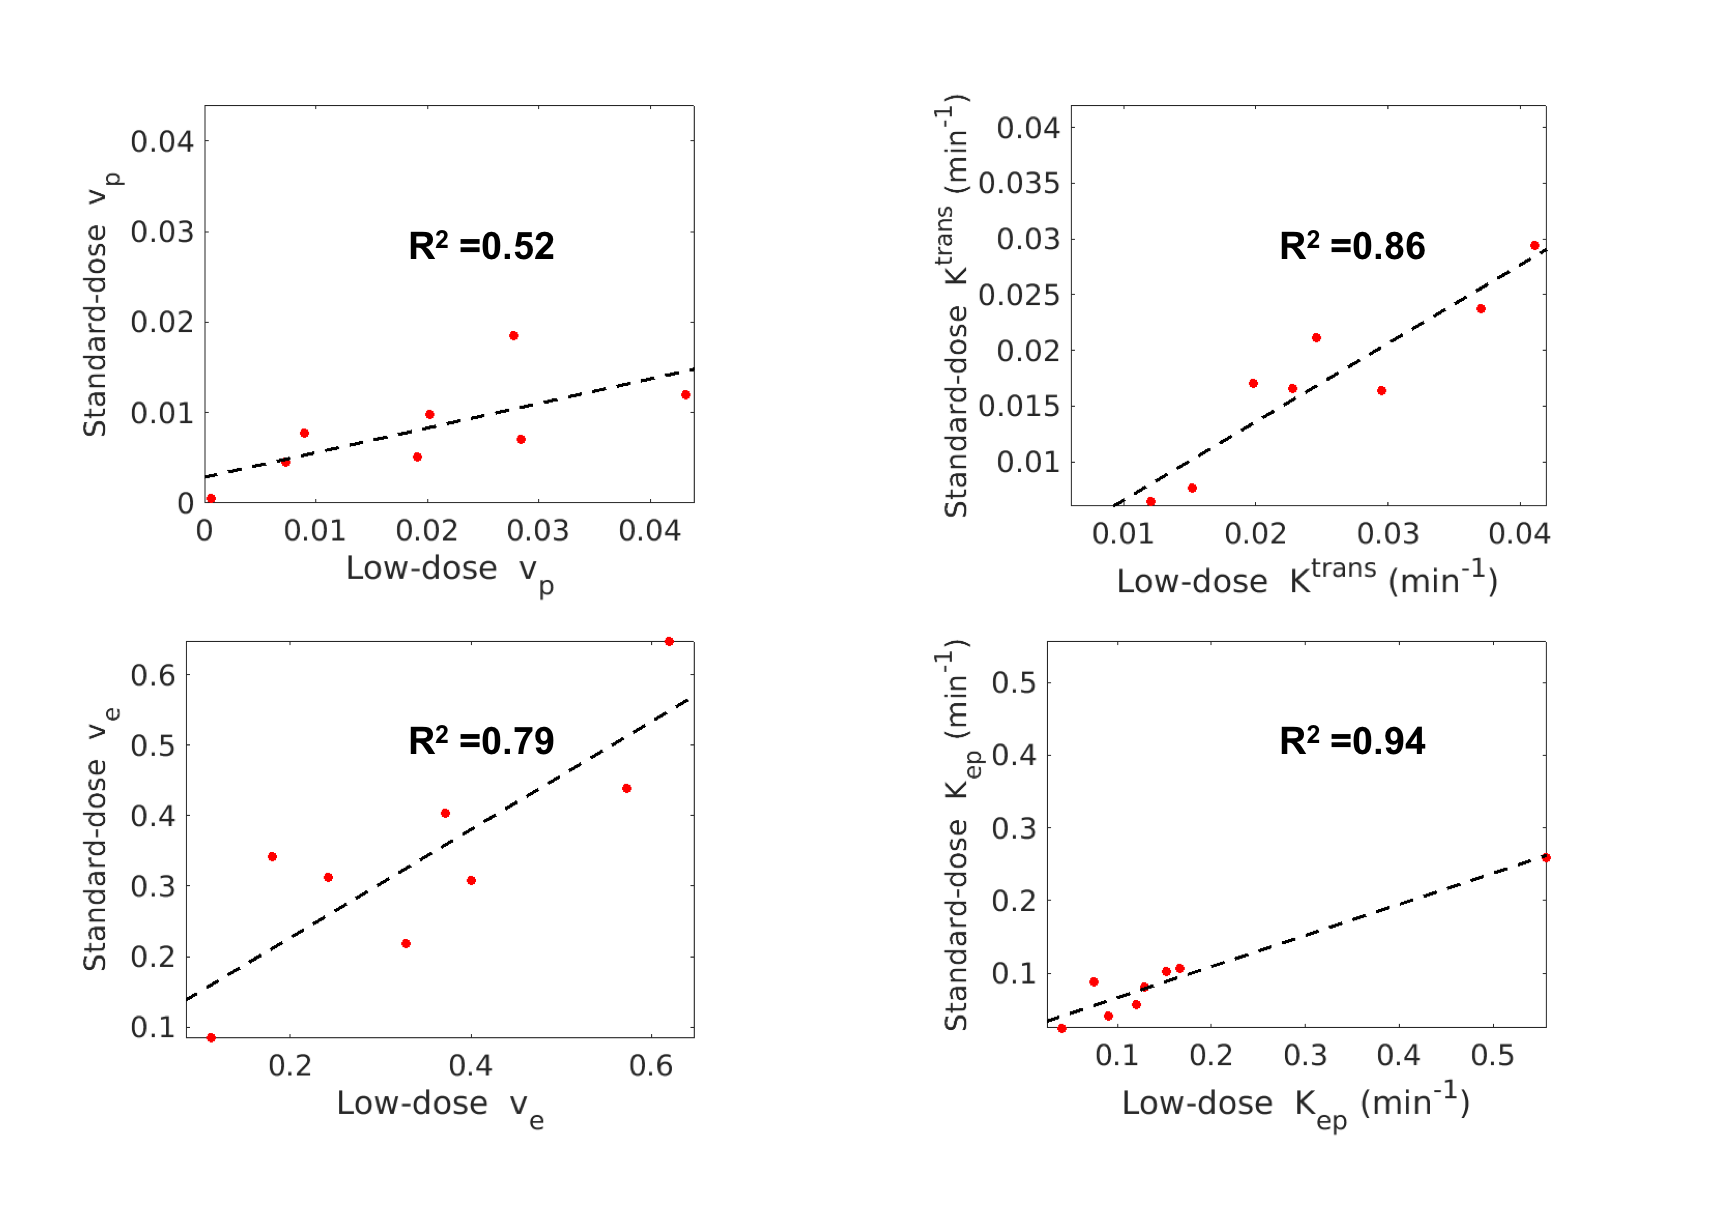
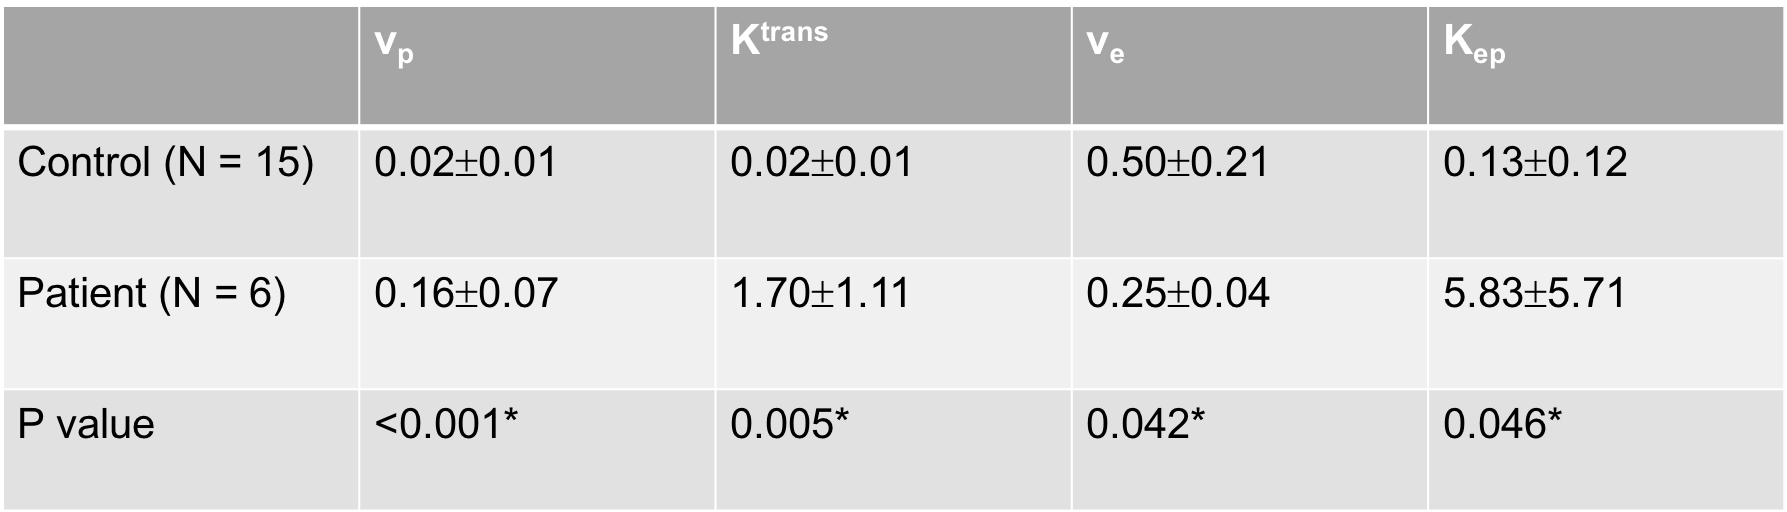
Figure 1 illustrates the conversion from signal intensity to contrast concentration using dynamic T1 quantification. Low-dose Multitasking DCE provides equivalent tumor delineation compared to standard-dose clinical DCE, as shown in Figure 2A. The enhancement pattern and kinetic parameters of cancer estimated by Multitasking DCE are also displayed in Figure 2. The repeatability of vp, Ktrans, ve and Kep from low-dose Multitasking DCE are shown in Figure 3, with ICCs of 0.98 0.99, 0.94, 0.95, respectively. Figure 4 shows the correlation for each parameter between low-dose and standard-dose Multitasking DCE with R2=0.52, 0.86, 0.79, 0.94, respectively. Table 1 lists mean value and standard deviation of the kinetic parameters of normal breast and breast cancer. The P value by one-way ANOVA indicates that vp, Ktrans, ve and Kep were significantly different in breast cancer and normal breast (P <0.001, =0.005, 0.042, 0.046, respectively).Conclusion
In this work, the feasibility of Multitasking DCE using 20% of a standard Gd dose for characterizing breast cancer was demonstrated, with equivalent tumor delineation compared to standard-dose clinical DCE. Adequate breast coverage, 0.9-mm isotropic spatial resolution, 1.5-s temporal resolution, and dynamic T1 mapping throughout all DCE phases were achieved. The quantitative DCE parameters were repeatable in vivo and significantly different between normal breast and breast cancer. Further clinical validation in a larger patient cohort is warranted.Acknowledgements
This work was supported by NIH 1R01EB028146.References
1. Menezes GL, Knuttel FM, Stehouwer BL, Pijnappel RM, van den Bosch MAJWjoco. Magnetic resonance imaging in breast cancer: a literature review and future perspectives. 2014;5(2):61.
2. Partridge SC, Vanantwerp RK, Doot RK, Chai X, Kurland BF, Eby PR, Specht JM, Dunnwald LK, Schubert EK, Lehman CDJJoMRI. Association between serial dynamic contrast‐enhanced MRI and dynamic 18F‐FDG PET measures in patients undergoing neoadjuvant chemotherapy for locally advanced breast cancer. 2010;32(5):1124-1131.
3. Rahbar H, Partridge SC. Multiparametric MR imaging of breast cancer. Magnetic Resonance Imaging Clinics 2016;24(1):223-238.
4. Turnbull LW. Dynamic contrast‐enhanced MRI in the diagnosis and management of breast cancer. NMR in Biomedicine: An International Journal Devoted to the Development and Application of Magnetic Resonance In vivo 2009;22(1):28-39.
5. Abe H, Mori N, Tsuchiya K, Schacht DV, Pineda FD, Jiang Y, Karczmar GS. Kinetic analysis of benign and malignant breast lesions with ultrafast dynamic contrast-enhanced MRI: comparison with standard kinetic assessment. American Journal of Roentgenology 2016;207(5):1159-1166.
6. Huckle JE, Altun E, Jay M, Semelka RCJIr. Gadolinium deposition in humans: when did we learn that gadolinium was deposited in vivo? 2016;51(4):236-240.
7. Kanda T, Ishii K, Kawaguchi H, Kitajima K, Takenaka DJR. High signal intensity in the dentate nucleus and globus pallidus on unenhanced T1-weighted MR images: relationship with increasing cumulative dose of a gadolinium-based contrast material. 2013;270(3):834-841.
8. McDonald RJ, McDonald JS, Kallmes DF, Jentoft ME, Murray DL, Thielen KR, Williamson EE, Eckel LJJR. Intracranial gadolinium deposition after contrast-enhanced MR imaging. 2015;275(3):772-782.
9. Murata N, Gonzalez-Cuyar LF, Murata K, Fligner C, Dills R, Hippe D, Maravilla KRJIr. Macrocyclic and other non–group 1 gadolinium contrast agents deposit low levels of gadolinium in brain and bone tissue: preliminary results from 9 patients with normal renal function. 2016;51(7):447-453.
10. Christodoulou AG, Shaw JL, Nguyen C, Yang Q, Xie Y, Wang N, Li D. Magnetic resonance multitasking for motion-resolved quantitative cardiovascular imaging. Nature Biomedical Engineering 2018;2(4):215.
11. Wang N, Christodoulou AG, Xie Y, Wang Z, Deng Z, Zhou B, Lee S, Fan Z, Chang H, Yu WJMrim. Quantitative 3D dynamic contrast‐enhanced (DCE) MR imaging of carotid vessel wall by fast T1 mapping using Multitasking. 2019;81(4):2302-2314.
12. Tofts PS, Brix G, Buckley DL, Evelhoch JL, Henderson E, Knopp MV, Larsson HB, Lee TY, Mayr NA, Parker GJ, Port RE, Taylor J, Weisskoff RM. Estimating kinetic parameters from dynamic contrast-enhanced T(1)-weighted MRI of a diffusable tracer: standardized quantities and symbols. J Magn Reson Imaging 1999;10(3):223-232
Figures