0566
Diagnosis of Benign and Malignant Breast Lesions on DCE-MRI by Using Radiomics and Deep Learning with Consideration of Peri-Tumor Tissue
Jiejie Zhou1, Yang Zhang2, Kai-Ting Chang3, Kyoung Eun Lee4, Ouchen Wang1, Jiance Li1, Yezhi Lin5, Zhifang Pan5, Peter Chang3, Daniel Chow3, Meihao Wang1, and Min-Ying Su3
1First Affiliate Hospital of Wenzhou Medical University, Wenzhou, China, 2University of California, Irvine, CA, United States, 3University of California, Irvine, Irvine, CA, United States, 4Inje University Seoul Paik Hospital, Seoul, Korea, Republic of, 5Wenzhou Medical University, Wenzhou, China
1First Affiliate Hospital of Wenzhou Medical University, Wenzhou, China, 2University of California, Irvine, CA, United States, 3University of California, Irvine, Irvine, CA, United States, 4Inje University Seoul Paik Hospital, Seoul, Korea, Republic of, 5Wenzhou Medical University, Wenzhou, China
Synopsis
A
total of 91 malignant/62 benign lesions were used for training, and 48
malignant/26 benign lesions for independent testing. Deep learning with
ResNet50 were performed for differential diagnosis. To investigate the
contribution of peri-tumor tissue, the tumor alone, smallest bounding box, and
1.2, 1.5, 2.0 times enlarged boxes were used as inputs. For per-lesion
diagnosis, The accuracy was 91% for smallest bounding box, 84% for tumor alone
and 1.2 times box, and further to 73% for 1.5 times box and 69% for 2.0 times
box. In the independent testing dataset, the highest accuracy was 89% for the
smallest bounding box.
Introduction
Breast MRI is an important clinical imaging modality for management of breast cancer. With increasing screening and preoperative MRI performed, particularly in community settings, an efficient way for characterization of the enhancing lesions is important to improve diagnostic accuracy. Other than evaluation based on radiologists’ visual assessment, radiomics using computer algorithms can extract comprehensive quantitative features to characterize lesion and develop diagnostic models. Recently, deep learning methods, especially Convolution Neural Network, are extensively applied for medical image processing, which can be used for tumor diagnosis as well. The tumor microenvironment is known to play a very important role in growth and invasion of tumor, and peri-tumor tissue is shown to provide information for diagnosis and prediction of prognosis. The goal of this study is to evaluate the diagnostic accuracy of breast lesions detected on DCE-MRI with deep learning, by using 5 different sizes of input boxes containing the tumor with different amount of peri-tumor tissues to evaluate their diagnostic performance. For comparison with the deep learning results, the diagnosis was also done with conventional methods using the whole tumor ROI-based and radiomics analysis.Methods
A total of 133 patients were used in the training dataset, including 91 malignant (mean age 51±10), and 62 benign lesions (mean age 45±11). The newer 74 patients with 48 malignant and 26 benign lesions were used for testing. All lesions were confirmed by histological examination. The MRI was performed using a GE 3.0T system. DCE was acquired using 6 frames, one pre-contrast (F1) and 5 post-contrast (F2-F6). Tumors were segmented based on contrast-enhanced maps using fuzzy-C-means (FCM) clustering algorithm [1]. Five whole tumor ROI-based parameters, including 1-D size, 3-D volume and enhancement ratios were calculated. Three heuristic DCE parametric maps were generated according to: the early wash-in signal enhancement (SE) ratio [(F2-F1)/F1]; the maximum SE ratio = [(F3-F1)/F1]; the wash-out slope [(F6-F3)/F3] [2]. On each map, 12 histogram parameters and 20 GLCM texture features were extracted [3]. From the total of 99 radiomics features, the random forest algorithm was used to select 15 with the highest significance to train a logistic model for diagnosis [4]. The deep learning was performed using ResNet50 convolutional neural networks [5]. The analysis was done based on three DCE parametric maps as inputs. For each case, the smallest square bounding box containing the entire tumor was generated [6]. All slices were used as independent inputs, and the dataset was further augmented by random affine transformation. The loss function is cross entropy and the optimizer is Adam with learning rate 0.001 [7]. ImageNet works as the initial values of the parameters in these models [8]. The accuracy was evaluated using 10-fold cross-validation. To evaluate the role of peritumoral environment, the analysis was done using 5 different input methods: 1) the tumor ROI only by setting all outside tumor pixels in the box as zero, 2) the smallest bounding box, 3) enlarged by 1.2 times, 4) enlarged by 1.5 times, and 5) enlarged by 2 times, as demonstrated in Figures 1 and 2. The box was resized to 64x64 as input in deep learning.Results
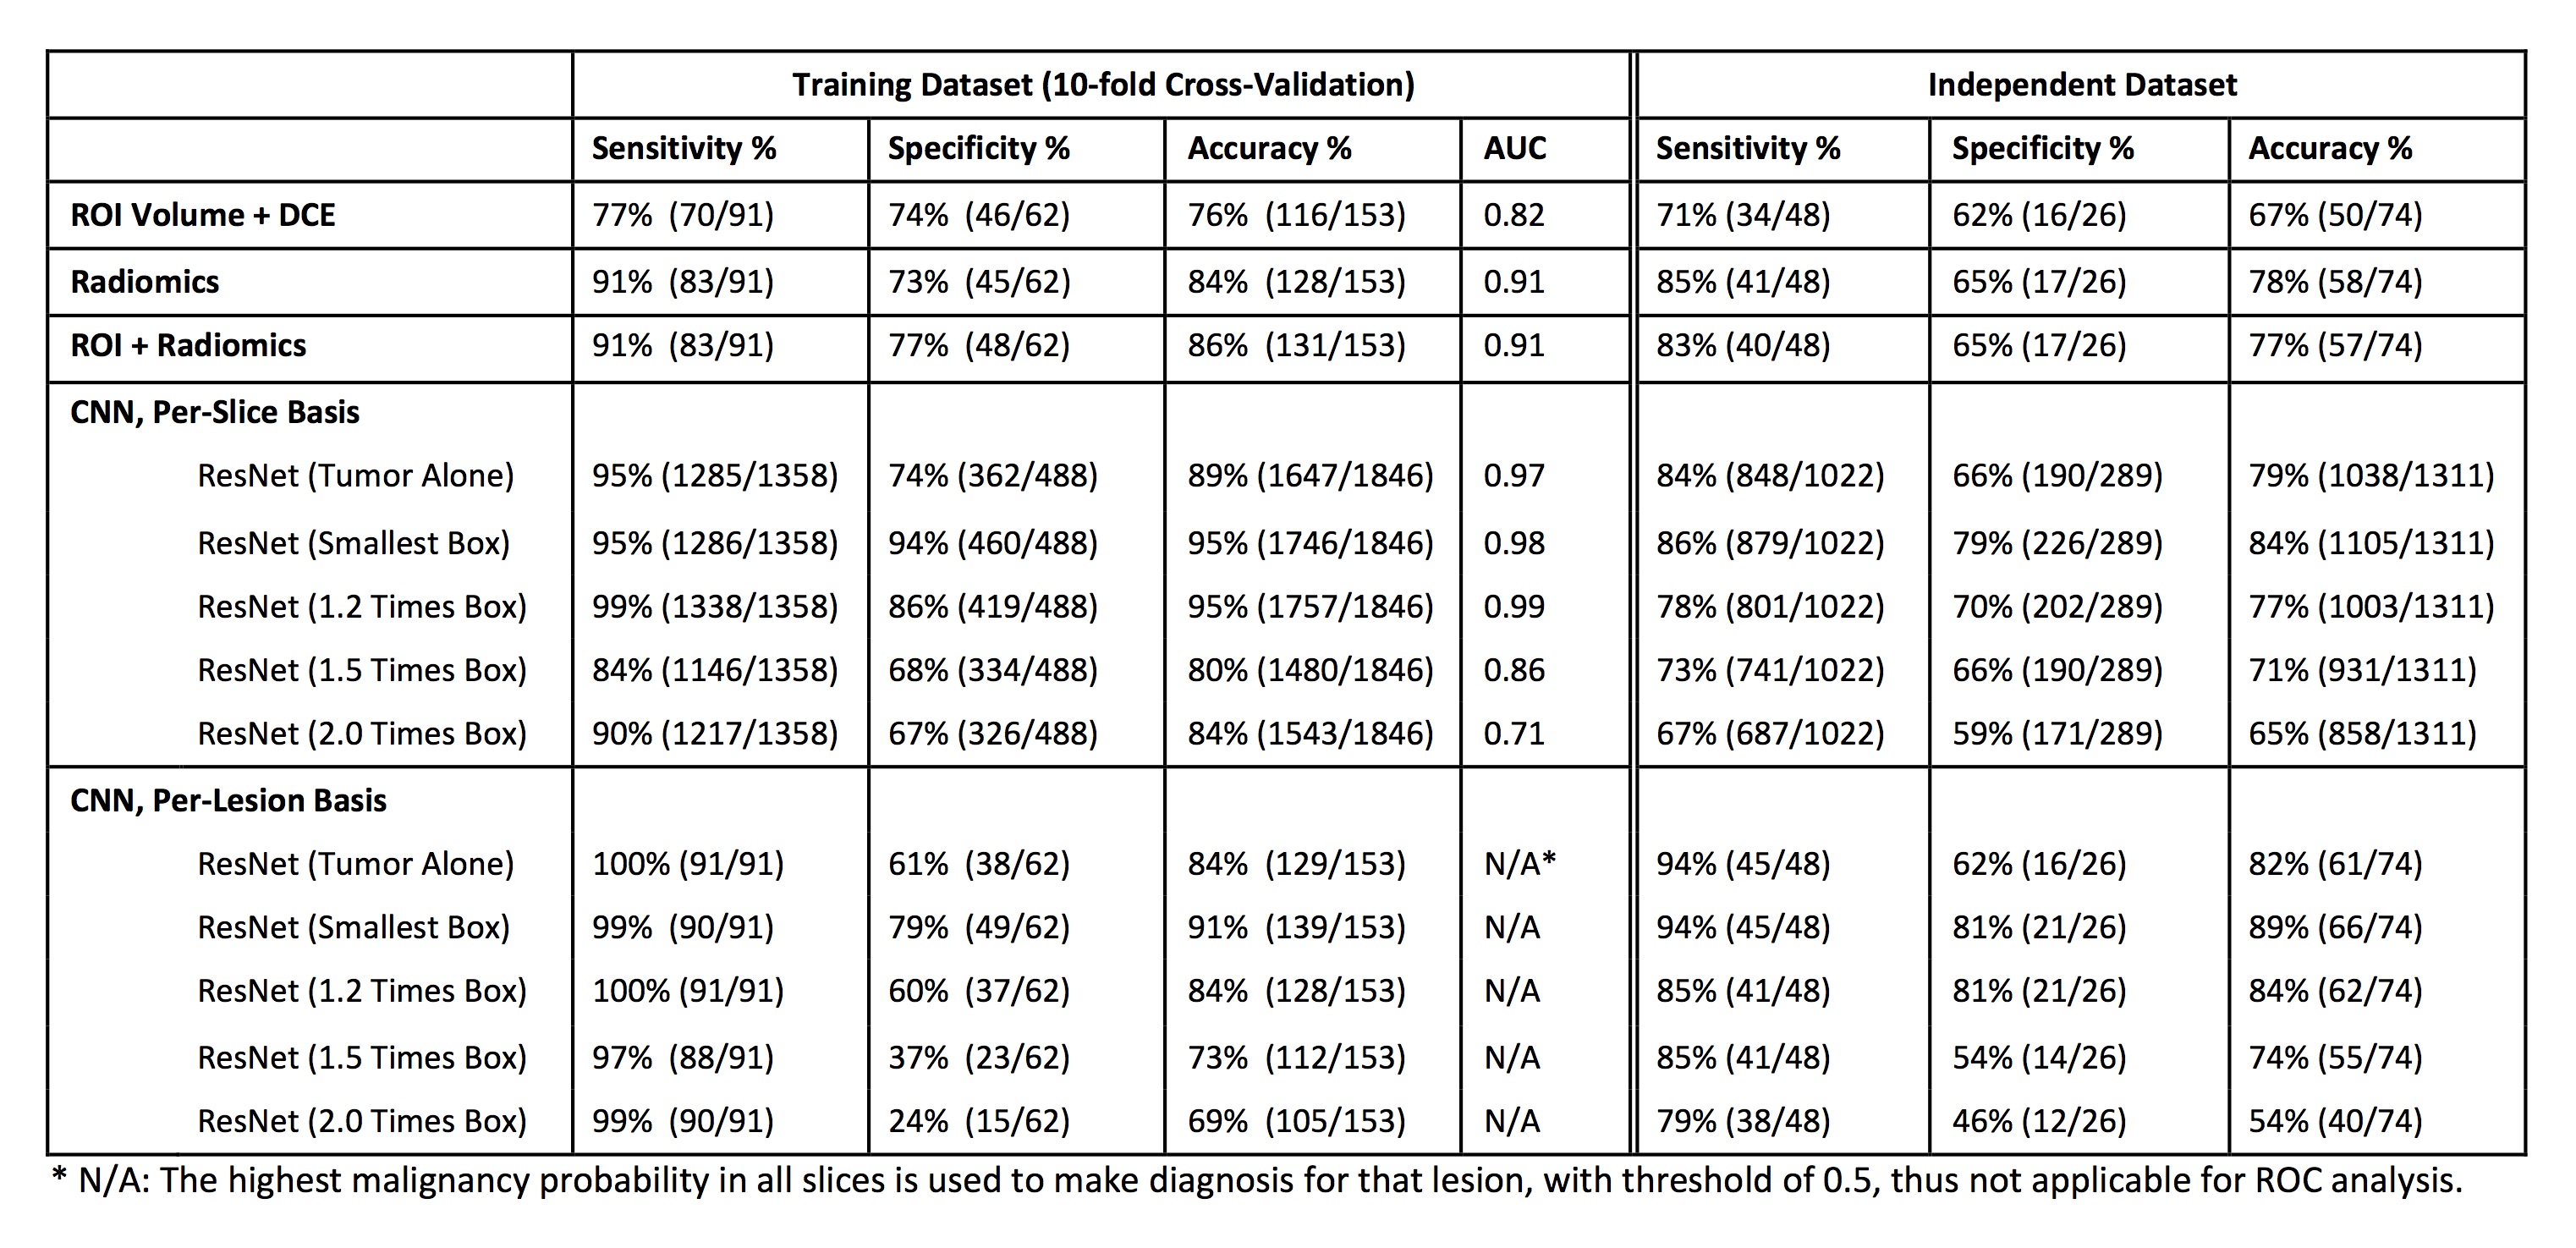
The results obtained by using ROI, radiomics, ROI+radiomics, and various deep learning models are summarized in Table 1. The trained models were applied to the independent testing dataset, results also in the table. The diagnosis made by the radiomics model is illustrated in Figure 3. For deep learning, all analyses were done using per-slice basis, and the ROC curves generated by using 5 different input methods are shown in Figure 4. For per-lesion diagnosis, the highest malignancy probability from all slices of one lesion was assigned to that lesion, and the diagnosis made based on the threshold of 0.5 is shown in Table 1.Discussion
In the training dataset, the diagnostic accuracy was 76% using three ROI-based parameters, 84% using the radiomics model, and 86% using ROI+radiomics model. In deep learning using per-slice basis, the area under the ROC was comparable for tumor alone, smallest and 1.2 times box (AUC=0.97-0.99), which were significantly higher than 1.5 and 2.0 times box (AUC= 0.86 and 0.71, respectively). For per-lesion diagnosis, the highest accuracy of 91% was achieved when using the smallest bounding box, and that decreased to 84% for tumor alone and 1.2 times box, and further to 73% for 1.5 times box and 69% for 2.0 times box. In the independent testing dataset, the per-lesion diagnostic accuracy was also the highest when using the smallest bounding box, 89%. The results suggest that considering the proximal peri-tumor tissue immediately adjacent to the tumor boundary provides useful information to help diagnosis [9,10]. As the size of the box increases, the performance becomes worse and worse, which might be in part due to lower input image resolutions into the neural networks and the information from the tumor is diluted.Acknowledgements
This work was supported in part by Foundation of Wenzhou Science & Technology Bureau (No. Y20180187 and Y20180144), Medical Health Science and Technology Project of Zhejiang Province Health Commission (No. 2019KY102), Zhejiang Provincial Natural Science Foundation of China (No. LQ15A010009 and LY16F030010), and NIH/NCI R01 CA127927 and R21 CA208938.References
[1]. Nie K, Chen J-H, Hon JY, Chu Y, Nalcioglu O, Su M-Y. Quantitative analysis of lesion morphology and texture features for diagnostic prediction in breast MRI. Academic radiology. 2008;15(12):1513-1525. [2]. Lang N, Su M-Y, Hon JY, Lin M, Hamamura MJ, Yuan H. Differentiation of myeloma and metastatic cancer in the spine using dynamic contrast-enhanced MRI. Magnetic resonance imaging. 2013;31(8):1285-1291. [3]. Haralick RM, Shanmugam K. Textural features for image classification. IEEE Transactions on systems, man, and cybernetics. 1973(6):610-621. [4]. Ho TK. Random decision forests. Paper presented at: Document analysis and recognition, 1995., proceedings of the third international conference on1995. [5]. Truhn D, Schrading S, Haarburger C, Schneider H, Merhof D, Kuhl C. Radiomic versus Convolutional Neural Networks Analysis for Classification of Contrast-enhancing Lesions at Multiparametric Breast MRI. Radiology. 2019;290(2):290-297. [6]. Shi L, Zhang Y, Nie K, et al. Machine learning for prediction of chemoradiation therapy response in rectal cancer using pre-treatment and mid-radiation multi-parametric MRI. Magn Reson Imaging. 2019;61:33-40. [7]. Kingma D, Ba J. Adam: A method for stochastic optimization. arXiv preprint arXiv:14126980. 2014. [8]. Deng J, Dong W, Socher R, Li L-J, Li K, Fei-Fei L. Imagenet: A large-scale hierarchical image database. Paper presented at: Computer Vision and Pattern Recognition, 2009. CVPR 2009. IEEE Conference on2009. [9]. Shin HJ, Park JY, Shin KC et al. Characterization of tumor and adjacent peritumoral stroma in patients with breast cancer using high-resolution diffusion-weighted imaging: Correlation with pathologic biomarkers. European journal of radiology 2016;85:1004-1011. [10]. Cheon H, Kim HJ, Kim TH, et al. Invasive Breast Cancer: Prognostic Value of Peritumoral Edema Identified at Preoperative MR Imaging. Radiology 2018;287(1):68-75.Figures
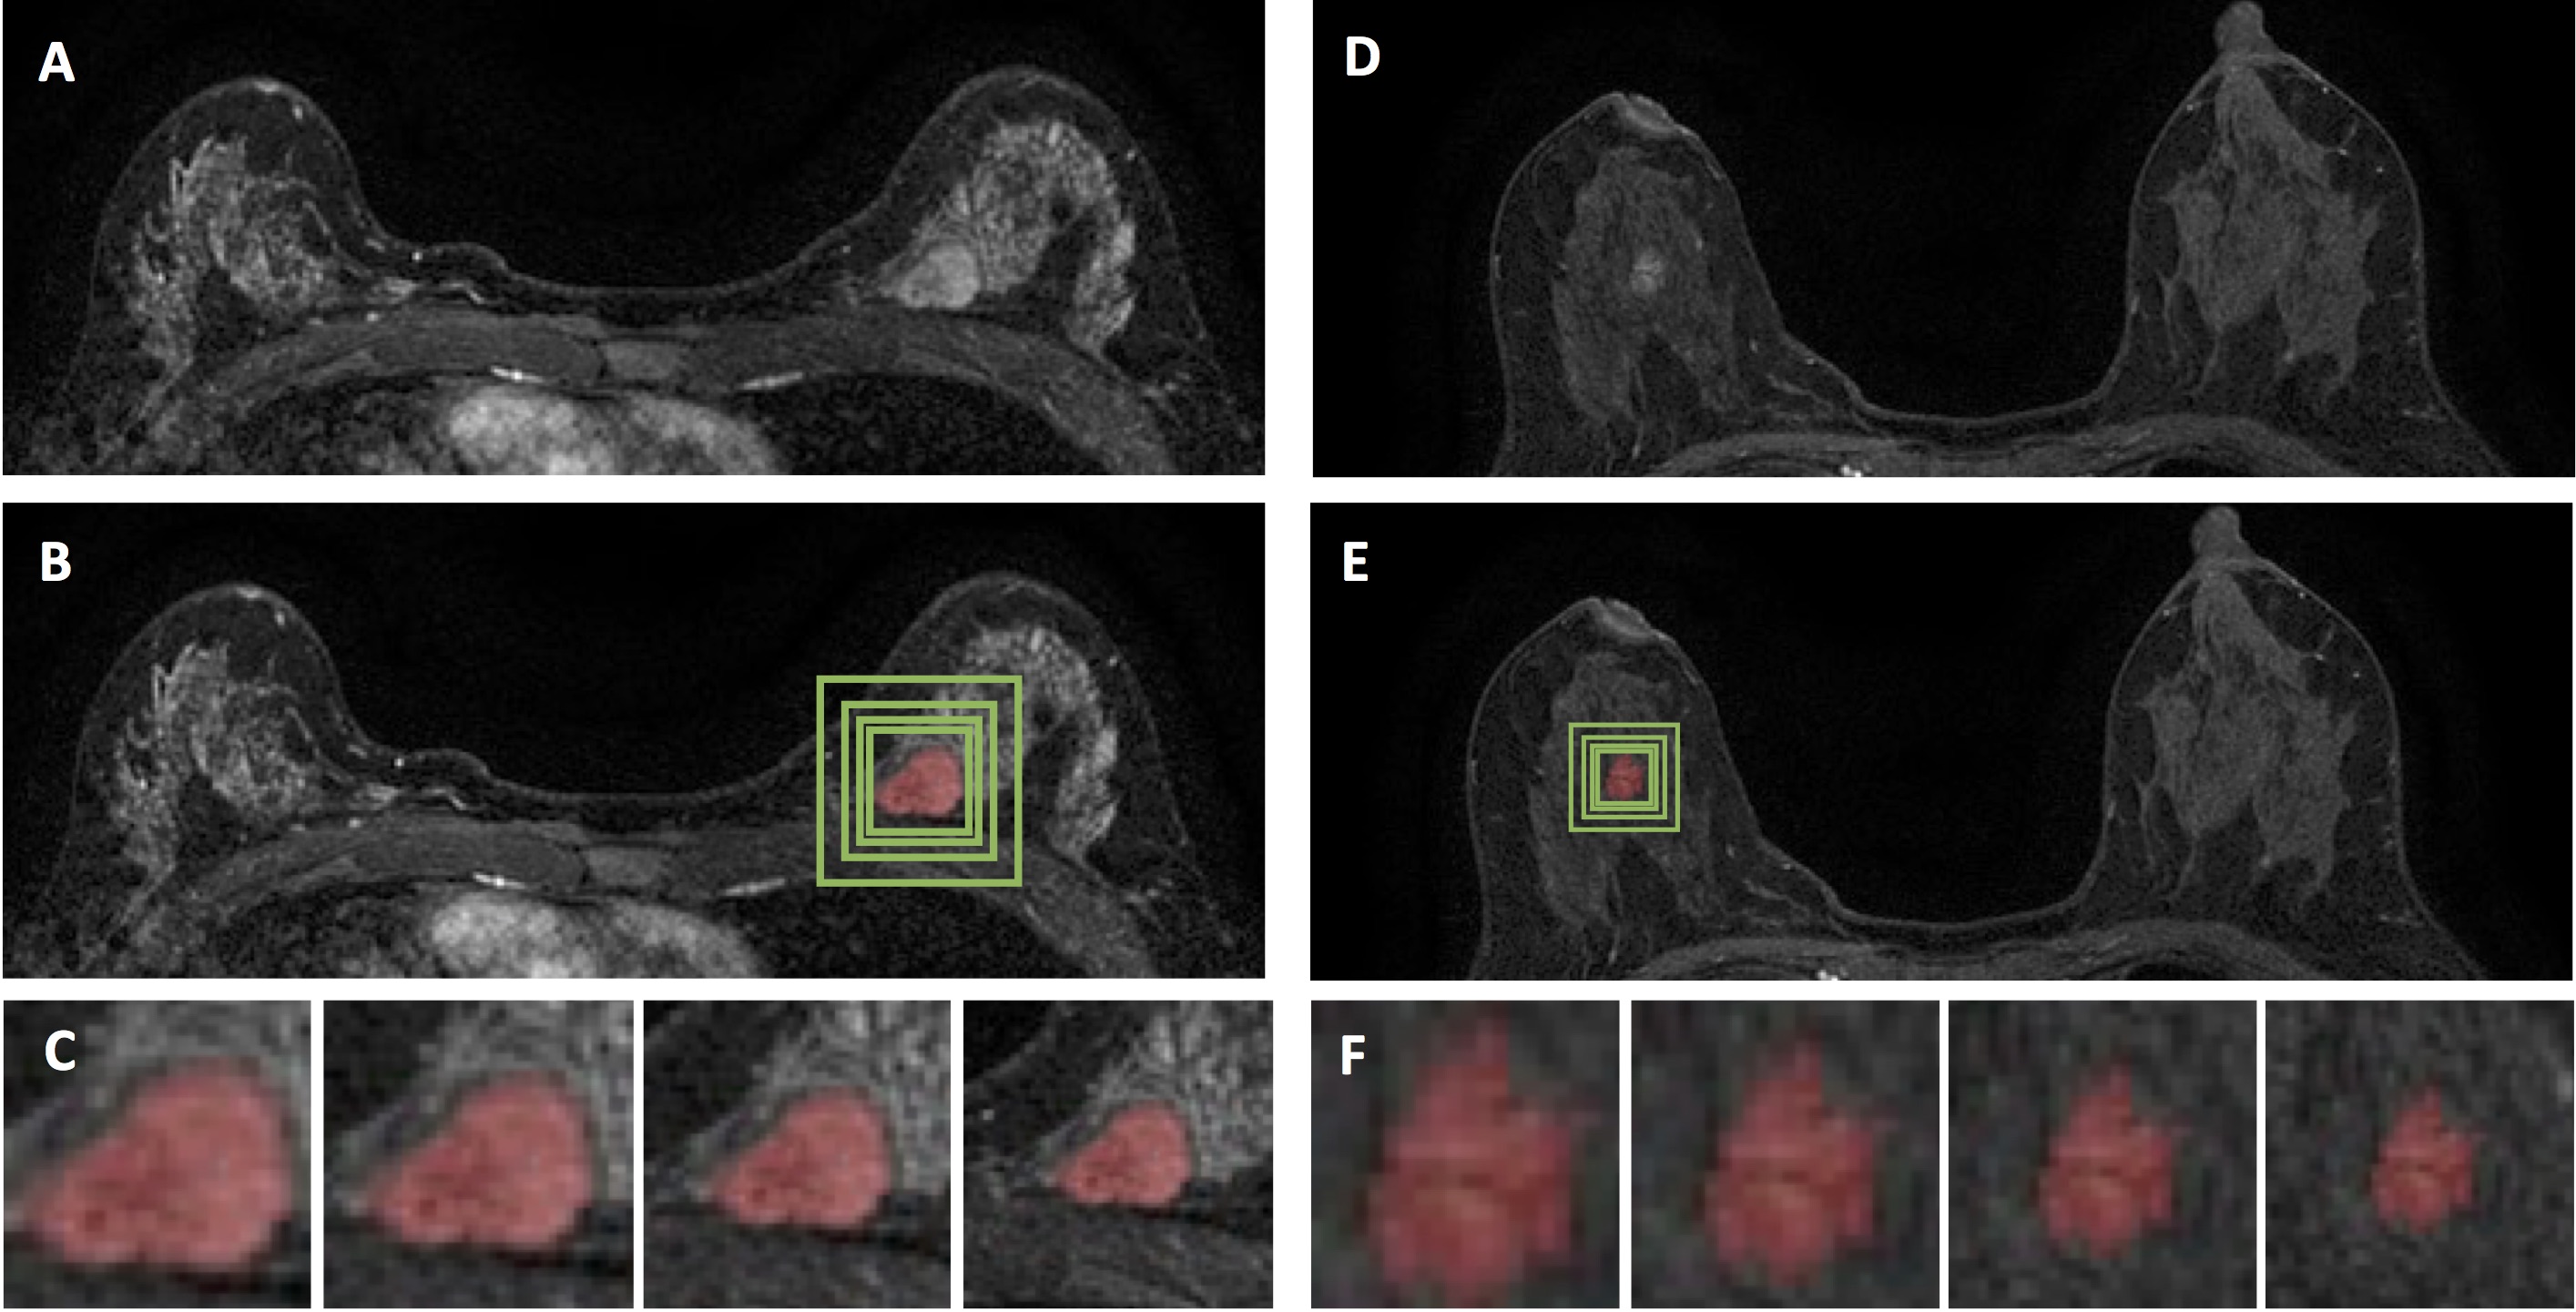
Figure 1: (A-C) A fibroadenoma showing
smooth boundary. (A) The F3 post-contrast image. (B) Green boxes are the
smallest square, 1.2, 1.5, and 2 times larger boxes.
(C) The zoom-in images showing
tumor with different amount of peri-tumor tissues. The predicted malignancy
probability is 0.47 for ROI-model, 0.08 for radiomics, 0.10 for ROI+radiomics,
0.29 for per-slice CNN, 0.37 for per-lesion CNN (all correct). (D-F) A fibroadenoma showing indistinct boundary. The predicted malignancy probability is 0.28, 0.02, 0.02, 0.29, and 0.29, respectively (all correct).
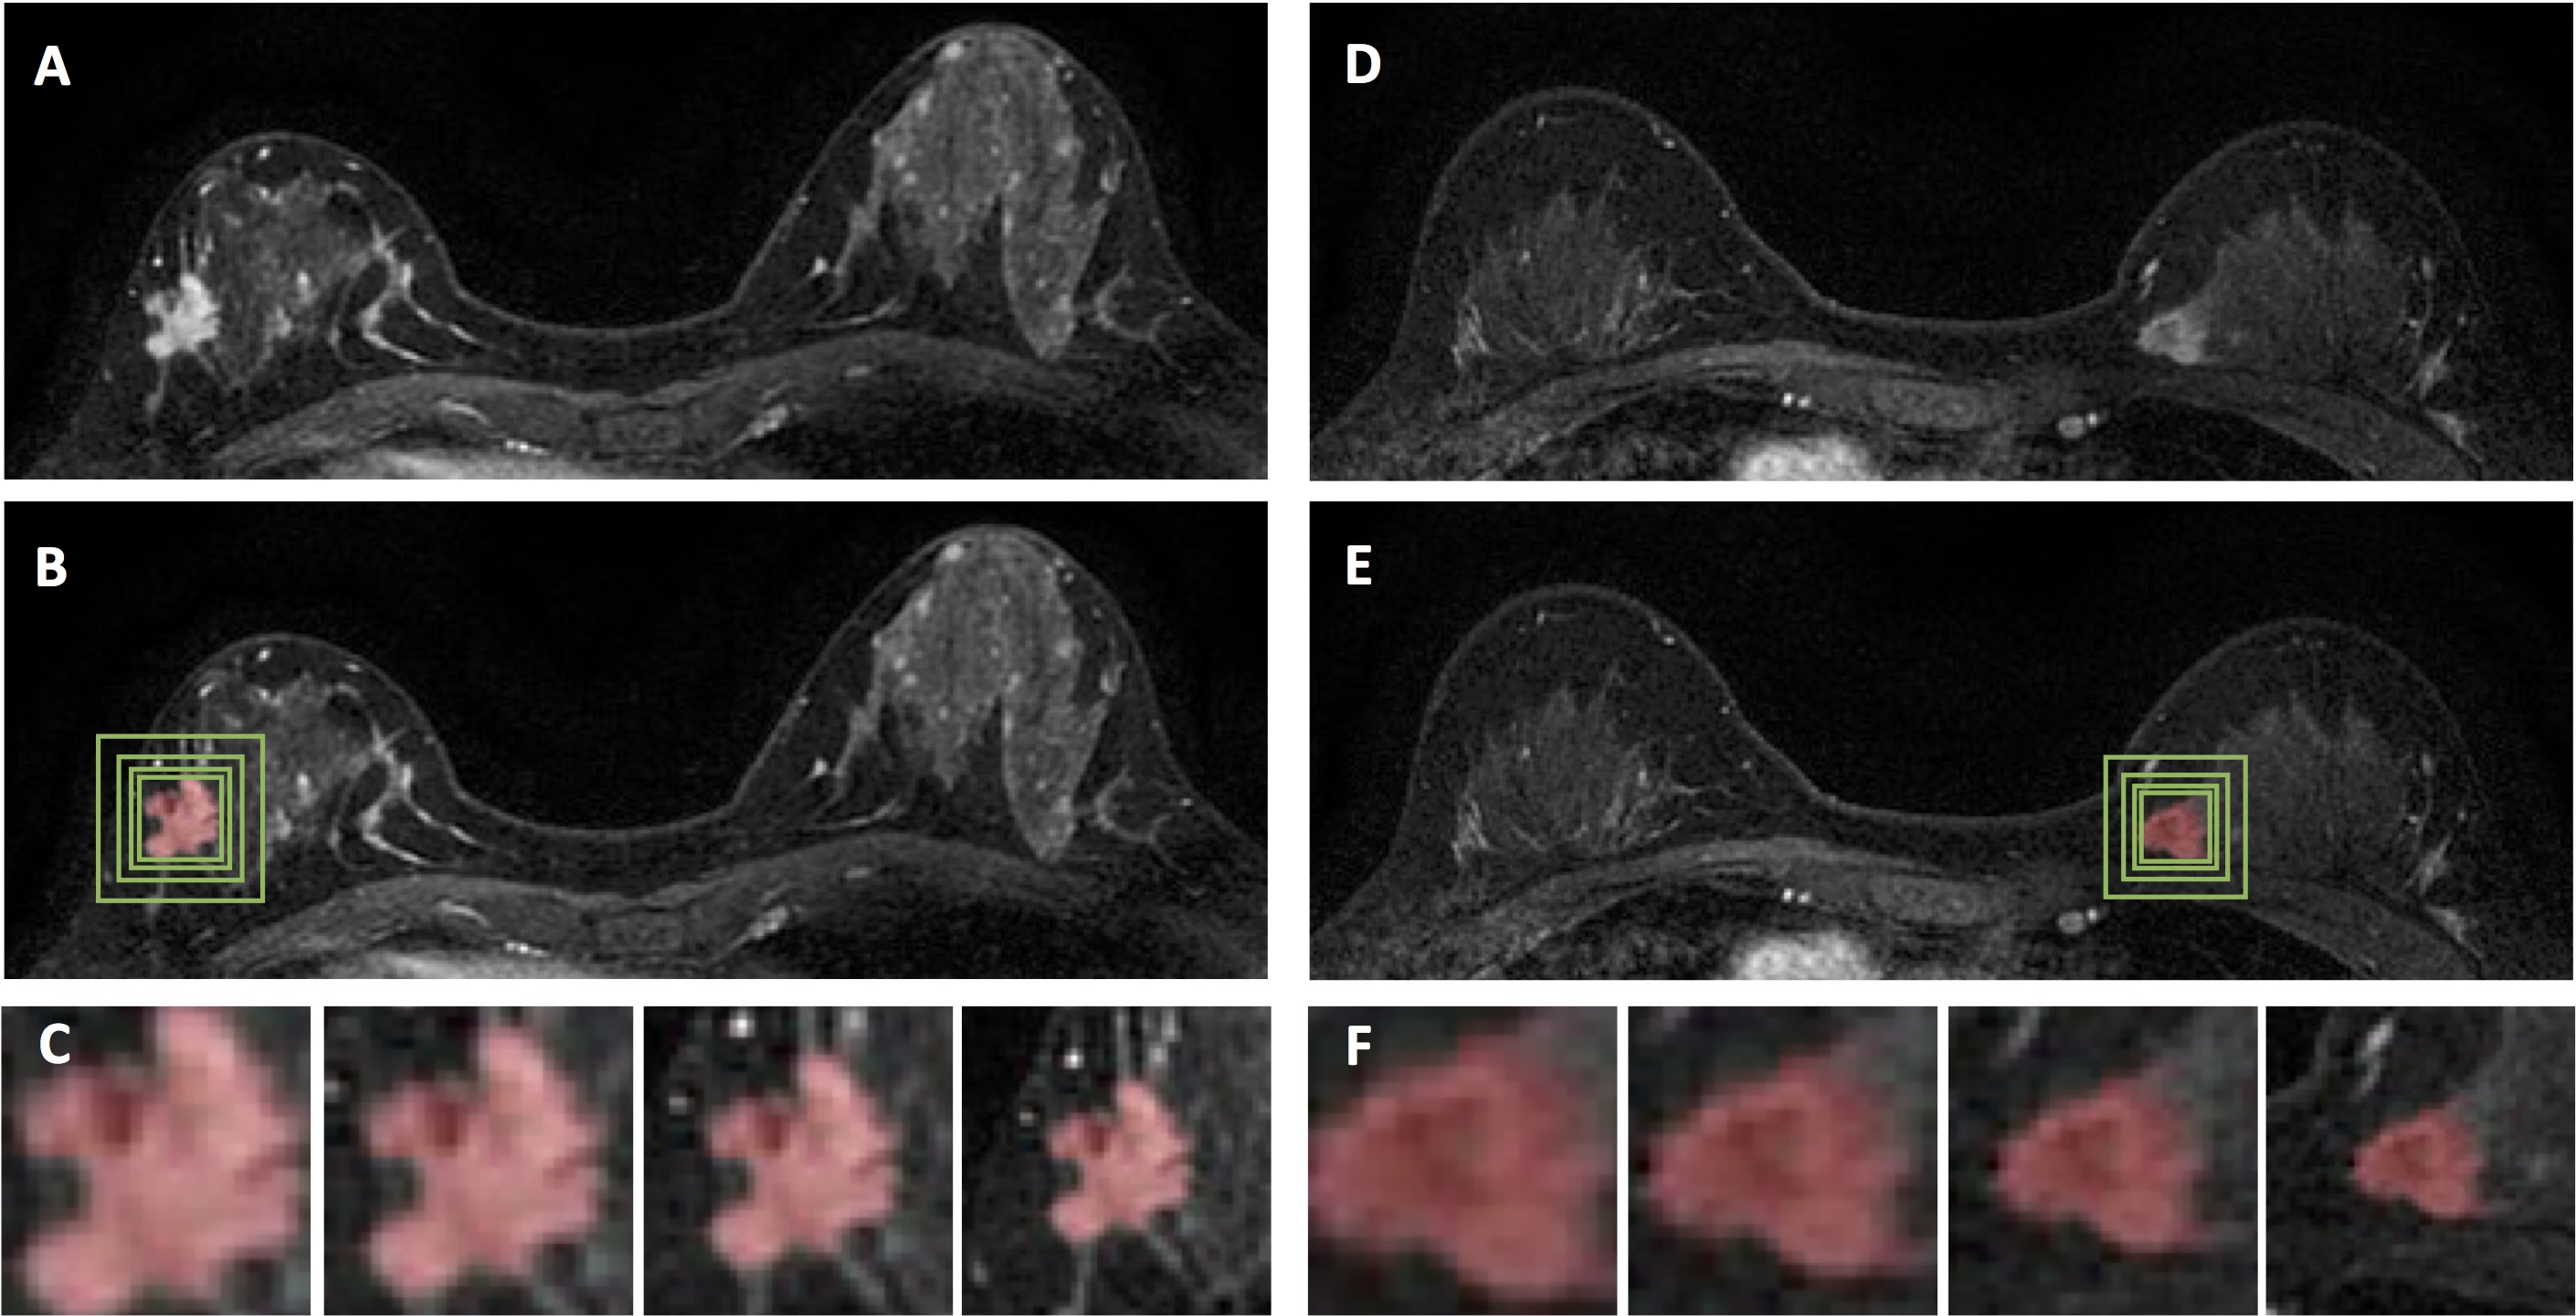
Figure 2: (A-C) An invasive
ductal cancer showing spiculated margin. (A) The F3
post-contrast image. (B) Green boxes are the
smallest square, 1.2, 1.5, and 2 times larger boxes. (C)The zoom-in images showing tumor with different amount of
peri-tumor tissues. The predicted malignancy probability is 0.61 for ROI-model,
0.89 for radiomics, 0.90 for ROI+radiomics, 0.98 for per-slice CNN, 0.98 for
per-lesion CNN (all correct). (D-F) An invasive
ductal cancer with a clear boundary. The predicted malignancy
probability is 0.41, 0.29, 0.38, 0.83, 0.99, respectively (partially correct).
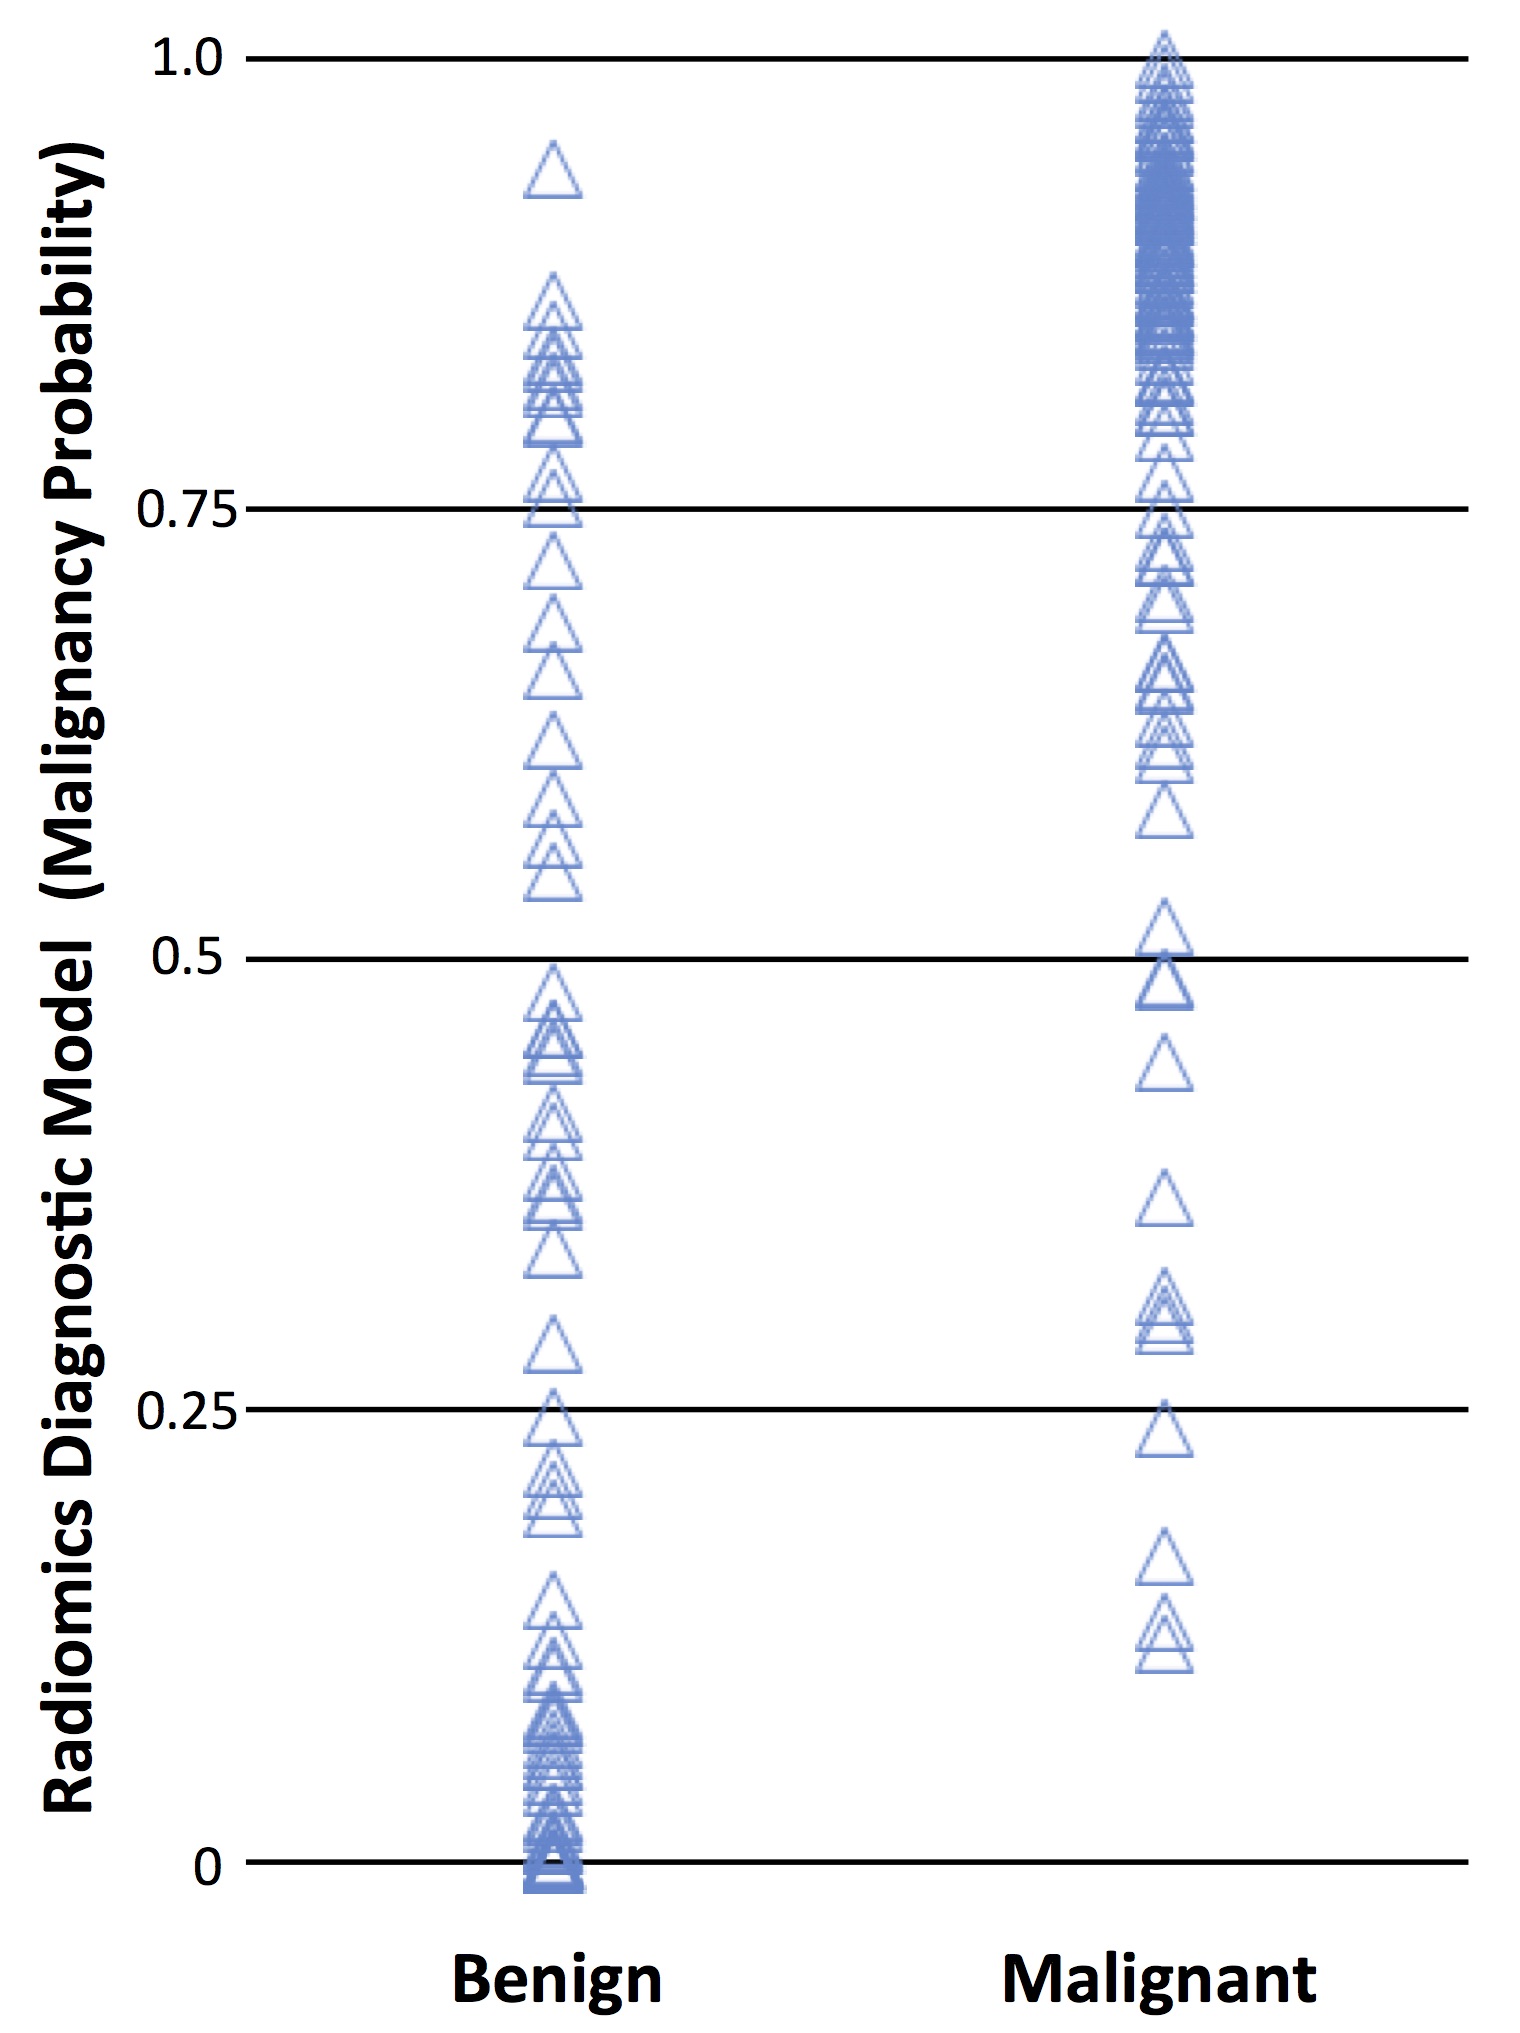
Figure 3: The
plot of the malignancy probability calculated using the radiomics diagnostic
model in the malignant and benign lesion groups. Based on the threshold of 0.5,
the overall diagnostic accuracy is 84%. Of the total of 91 malignant and 62
benign cases, True Positive = 83 cases, True Negative = 45 cases, False
Negative = 8 cases, False Positive = 17 cases.
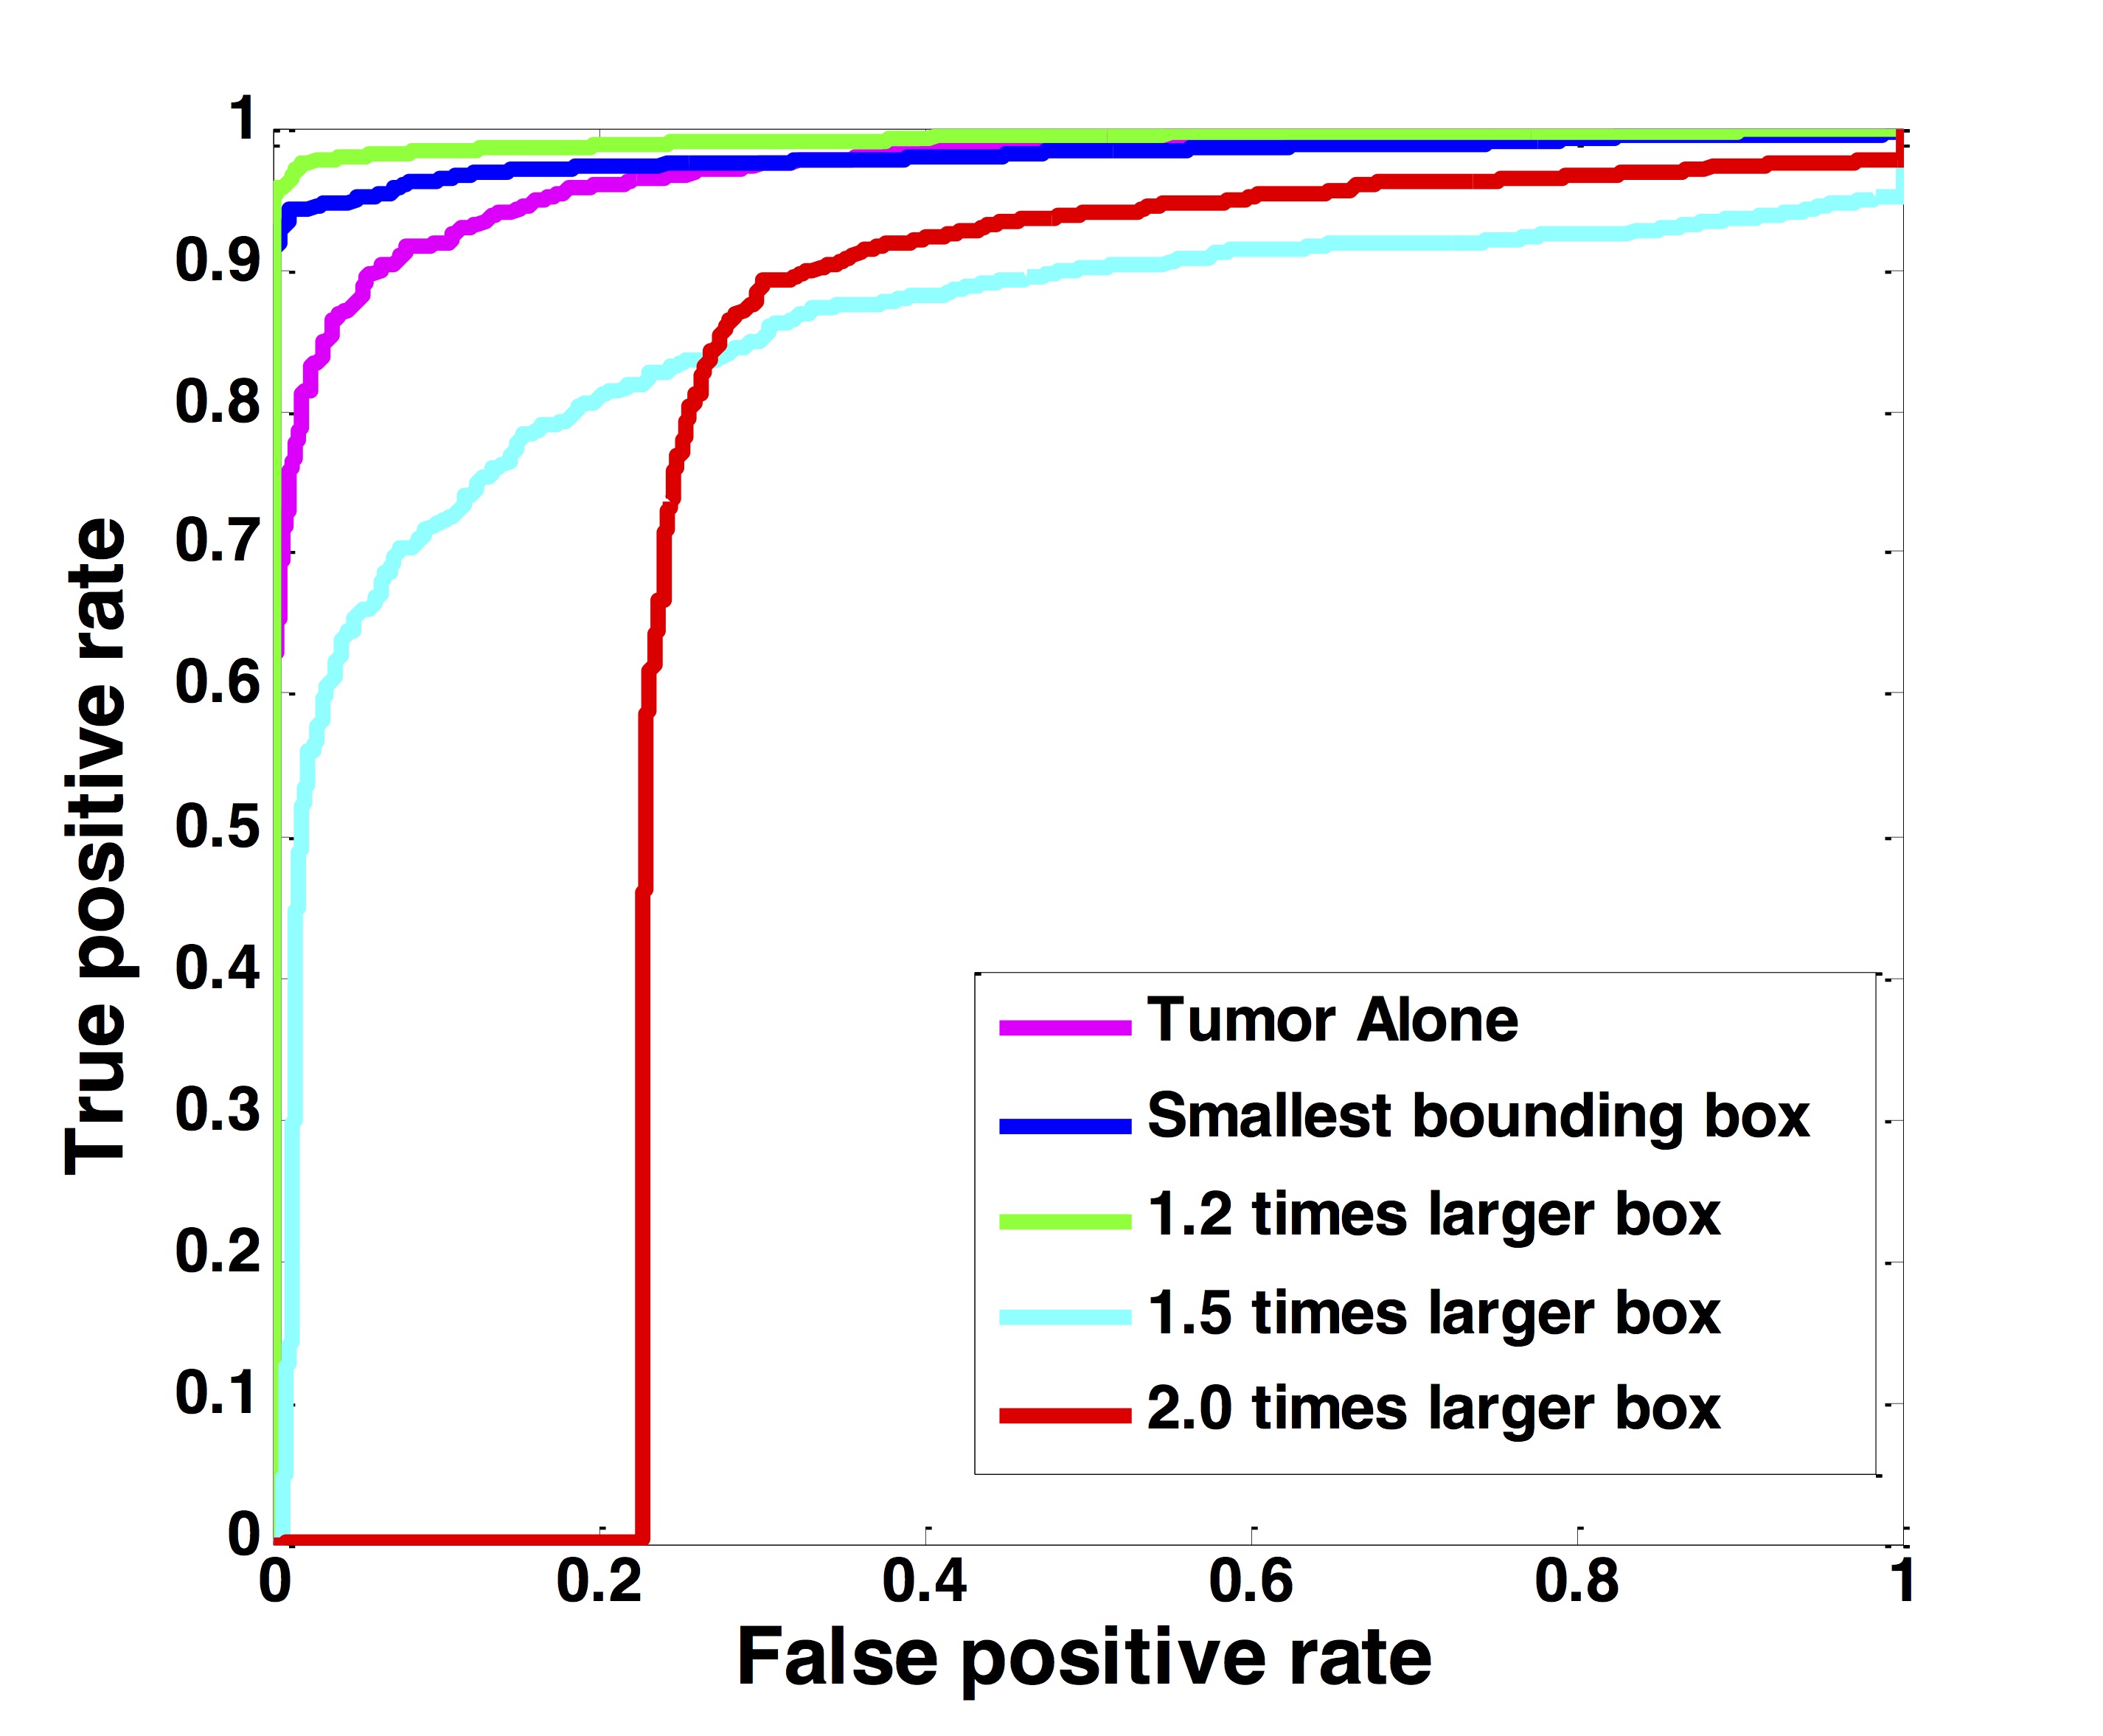
Figure 4: The
ROC curves generated by using the predicted per-slice malignancy probability of
the entire training dataset using ResNet50, with 5 different input methods:
tumor alone, smallest bounding box, 1.2, 1.5, and 2.0 enlarged boxes.
Table
1: The
diagnostic sensitivity, specificity and the overall accuracy using models built
by ROI-based volume and DCE parameters, radiomics, and ResNet50 deep learning,
with a fixed threshold of malignancy probability=0.5.