0565
Fast Quantitative Multiparametric Mapping using 3D-EPI with Segmented CAIPIRINHA Sampling at 3T1German Center for Neurodegenerative Diseases (DZNE), Bonn, Germany, 2Department of Physics and Astronomy, University of Bonn, Bonn, Germany
Synopsis
By comparison to a gold standard multiparametric mapping (MPM) protocol at 3T, this study shows that multi-echo 3D-EPI with highly segmented CAIPIRINHA sampling can yield whole-head T1, PD*, MTsat and R2* maps of high quality at 1mm isotropic resolution in less than 3 minutes scan time. Even less than 1 minute of single-echo 3D-EPI is sufficient to yield accurate quantitative T1, PD* and MTsat maps. If necessary, SNR can be improved by including repeated EPI measurements. Optional motion- and distortion-correction across measurements may further improve results. Motion-robust MPM thus renders assessing quantitative parameter maps in clinical or population studies feasible.
Introduction
Multiparametric mapping (MPM) provides quantitative maps of T1, effective proton density (PD*), magnetization transfer (MTsat) and T2* based on multi-echo (ME) T1w, PDw, and MTw images typically acquired using a 3D fast low angle shot (FLASH) sequence1. Highly segmented 3D ME Echo Planar Imaging (EPI) can be applied like ME-FLASH with an EPI factor to reduce acquisition time (TA). It can provide longer TEs at higher signal-to-noise ratio efficiency (SNR/√TA) and decreased motion sensitivity2. Our study investigates whether such a 3D-EPI approach with CAIPIRINHA3 sampling is suitable for MPM.Methods
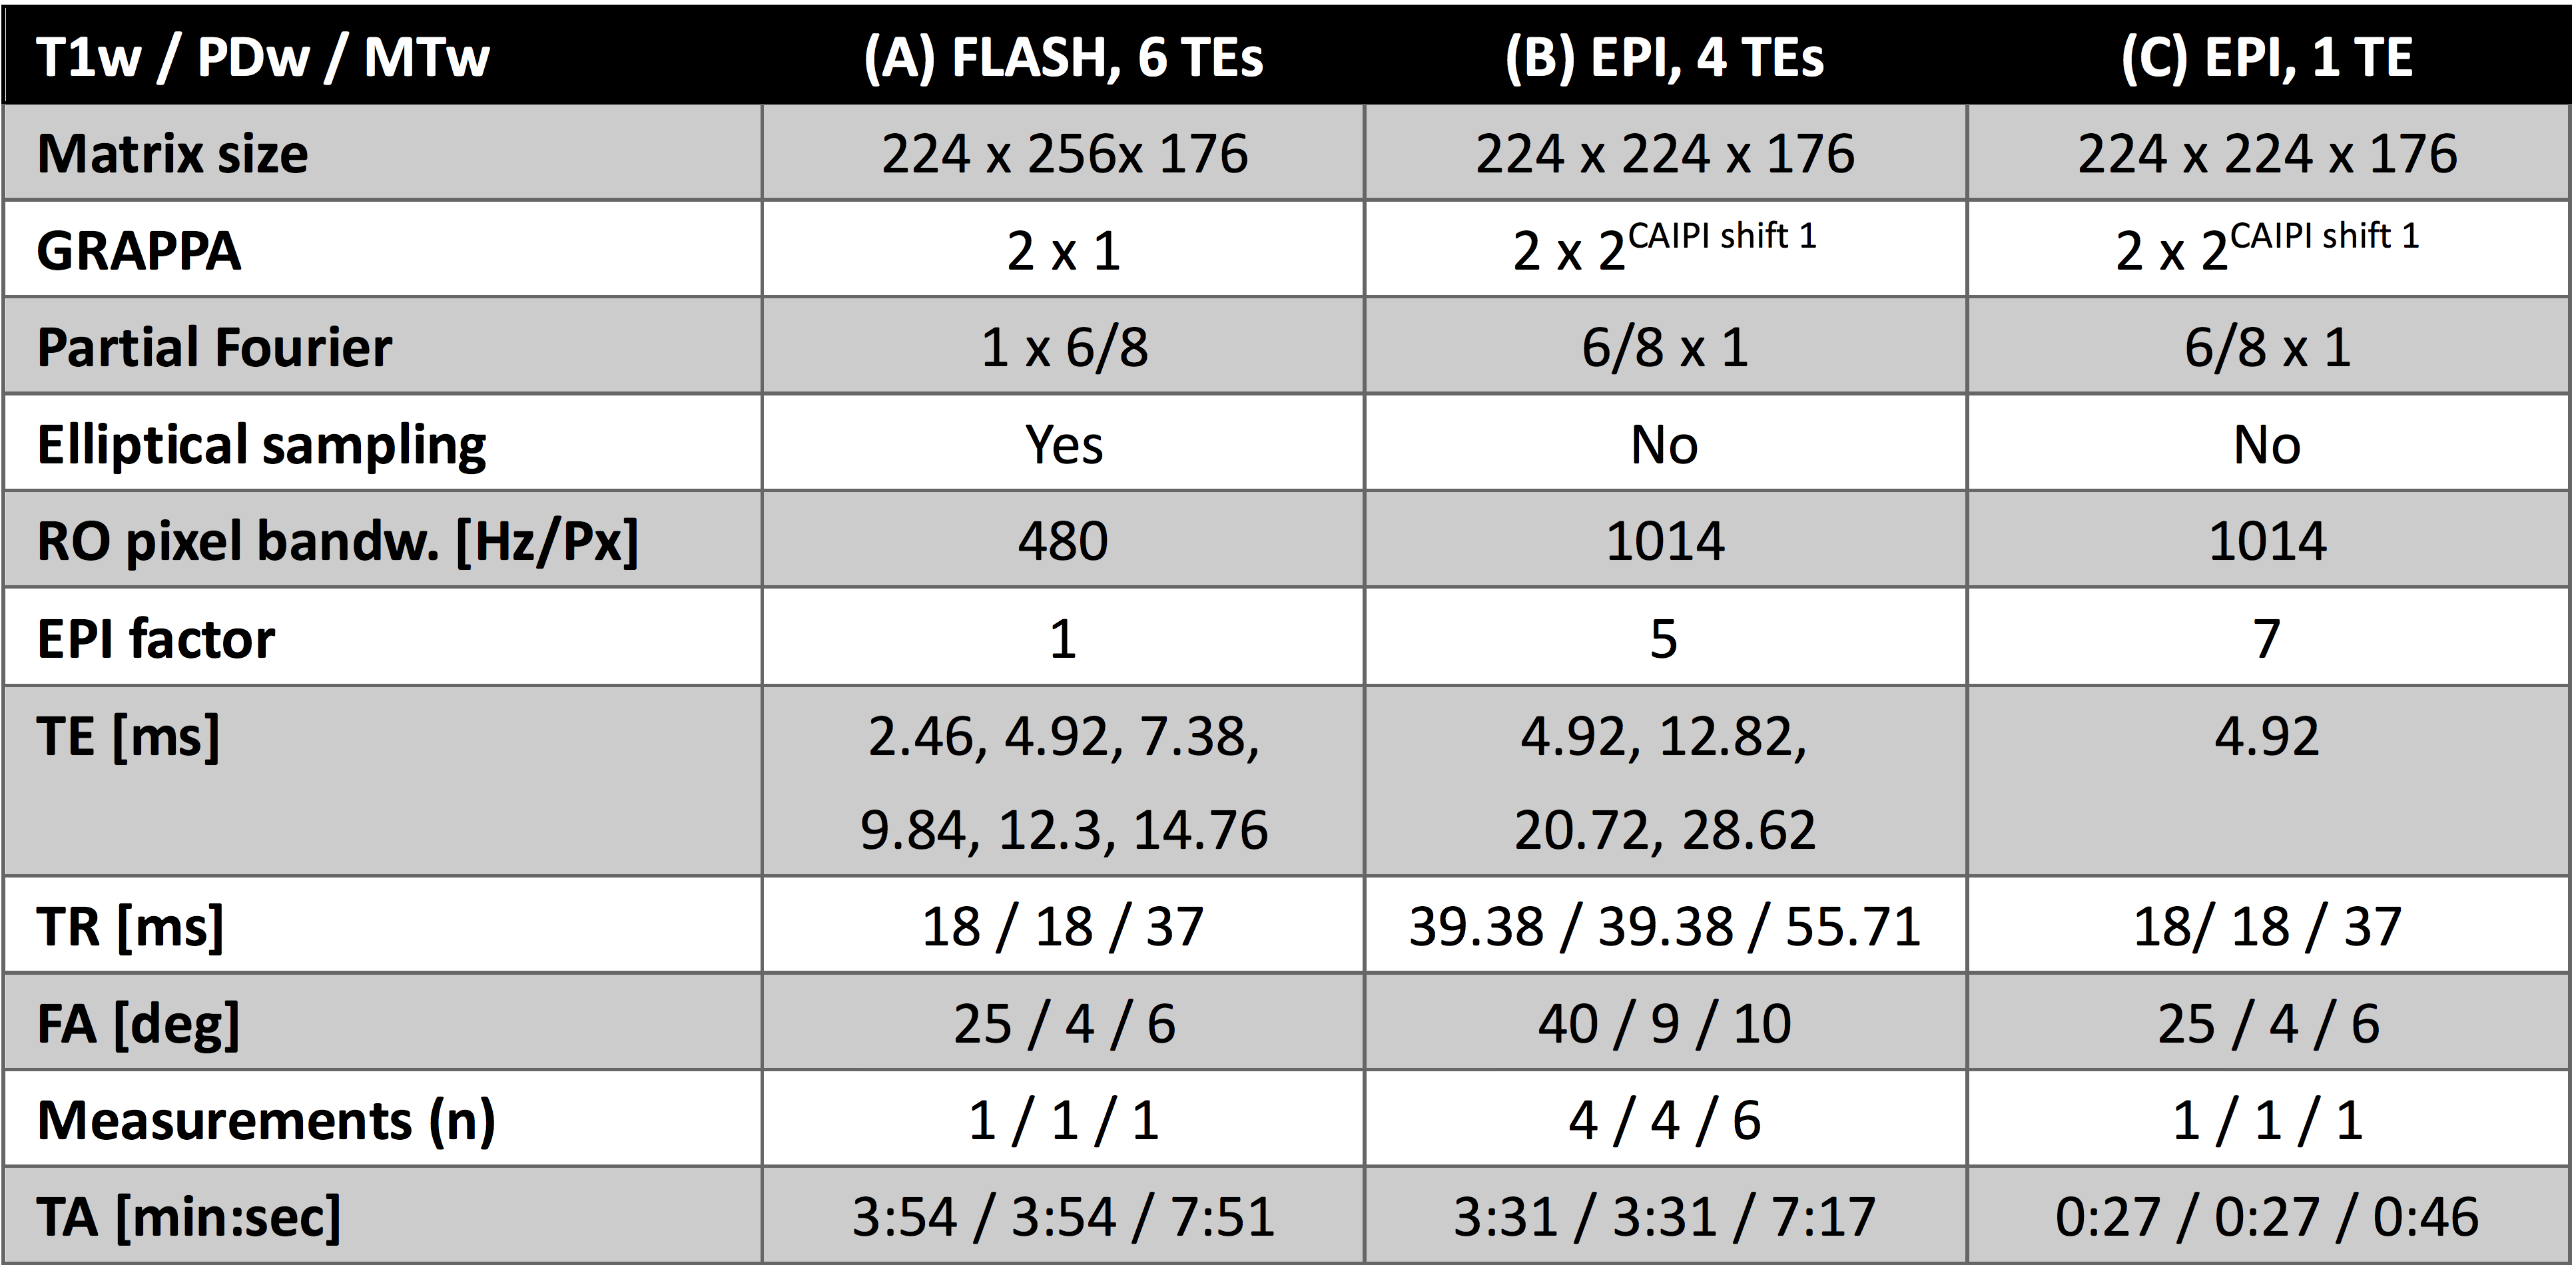
All images were acquired on a Siemens (Healthineers) Skyra 3T system using a 32 channel head receive coil. T1w, PDw and MTw images were acquired using whole-head ME-FLASH protocols as recommended by Callaghan et al. (vendor sequence) with 6 TEs up to 14.76ms at 1mm isotropic interpolated resolution4,5 (experiment A). Corresponding ME-EPI scans with 4 TEs up to 28.62ms were acquired with repeated measurements (n=4-6) to approximate the respective FLASH TAs (experiment B). A prolonged excitation pulse (~2.4ms) was used for fat suppression6. Finally, single-TE EPI scans were acquired that allowed for TR and flip angles (FA) matched to the FLASH experiment (experiment C). Each EPI scan included 10s of preparation time (external phase correction2, steady-state “dummies”, 36x36 FLASH autocalibration scans (ACS)7). All MPM imaging parameters are summarized in Tab. 1. Additionally, a fast 3D-EPI-based Look-Locker (LL) scan8 with otherwise identical image parameters was acquired in 13 minutes for T1 estimation (TE=4.2ms, TR=16.0ms, EPI factor=5, turbo factor=16, 18 TIs between 143 and 4495 ms, FA=7°, 2 averages).Multiparametric maps were calculated within the hMRI toolbox9. A 3DREAM B1+ map, acquired at 4mm isotropic resolution (TA=6.9s)10 was utilized for flip angle correction in MPM and for Look-Locker T1. A simultaneously acquired B0 map was used to account for reduced off-resonant flip angles according to Freed et al.11.
Results
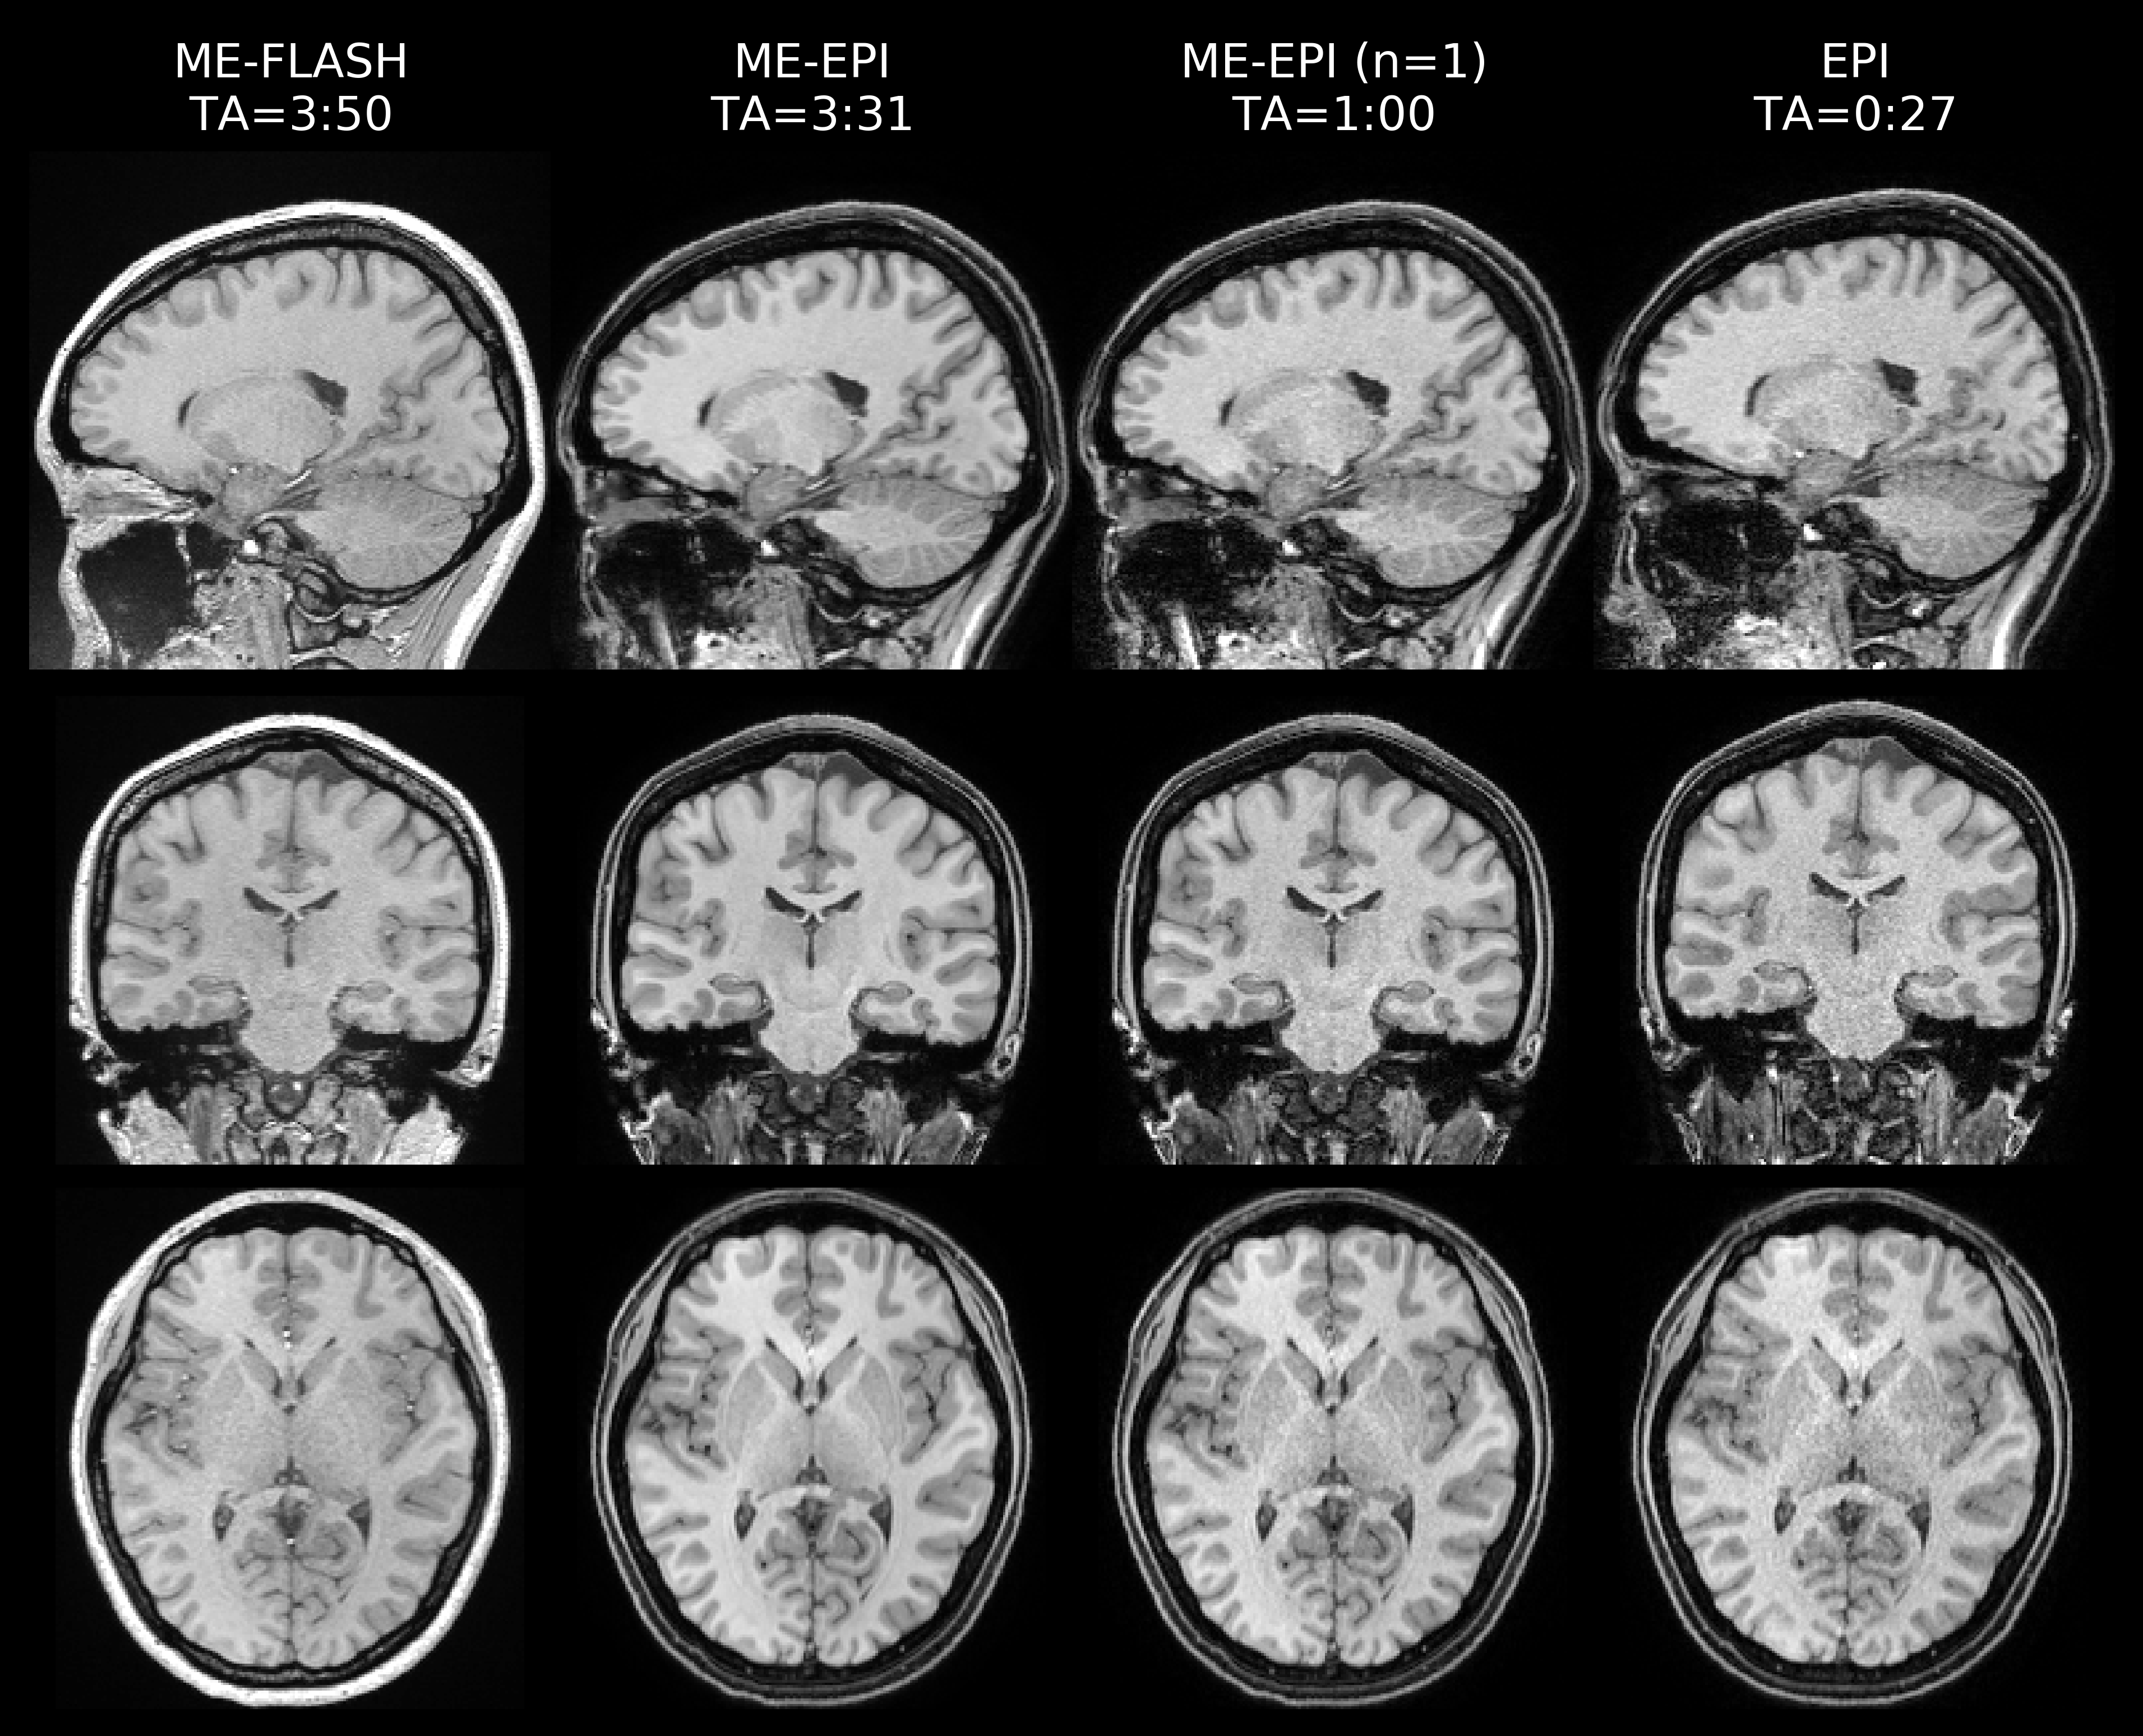
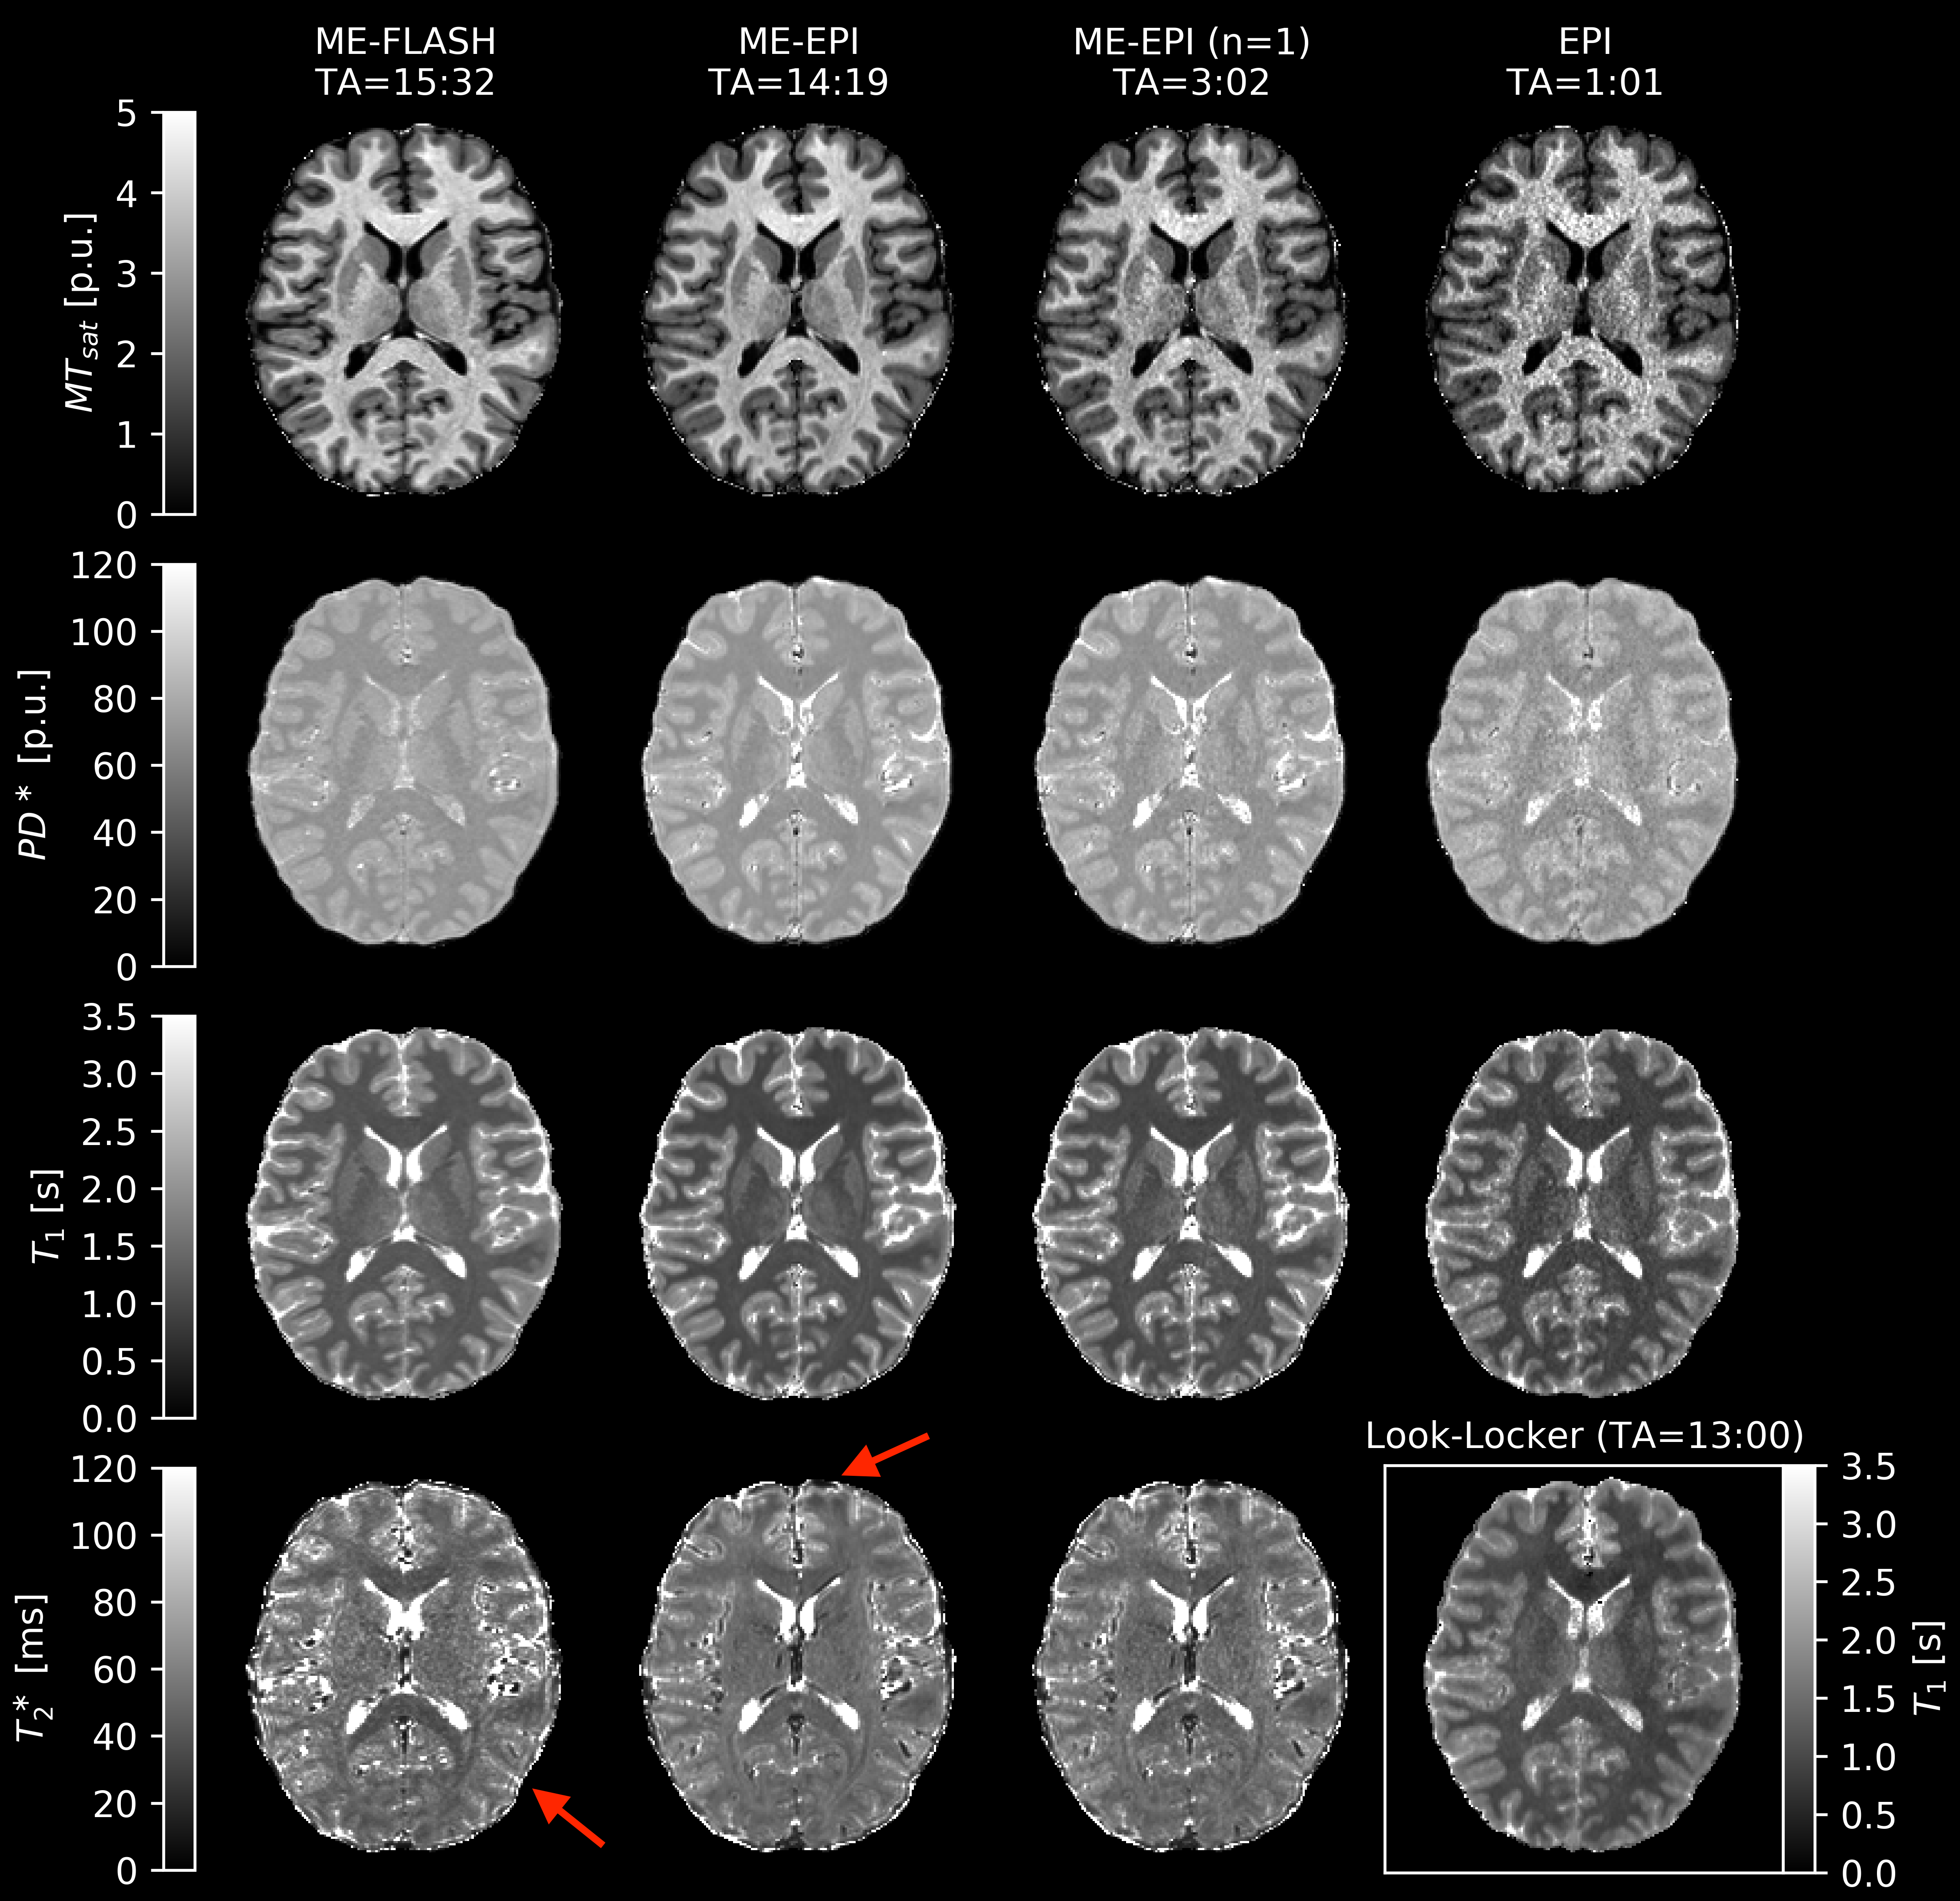
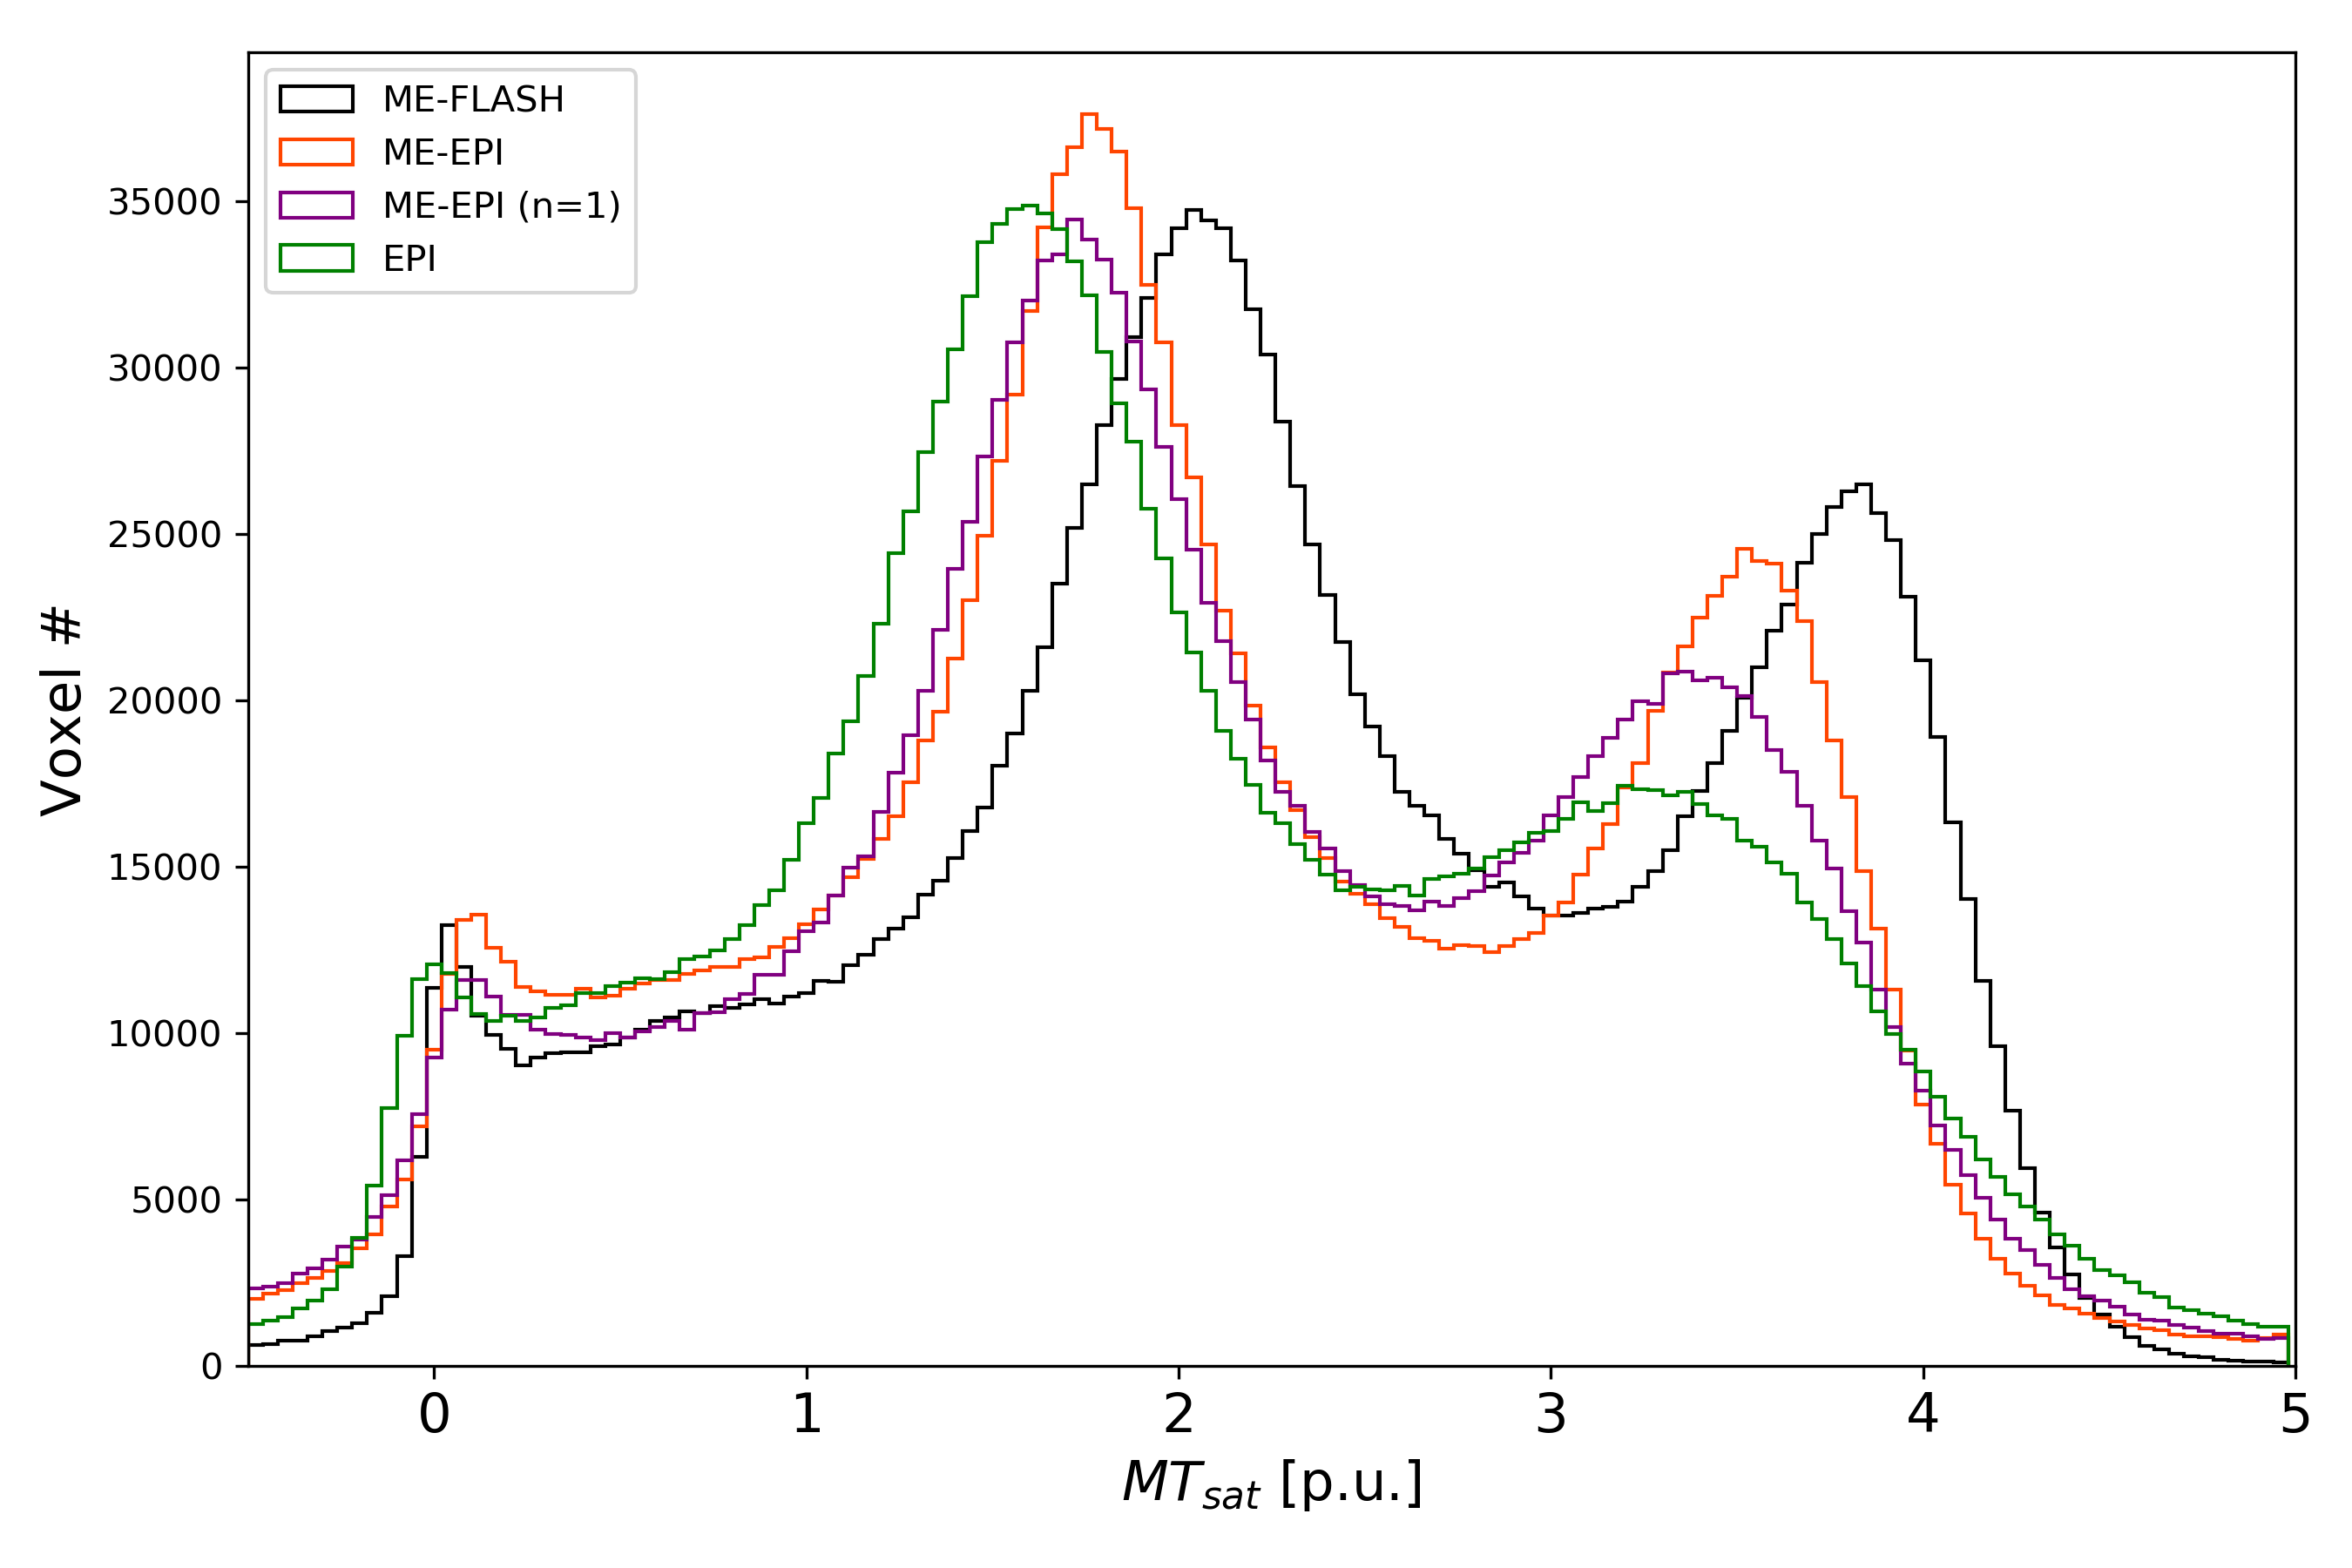
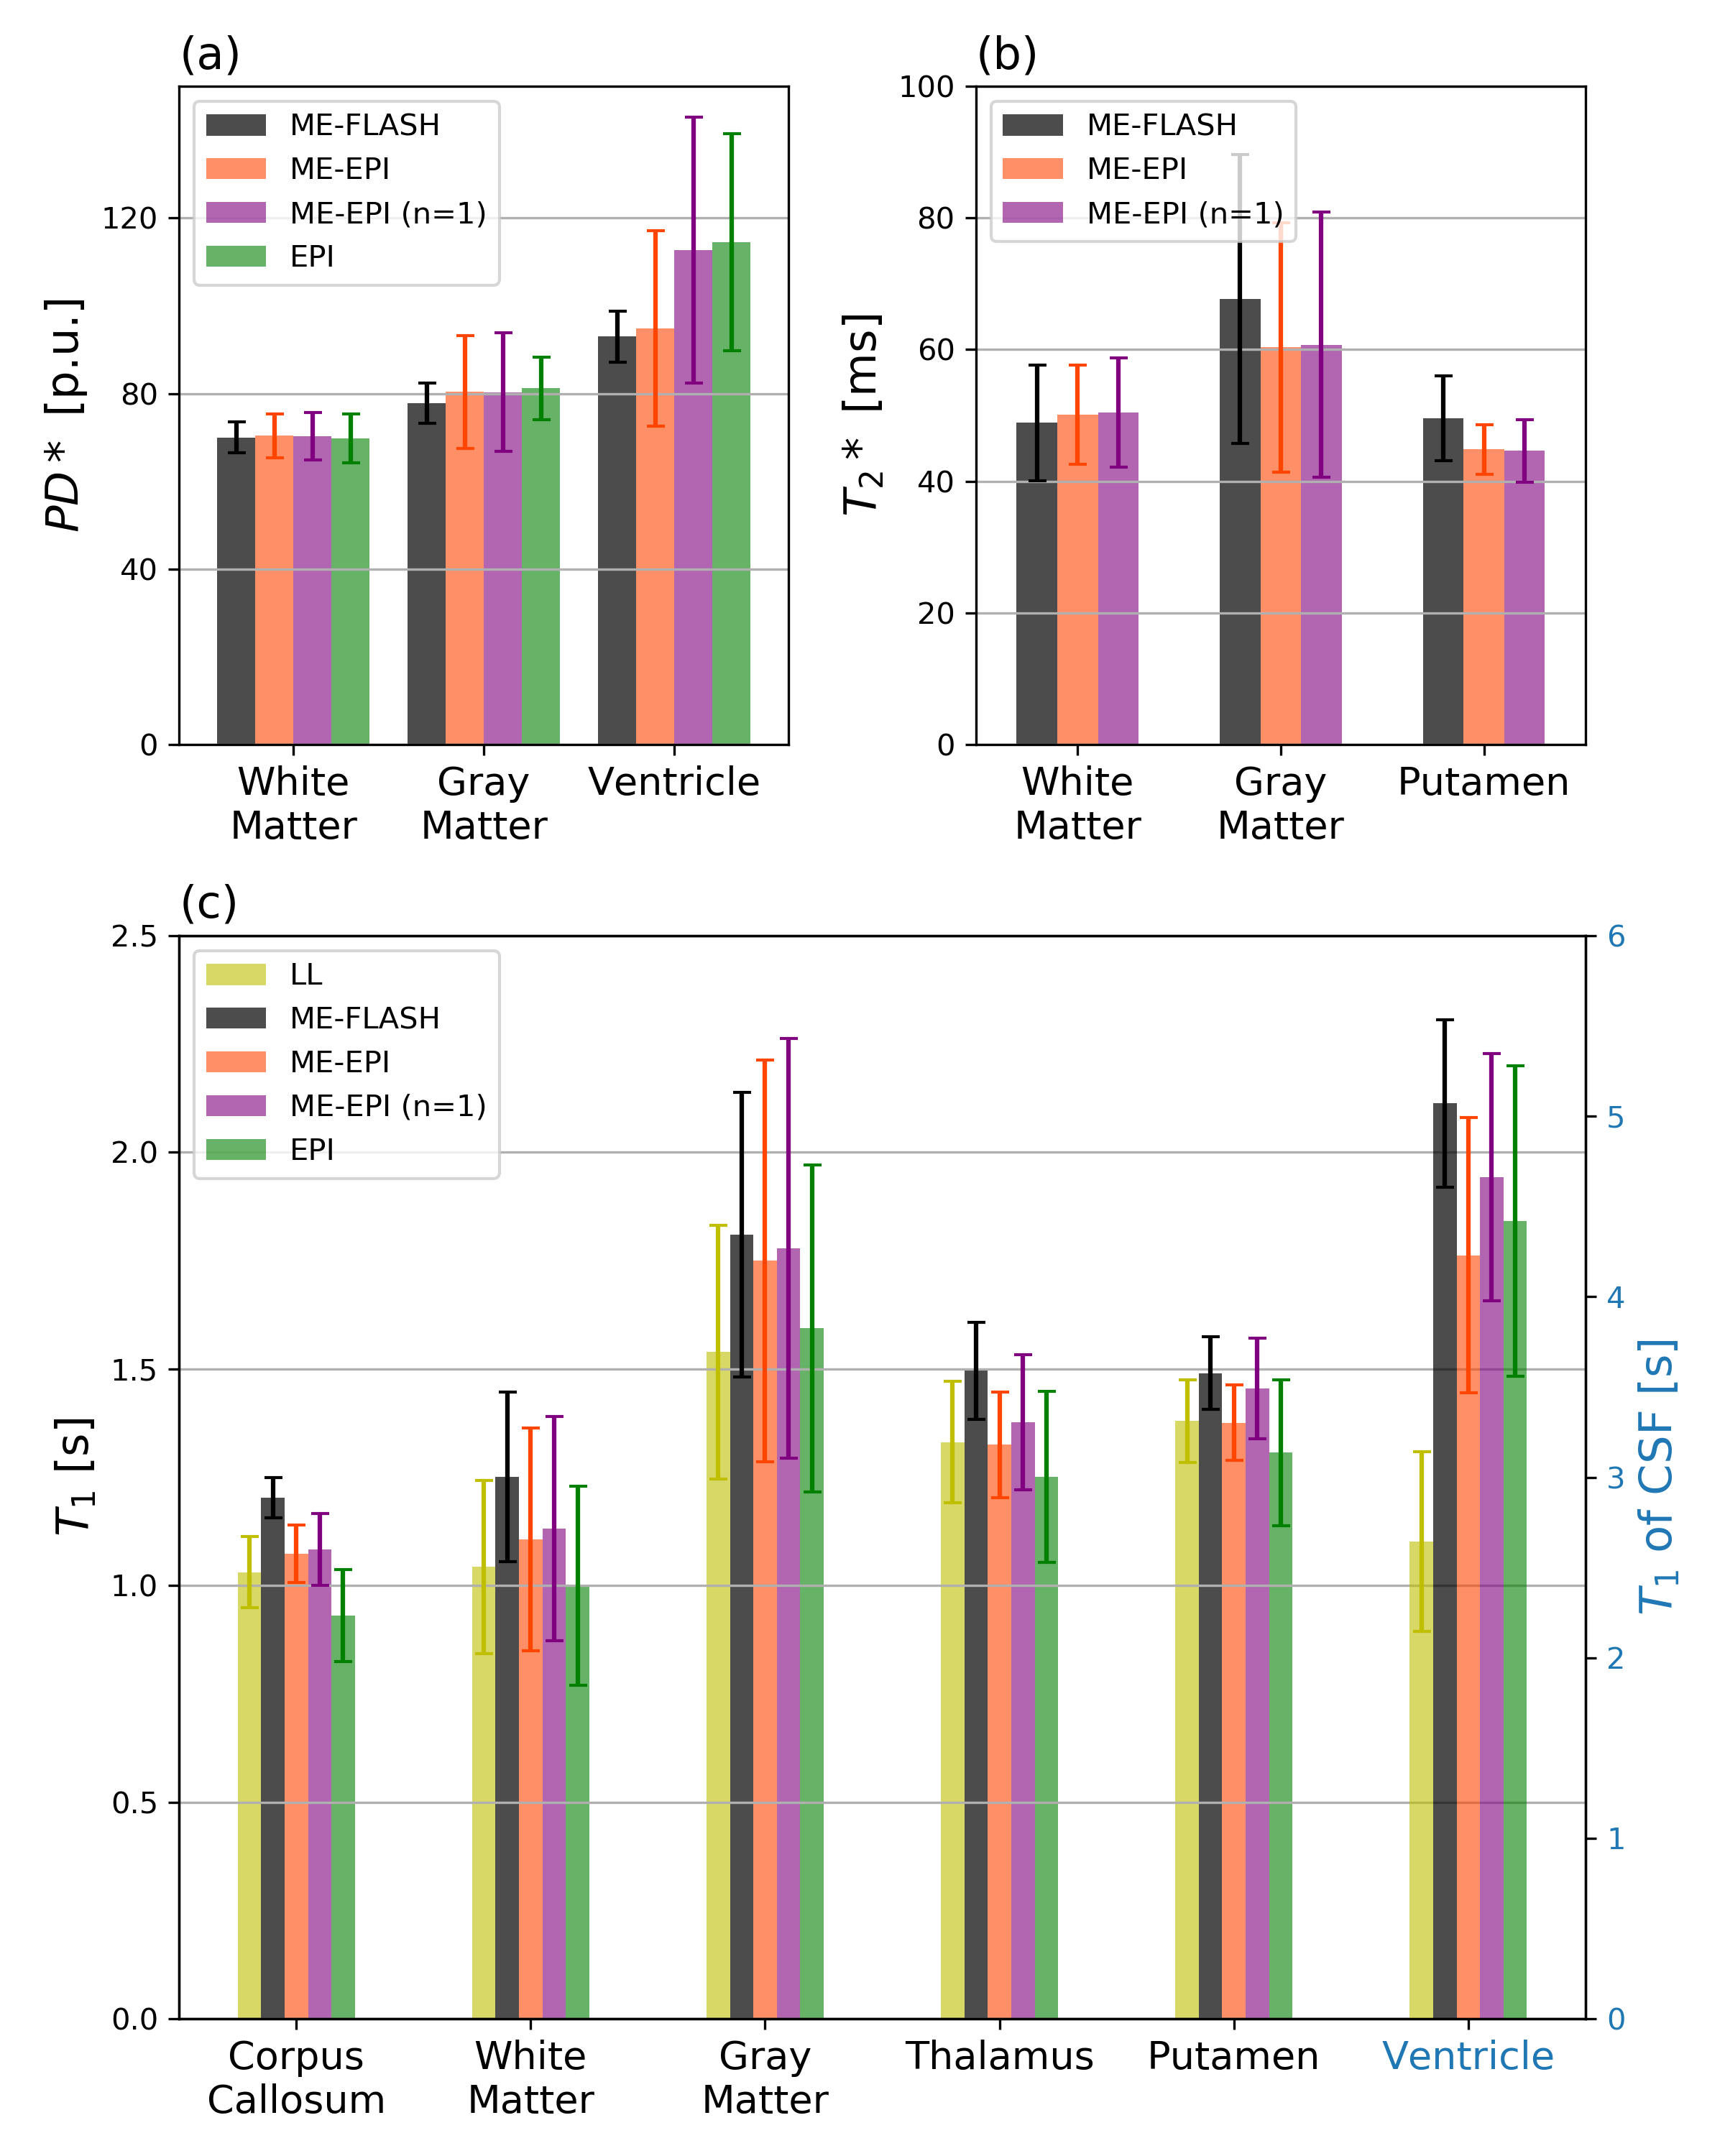
Fig. 1 shows representative sagittal, coronal and axial slices of all T1w scans at TE=4.92ms. Fig. 2 shows corresponding multiparametric maps. TA-matched ME-EPI results in superior quality compared to FLASH, while overall the estimated T1 appears smaller. Notably, more ventricle (CSF) voxels exceed 100 p.u. in the EPI PD* maps. The T2* map is clearly improved with ME-EPI (reduced ringing and noise) except for frontal brain regions, where magnetic susceptibility gradients are strong. A single ME-EPI measurement per contrast (n=1) leads to noisier but accurate MT, PD* and T1 maps. T2* is still largely superior to FLASH. Fig. 3 shows whole-brain histograms of MTsat with clear modes for CSF/WM/GM. The FLASH histogram is shifted towards higher values and the peaks of ME-EPI (n=1) are wider than of TA-matched ME-EPI. However, all scans result in the expected 0:1:2.2 ratio of MTsat modes12. Fig. 4 shows bar plots of PD* (a), T2* (b) and T1 (c) in different regions of interest (ROI) from different scans (including LL-T1). Fig. 5 (a,b) confirm overall agreement across scans except for increased EPI PD* estimates in the ventricles. In CSF, LL underestimates T1 (lacking sufficiently long TIs). In all other ROIs, there is a greater T1 agreement between EPI and LL than between FLASH and LL.Discussion
Our study has shown that 1mm isotropic multi-echo T1w, PDw and MTw measurements, altogether acquired in only 3 minutes using 3D-EPI, are sufficient to estimate high quality T1, PD*, MTsat and R2* maps. A high readout bandwidth combined with high segmentation assures minimal geometric distortions. Scan time could even be further reduced without sacrificing SNR, e.g. by sharing one set of ACS. If necessary, SNR can be improved by including repeated EPI measurements, potentially varying across contrasts. This provides superior parameter maps and the option of motion- and distortion-correction across measurements, as recently shown for QSM and T2*2.Overall, we observed slightly higher T1 results with FLASH MPM compared to all EPI MPM and the Look-Locker reference. Increased TR and FA for ME-EPI does not appear to conflict with the “short-TR” and “small-FA” approximations of MPM13. A violation should result in increased T1 estimates. Although not observed here, the effect might be present but masked by another systematic difference between FLASH and EPI. We observed smaller MTsat values with EPI MPM. This may be due to empirically set MT flip angles12. Also, we find that PD* estimates tend to exceed 100 p.u. in CSF when using EPI. Future investigations will explore how MPM parameters depend on excitation bandwidth (long water excitation pulse), larger TRs and FAs (MPM approximations), increased susceptibility artifacts, and physiological noise in EPI MPM.
Conclusion
By comparison to a gold standard MPM protocol at 3T we have validated that 3D-EPI with segmented CAIPIRINHA sampling yields quantitative multiparametric maps of high quality in short scan time. Accurate whole-head maps at 1mm isotropic resolution can be obtained from T1w, PDw and MTw multi-echo 3D-EPI scans acquired in less than 3 minutes. If T2* can be sacrificed, even less than 1 minute of single-echo 3D-EPI is sufficient to yield accurate quantitative T1, PD* and MTsat maps. Motion-robust MPM renders assessing quantitative parameter maps in clinical or population studies feasible, where they offer great potential as biomarkers, e.g. for neurodegenerative diseases.Acknowledgements
No acknowledgement found.References
1 Weiskopf N, Suckling J, Williams G, Correia MM, Inkster B, Tait R et al. Quantitative multi-parameter mapping of R1, PD*, MT, and R2* at 3T: a multi-center validation. Frontiers in Neuroscience 2013;7(June):95.
2 Stirnberg R, Deistung A, Reichenbach J, Stöcker T. Accelerated quantitative susceptibility and R2* mapping with flexible k-t-segmented 3D-EPI. In: Proceedings of the International Society of Magnetic Resonance in Medicine, 2018.
3 Breuer FA, Blaimer M, Mueller MF, Seiberlich N, Heidemann RM, Griswold MA et al. Controlled aliasing in volumetric parallel imaging (2D CAIPIRINHA). Magnetic Resonance in Medicine 2006;55(3):549–56.
4 Callaghan MF, Lutti A, Ashburner J, Balteau E, Corbin N, Draganski B et al. Example dataset for the hMRI toolbox. Data in Brief 2019;25:104132.
5 Callaghan MF, Lutti A, Ashburner J,
Balteau E, Corbin N, Draganski B et al.
MPM_protocol_vendor_seq_SIEMENS_settings.pdf. https://hmri-group.github.io/hMRI-toolbox/#hmri-example-data-and-mri-protocol. Accessed September 9, 2019.
6 Stirnberg R, Brenner D, Stöcker T, Shah NJ. Rapid fat suppression for three-dimensional echo planar imaging with minimized specific absorption rate. Magnetic Resonance in Medicine 2016;76(5):1517–23.
7 Ivanov D, Barth M, Uludağ K, Poser BA. Robust ACS acquisition for 3D echo planar imaging. In: Proc Intl Soc Mag Reson Med 23, 2015.
8 Stirnberg R, Dong Y, Bause J, Ehses P, Stöcker T. T1 Mapping at 7T Using a Novel Inversion-Recovery Look-Locker 3D-EPI Sequence. In: Proceedings of the International Society of Magnetic Resonance in Medicine, 2019.
9 Tabelow K, Balteau E, Ashburner J, Callaghan MF, Draganski B, Helms G et al. hMRI – A toolbox for quantitative MRI in neuroscience and clinical research. NeuroImage 2019;194(January):191–210.
10 Ehses P, Brenner D, Stirnberg R, Pracht ED, Stöcker T. Whole-brain b1-mapping using three-dimensional dream. Magnetic Resonance in Medicine 2019;82(3):924–34.
11 Freed DE, Hürlimann MD, Scheven UM. The equivalence between off-resonance and on-resonance pulse sequences and its application to steady-state free precession with diffusion in inhomogeneous fields. Journal of Magnetic Resonance 2003;162(2):328–35.
12 Helms G, Dathe H, Kallenberg K, Dechent P. High-resolution maps of magnetization transfer with inherent correction for RF inhomogeneity and T1 relaxation obtained from 3D FLASH MRI. Magnetic Resonance in Medicine 2008;60(6):1396–407.
13 Helms G, Dathe H, Dechent P. Quantitative FLASH MRI at 3T using a rational approximation of the Ernst equation. Magnetic Resonance in Medicine 2008;59(3):667–72.
Figures