0558
A five-minute multi-parametric high-resolution whole-brain MR-STAT exam: first results from a clinical trial1Computational Imaging Group for MR diagnostic and therapy, Center for Image Sciences, University Medical Center Utrecht, Utrecht, Netherlands, 2Department of Radiology, University Medical Center Utrecht, Utrecht, Netherlands, 3Department of Neurosciences, University of Turin, Turin, Italy
Synopsis
MR-STAT is a recently developed technique which aims at reconstructing multi-parametric quantitative maps (T1, T2, PD, etc.) from a short cartesian acquisition. Previous research efforts have focused on the feasibility of the MR-STAT framework from a technical point of view. In this work, we present the implementation of a five-minute long high-resolution whole-brain MR-STAT protocol in a clinical trial and show the first results obtained from nine subjects. Synthetically generated contrast images as well as quantitative parametric maps show the robustness and the practical feasibility of the 5 minute long comprehensive MR-STAT protocol.
Introduction
Magnetic Resonance Spin TomogrAphy in Time-domain (MR-STAT)[1,2] is able to reconstruct multi-parametric quantitative maps (T1, T2, PD, etc.) from a short acquisition. The parameter maps are reconstructed directly from time-domain data by solving a large scale non-linear inversion problem. Unlike MR fingerprinting[3], under-sampled k-space data do not introduce artificial noise in the data (i.e. artifacts) and conventional gradient encoding schemes such as cartesian can be employed. In addition, there is no need in MR-STAT for a dictionary of signal fingerprints, a notorious drawback of exhaustive search based methods. To test the robustness and clinical feasibility of MR-STAT, we implemented a 5 minute long whole brain MR-STAT scan on a clinical 3.0 Tesla scanner (Ingenia, Philips) and we tested it on nine healthy subjects. We show that from this single cartesian acquisition it is possible to obtain reliable quantitative maps as well as synthetically generated contrast images.Methods
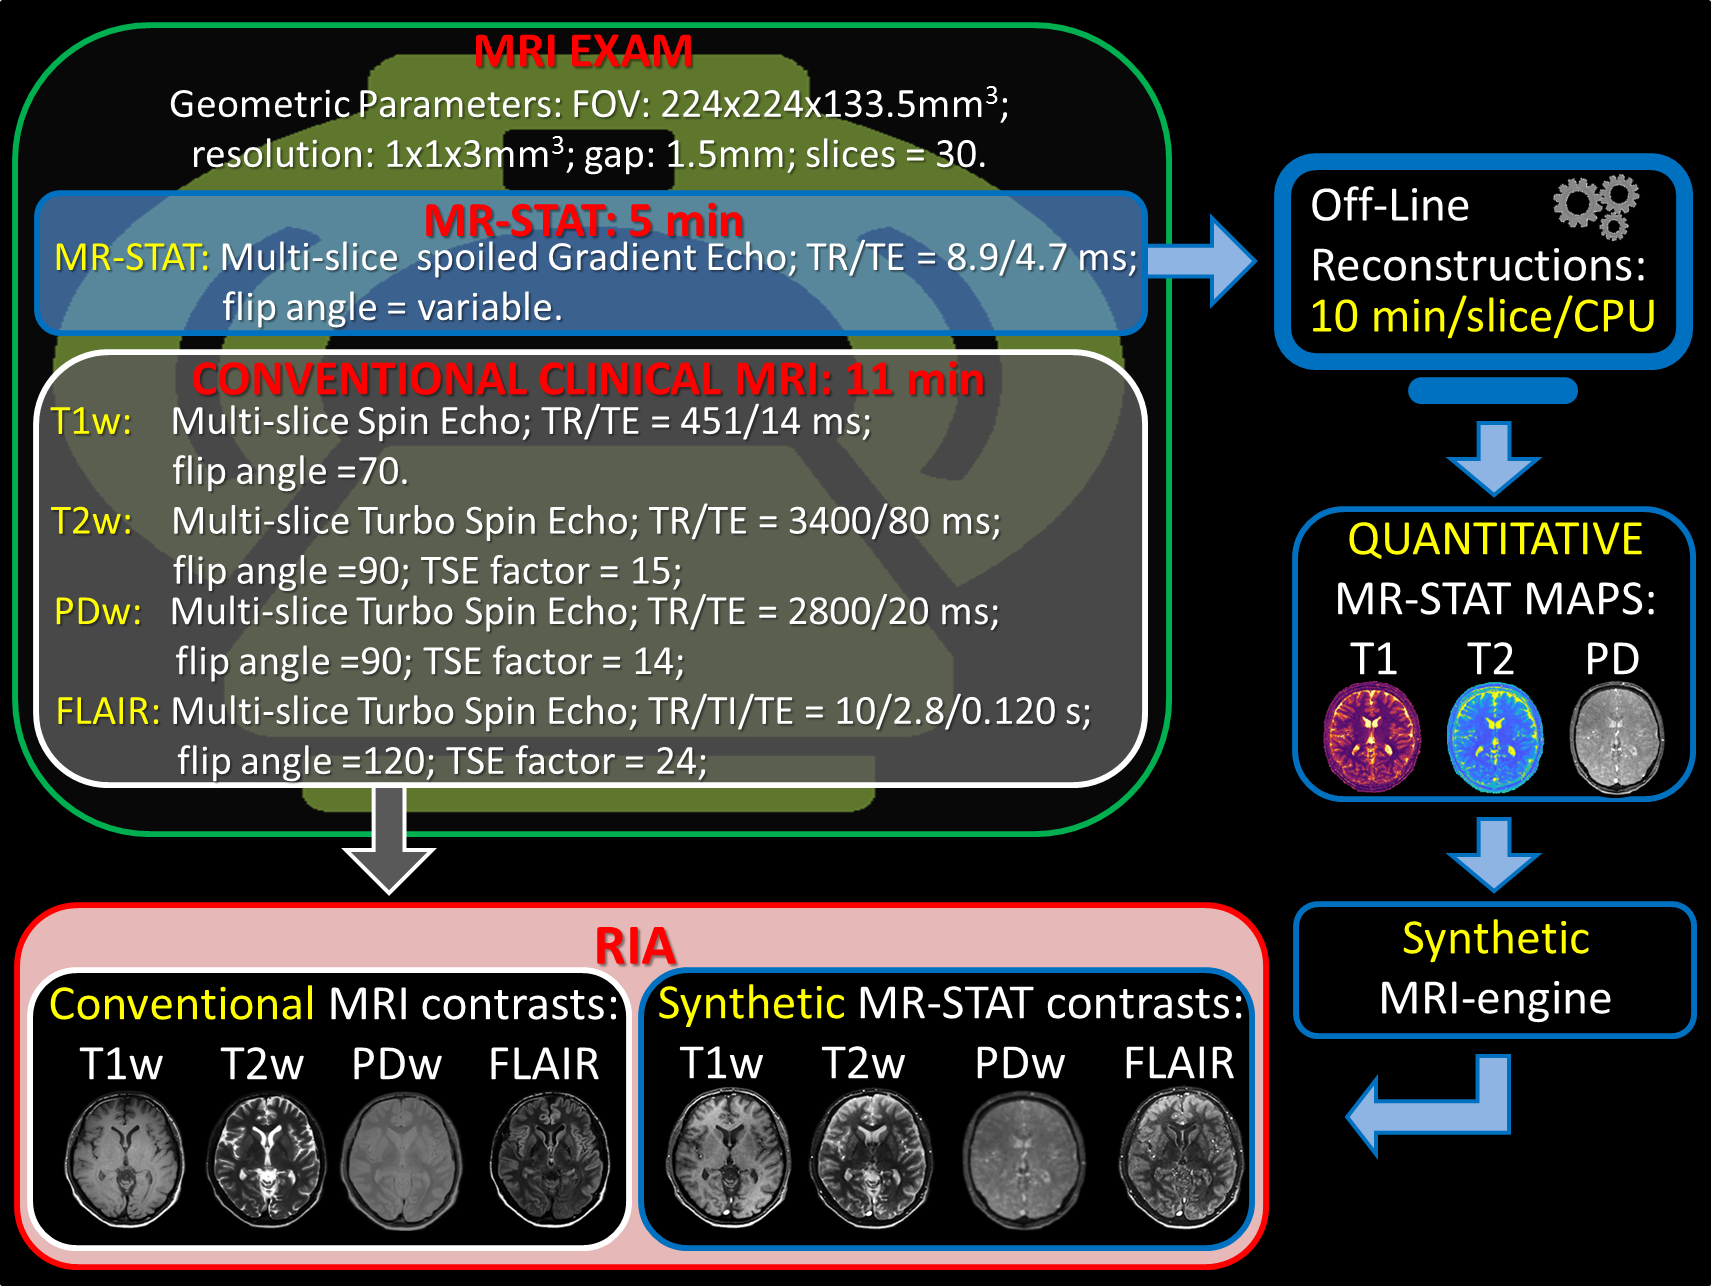
Nine healthy subjects underwent a whole brain MRI exam on a 3T MR system (Ingenia, Best, NL). The MRI exam consisted of two parts:1) a 5-minute long MR-STAT protocol;
2) a series of conventional contrast-weighted neuro MRI sequences (specific sequence parameters are reported in Figure 1).
The adopted MR-STAT sequence was a spoiled Gradient Echo sequence with slowly varying flip angles between 0 and 90 degrees preceded by a non-selective inversion pulse[2]. Thirty axial slices with 1x1 mm2 in-plane resolution and 3 mm slice thickness were acquired. For each slice, five k-spaces were acquired in a cartesian, fully sampled fashion. The acquisition time was 10 seconds/slice for a total 5 minute scan time.
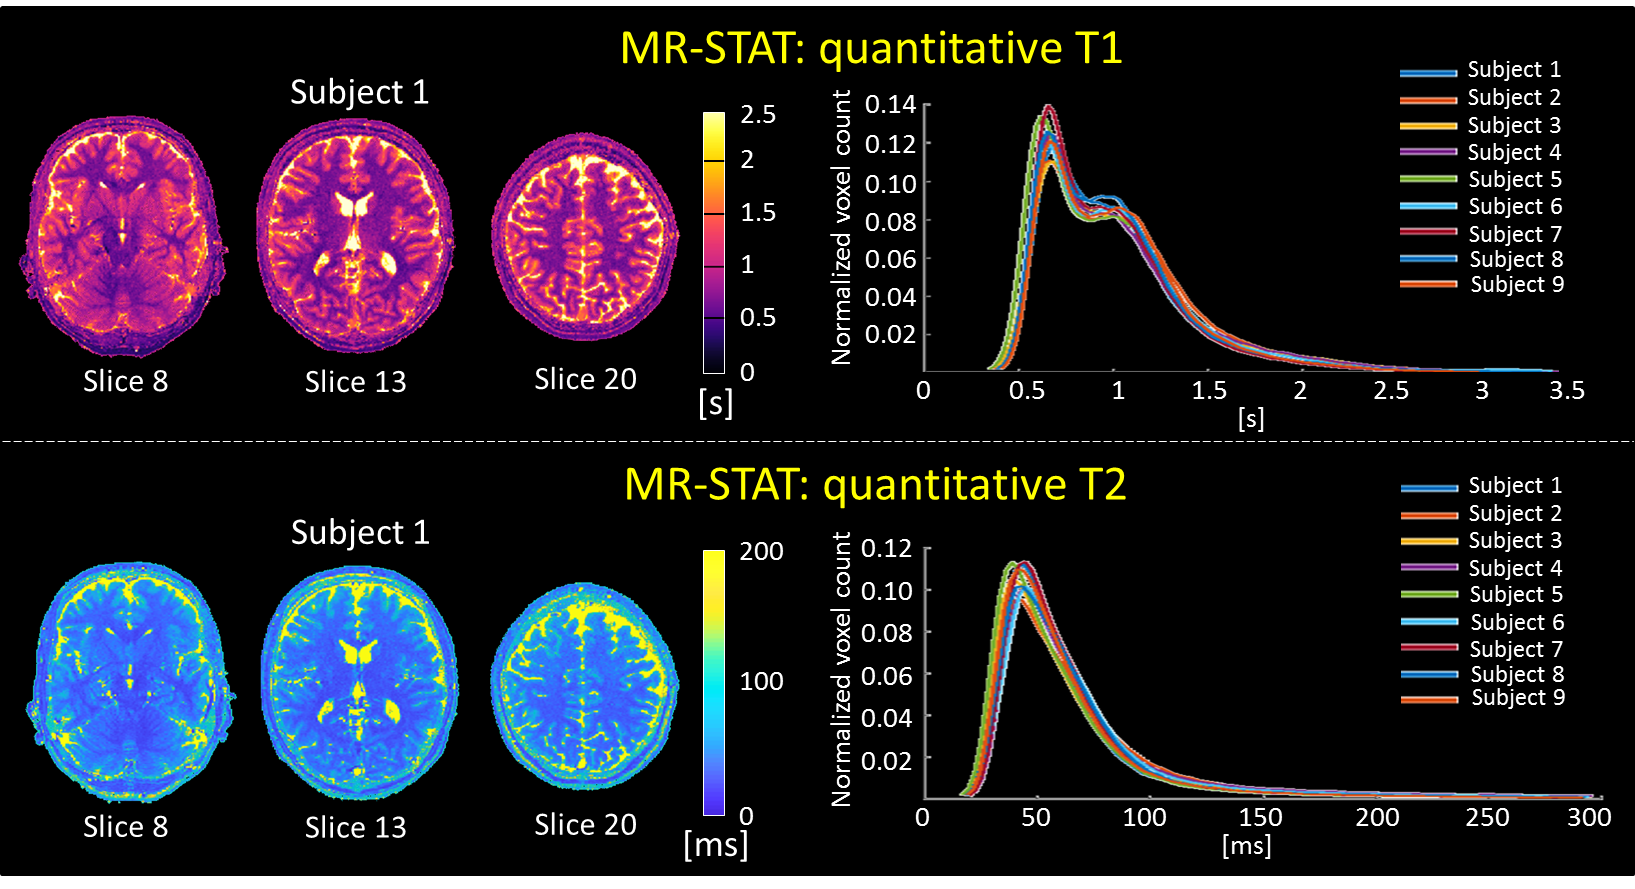
An automated data workflow was created to extract, process, and store the reconstructed MRI images (Figure 1). The time-domain data was automatically sent to an external server, where quantitative T1, T2 and PD maps were reconstructed off-line for each slice (computation time: 10 minutes per slice on a 8 cores CPU). To test reproducibility and robustness of the T1 and T2 maps, the distribution functions of each quantitative parameter over the whole brain were estimated and compared across the nine subjects.
The obtained quantitative maps were then used to create synthetic MR contrast images (T1-weighted, T2-weighted, FLAIR and Proton Density-Weighted) according to standard analytical signal models for a spin echo[4] with TR, TI, TE and flip angle parameters similar to conventional scans parameters used in the clinic routine (Figure 1). The final contrast images were automatically stored in the Research Dicom Images Archive System (RIA) of the UMC Utrecht.
Image quality and image contrast reproducibility was then qualitatively inspected among subjects. For validation purposes, conventional contrast MRI scans were also automatically stored in RIA.
Results and Discussion
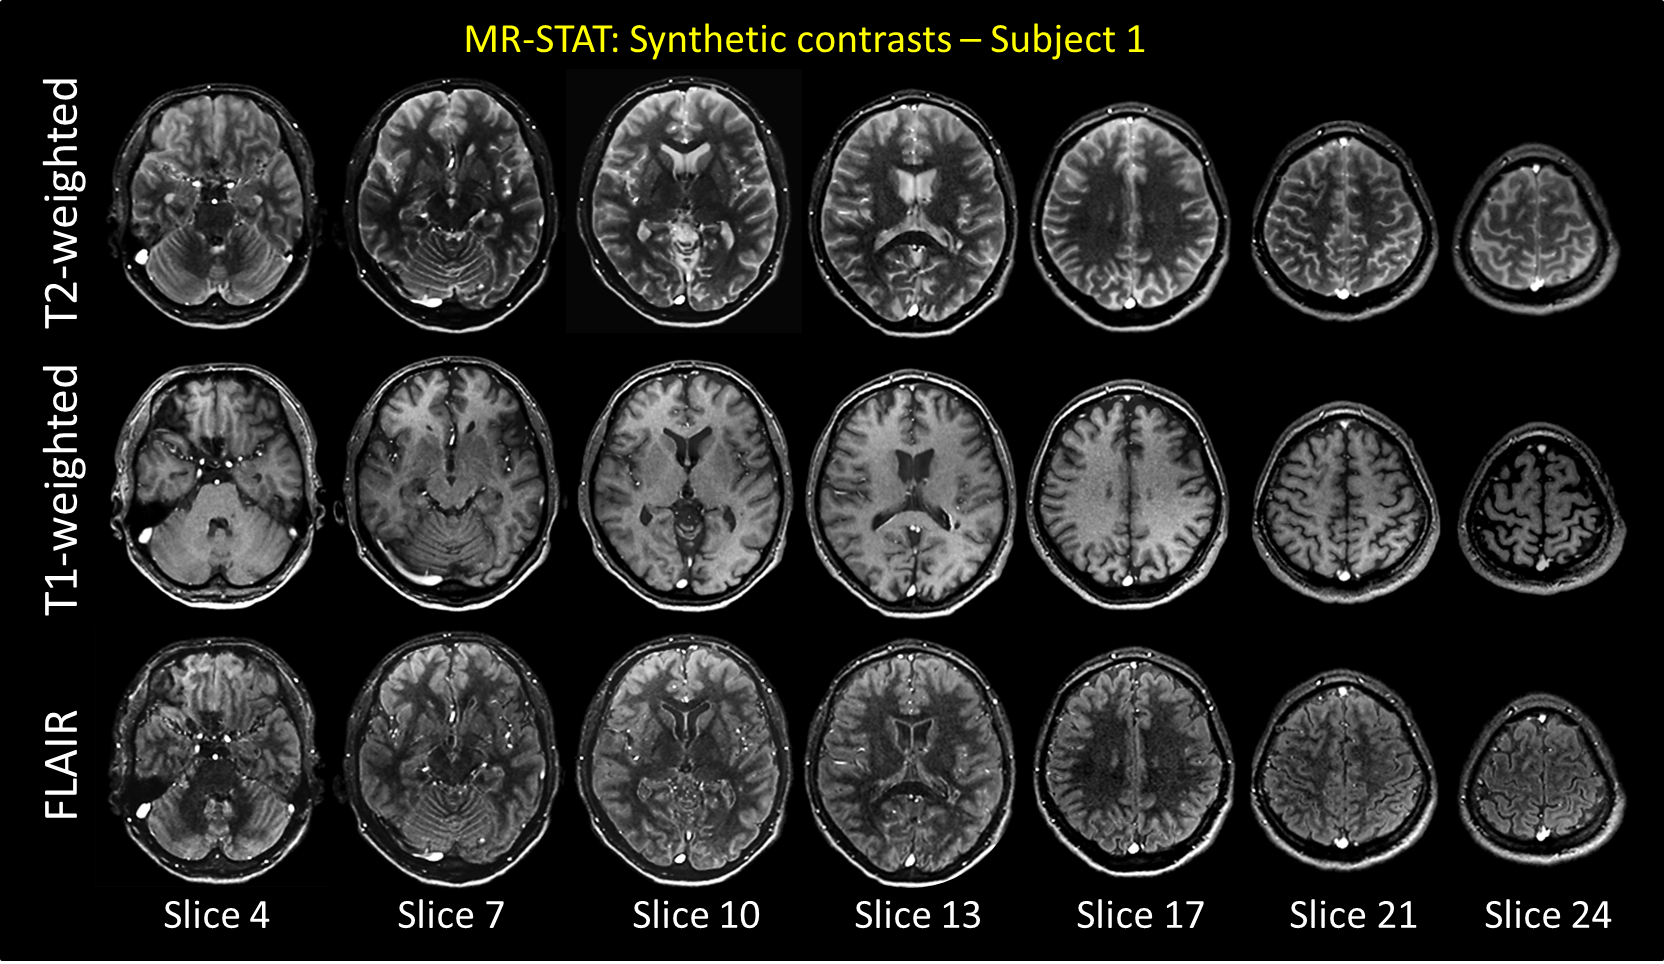
Quantitative T1 and T2 maps are shown for one subject in Figure 2-left. Whole brain distribution functions across subjects consistently overlap (Figure 2-right), displaying, in the T1 values, two distinct peaks for white matter and gray matter, respectively. This proves the good quantification reproducibility of MR-STAT.In Figure 3, synthetically generated T2-weighted, T1-weighted and FLAIR images are shown for different slices of one subject. These images show good and realistic contrast between tissue types. However, some slight signal inhomogeneity can be observed in the frontal lobe due to inhomogeneous receive fields of the multi-coil array which affects the proton density.
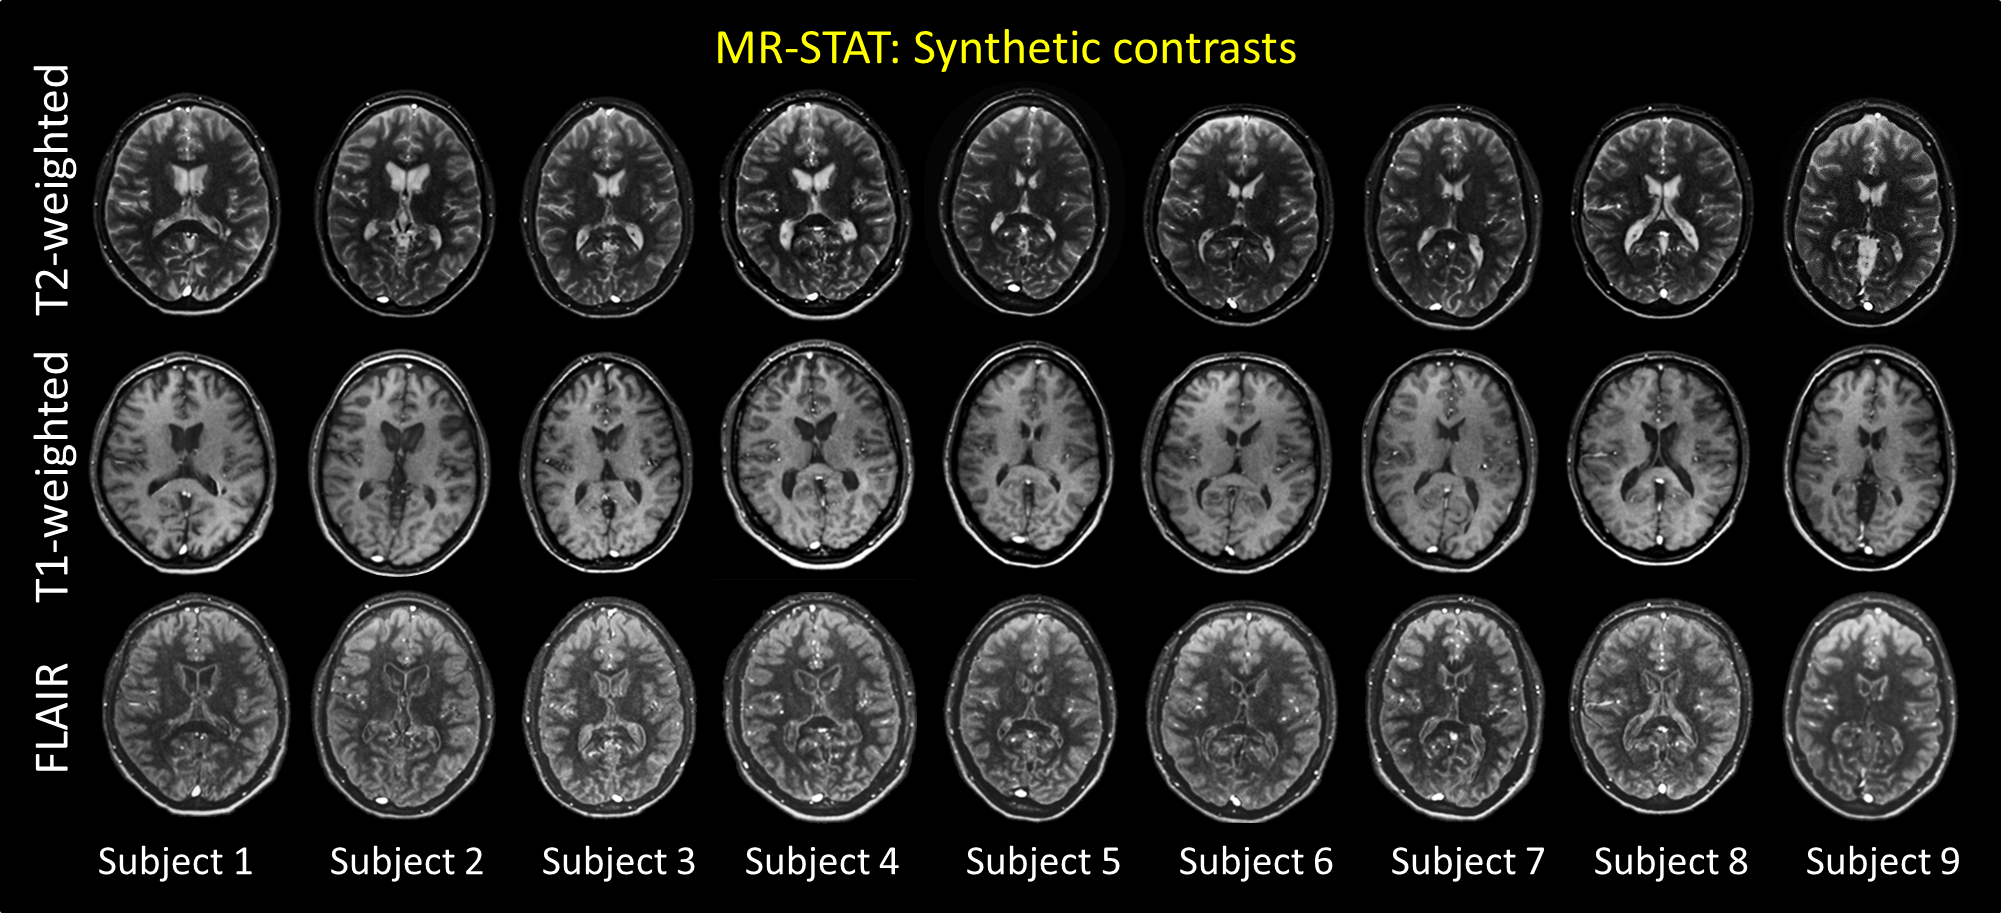
In Figure 4, one central slice of the synthetic T2-weighted, T1-weighted and FLAIR is shown for all subjects. Reproducible image quality can be observed.
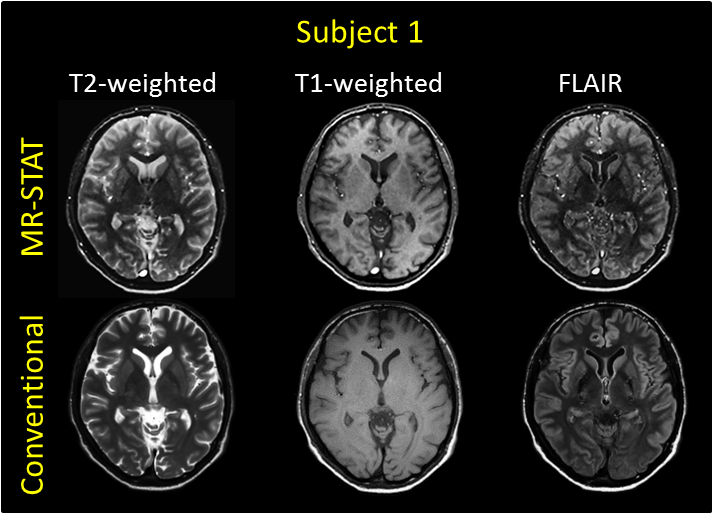
In Figure 5, one slice of the synthetic T2-weighted, T1-weighted and FLAIR is compared to the conventionally acquired images. Similar contrasts are observed between different tissues. Conventionally acquired images present slightly higher SNR. Nonetheless, the synthetic MR-STAT images present excellent contrast between tissues and well resolve the sub-cortical structures. Furthermore, the MR-STAT T1-weighted images show better gray/white matter contrast. Note the difference in the blood vessels, which appear bright in synthetic T2-weighted and FLAIR images (arising from in-flow effects) with respect to conventional T2-weighted images where they appear dark (also due to additional saturation slabs used to suppress blood signal).
In the coming months, 40 patients from four different pathological groups (tumor, stroke, epilepsy and multiple sclerosis) will be included in the study and similar comparisons will be performed to extend the results to abnormal tissues and lesions. We aim at presenting these results at the upcoming ISMRM Annual Meeting.
Conclusions
Synthetically generated contrast images as well as quantitative parametric maps prove the robustness and the practical feasibility of the 5-minute long comprehensive MR-STAT protocol based on a cartesian readout. An automatic pipeline was created to process the MR-STAT sequence. Whole brain quantitative maps were obtained in 10 minutes with 30 CPUs, from which synthetic contrast-weighted images were automatically generated. Synthetic MRI images show comparable quality compared to conventional MRI images. These results demonstrate the feasibility of a single MR-STAT cartesian sequence to return clinical information usually obtained from a longer protocol with the added value of providing additional multi-parametric quantitative maps.Acknowledgements
Support was provided by the Netherlands Organization for Scientific Research (NWO), Demonstrator Grant 16937.References
1) Sbrizzi A., van der Heide O., Cloos M., et. al., Fast quantitative MRI as a nonlinear tomography problem, Magn Reson Imaging 2018; 46: 56–63. DOI: 10.1016/j.mri.2017.10.015
2) van der Heide O., Sbrizzi A., Luijten P.R., van den Berg C.A.T., High resolution in-vivo MR-STAT using a matrix-free and parallelized reconstruction algorithm, arXiv 2019:1904.13244v1
3) Ma D., Gulani V., Seiberlich N., et al., Magnetic resonance fingerprinting, Nature 2013; 495:187–192. DOI: 10.1038/nature11971
4) Hagiwara A., Warntjes M., Hori M., et al., SyMRI of the Brain: Rapid Quantification of Relaxation Rates and Proton Density, With Synthetic MRI, Automatic Brain Segmentation, and Myelin Measurement. Invest Radiol 2017;52: 647–657.
Figures