0557
Water content for brain mapping at 7T: sub-mm resolution, sub-one percent precision
Ana-Maria Oros-Peusquens1, Ricardo Loução1, Monica Ferreira1, and N. Jon Shah1,2,3
1Research Centre Juelich, Juelich, Germany, 2Section JARA‑Brain, Jülich ‑Aachen Research Alliance (JARA), Aachen, Germany, 3Department of Neurology, RWTH Aachen University, Aachen, Germany
1Research Centre Juelich, Juelich, Germany, 2Section JARA‑Brain, Jülich ‑Aachen Research Alliance (JARA), Aachen, Germany, 3Department of Neurology, RWTH Aachen University, Aachen, Germany
Synopsis
We present a method for high resolution, high precision measurements of water content in vivo, validated by comparison of the values obtained in the same brains at 3T and 7T. Applications relevant to brain structure and function are illustrated. The cortical distribution of water content simultaneously reflects its complement, the macromolecular content of tissue. Furthermore, a 3D “long TR” single-scan mapping method with 3deg excitation angle is proposed at 7T and delivers results consistent with the 2D method. Structural scans reflecting quantitative properties of tissue can thus be obtained in a short (7min or less) measurement time.
Introduction
Reports exploiting the tremendously versatile contrast of MRI in a multi-parametric fashion are emerging. Going one step forward, we report on a multiparametric quantitative method with potential applications to advanced in vivo neuroanatomy (e.g. tissue segmentation / brain parcellation), numerous clinical questions (from oedema in stroke to the research on acquaporins) and to provide insight into tissue microstructure (myelin content, iron content/distribution). It provides simultaneous mapping of water content, transversal relaxation rate R2*, magnetic susceptibility c and electric conductivity s of brain tissue. Whereas R2* contrast at high fields is well explored, quantitative water content is seldom investigated at any field. This is surprising, giving that it is a fundamental property of tissue as well as MRI contrast. Quantitative MRI suffers from a pronounced sensitivity to noise, in addition to usually requiring long acquisition times, dedicated sequences and often laborious post-processing, We have introduced a single-scan, fast mapping method which greatly alleviates these shortcomings even at lower fields [NIMA, Sci Rep, Frontiers] and applied it to brain tumours at 3T [NIMA, Methods]. However, the spatial resolution was at most 1x1x1.5mm (0.75mm slice gap), dictated by SNR and hardware constraints. At this SNR value, the voxel-based stability of the method is below 1% in water content. Quantitative imaging at 7T with a highly-sensitive 32-channel coil offers the unusual situation of having SNR to spare, which can be used to increase the resolution while maintaining the accuracy. We report a high-resolution implementation of the single-scan mapping method at 7T, validated by comparison to 3T quantitative results in healthy volunteers and brain tumour patients. At 7T we also introduce a 3D variant of the single-scan water content mapping with no T1 saturation effects in tissue. In order to illustrate the potential of water content to investigating brain structure at high resolution, we acquire GRE data at different slice orientations, reconstruct a water map with a nominal (0.61mm)3 resolution.Materials and methods
Three healthy volunteers and three brain tumour patients were scanned on a 3T (Siemens Trio) and a 7T (Siemens Terra) scanner with protocols including a 2D multiple-echo gradient-echo sequence (mGRE) at both fields (Table 1). Four of the 6 comparison data sets (3 patients, one volunteer) were acquired on the same day at both field strengths. Two patients and 2 volunteers were additionally scanned with the 3D method at 7T (Table 1). Processing was performed as described in refs. 1-3, with no additional calibration scans required. We use 3T data from five more volunteers (same mGRE protocol), for which an MP-RAGE scan was acquired and used for FreeSurfer-based brain parcellation. Finally, a very high resolution water map acquired at 7T from one volunteer was obtained by combining 6 separate scans. Slice selection (1.2mm, 100% slice gap) was performed in either HF, AP or RL directions. The in-plane resolution was (0.61mm)2. Whole brain coverage was obtained at each orientation by combining two interleaved sets of slices. Using iPAT=2, the acquisition time per slice set was 10min:10s. Coregistration of all data sets and maps was performed off-line using SPM12.Results and Discussion
Fig. 1 shows the ROI-based cortical distribution of water content obtained for 5 volunteers at 3T. The SD over 5 volunteers remains below 2% for all cortical regions, reflecting the tight regulation of water content in vivo. Fig. 2 similarly reflects the distribution of R2* values (similar to [5]). In Fig. 3 we compare water content and T2* between field strengths for a representative volunteer. Fig. 4 shows water content of the brain at an unprecedented (0.61mm)3 resolution. The blown-up region highlights the exquisite contrast in the brain stem, reflecting among others the presence of myelinated fibres with low water content. The water content contrast in deep-brain structures such as substantia nigra and subthalamic nucleus is complementary to that offered by R2* (not shown), opening new possibilities for parcellation and investigation of effects of disease in these small but highly relevant regions. The rich contrast in the thalamus can be exploited for segmentation of thalamic nuclei. Specific regions of water content and R2* distributions can be identified in the cortex (Figs. 1 and 2), suggesting yet unexploited potential for brain parcellation and investigating local changes caused by neurological diseases. High SNR is seen in the water content maps obtained at 7T with the 2D method (Fig. 3), despite an increase in the parallel imaging acceleration factor from 2 to 3 and a decrease in the flip angle to avoid steady-state saturation for increased T1 at 7T. At the current small sample size, the mean water content per tissue class at 3T and 7T for the same volunteers/patients was reproducible within 1 percent unit. The same was found by comparing the 2D and 3D methods at 7T for the same volunteers. Further investigation is necessary to assess the sources of this (small) variation. In conclusion, the increased SNR and parallel imaging acceleration at 7T allow for water content mapping with higher SNR and higher resolution (half the voxel size) and very similar measurement time at 7T, compared to 3T. Due to same features, a single-scan 3D water content mapping with 3deg flip angle becomes feasible at 7T.Acknowledgements
No acknowledgement found.References
[1] A.M. Oros-Peusquens et al. NIMA 2013 ; [2] Y. Liao, A.M. Oros-Peusquens et al. Sci Reps 2019 ; [3] A.M. Oros-Peusquens et al., Methods 2017 ; [4] A.M. Oros-Peusquens e al., Frontiers Neurology 2019 ; [5] B. Hunt et al. PNAS 113, 2016 [6] J. Wen et al, PNAS 115, 2018. [7] B. Scherrer et al., Med Image Anal 16, 2012.Figures
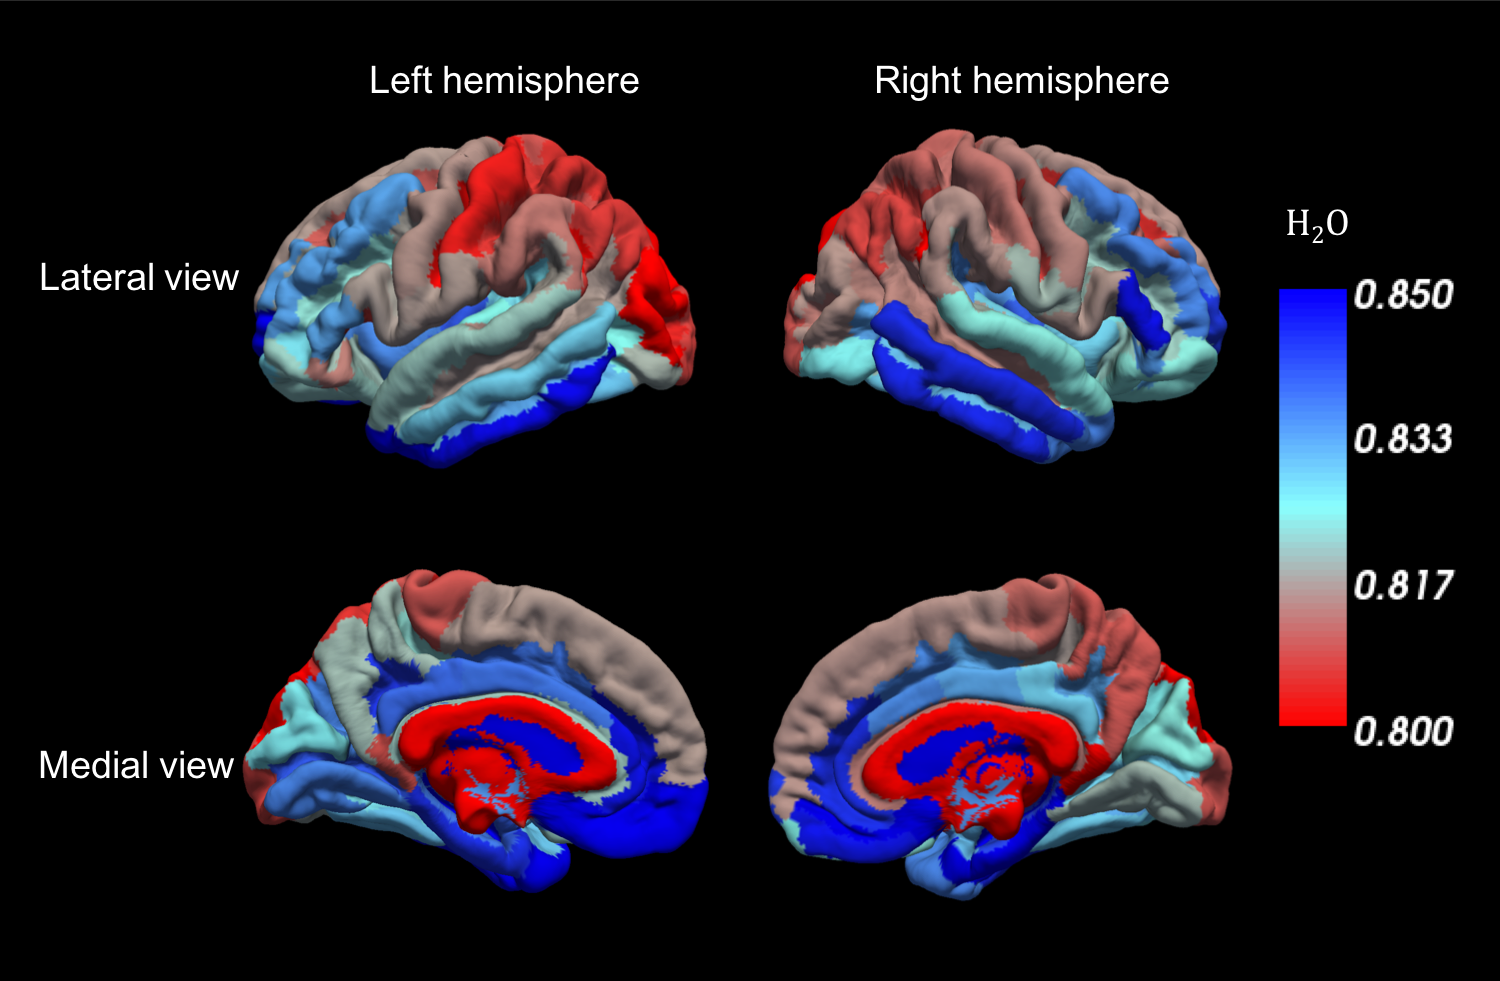
Water content (water volume fraction) variations along the cortical surface. Contrast in
water content between neighbouring cortical regions is easily recognised (e.g.
in the frontal and occipital lobes). Importantly, the whole range of variation
is only 5% units water content, requiring a very precise mapping method. A significant relationship was found in [5] using MT data, reflected
by 1-H2O in our data, between cortical myeloarchitecture and functional connectivity in the human brain.
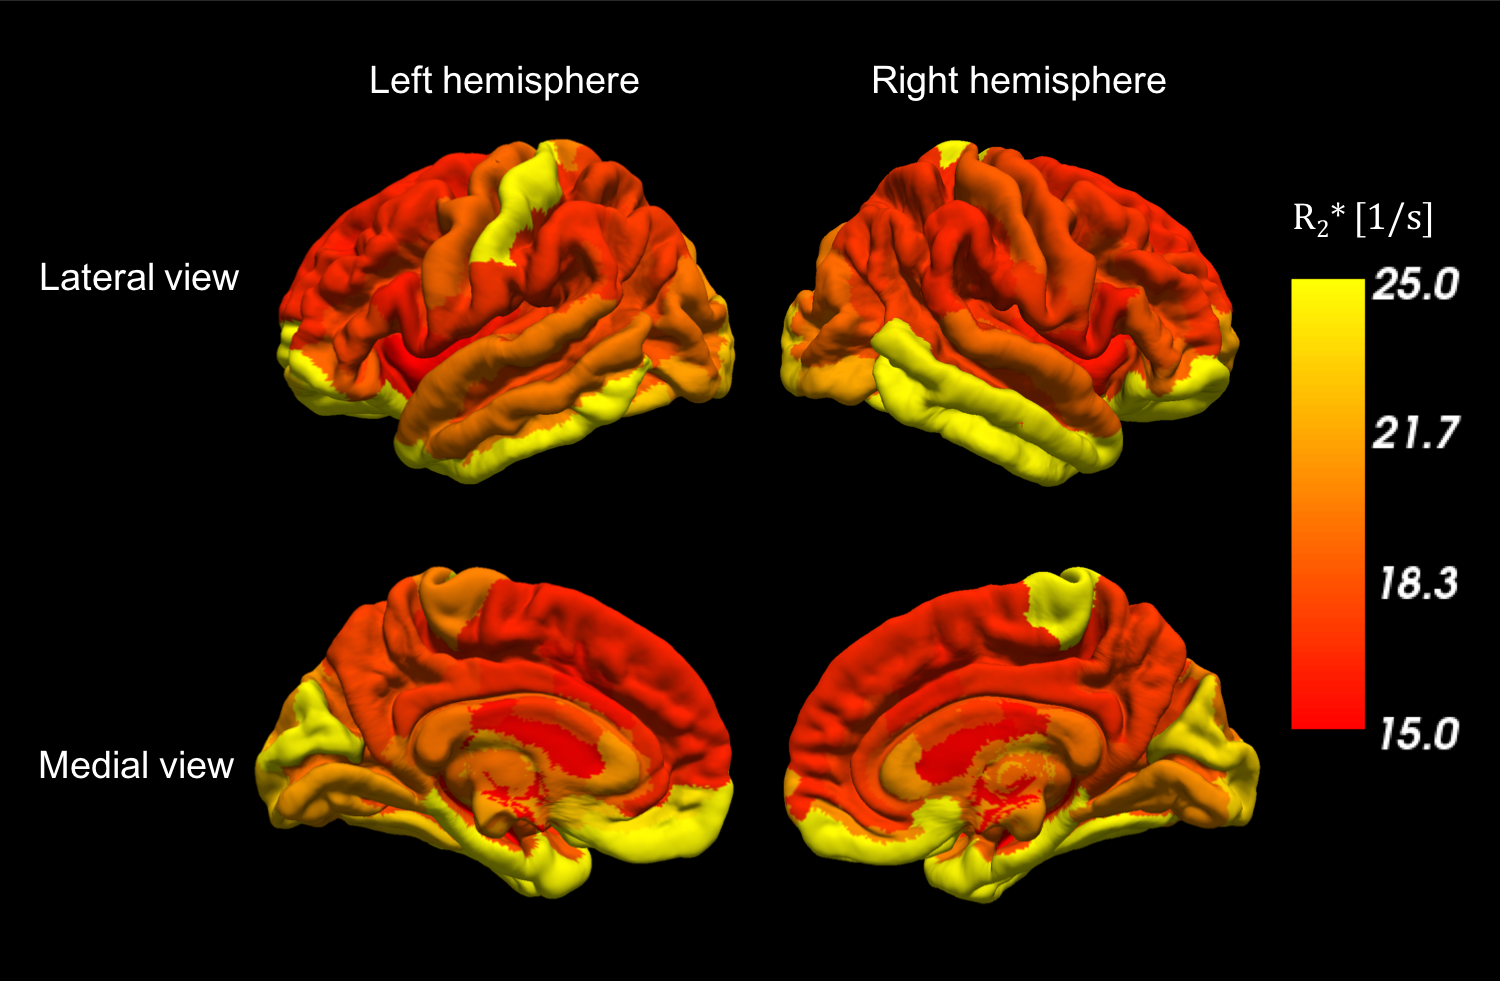
R2*
variations along the cortical surface. The colours represent the average relaxation
rate in each cortical ROI. This is largely equivalent to the distribution
reported by Wen et al [6], showing that areas of the brain cortex characterized
by higher R2* have high neuronal density and stronger functional connections to
other brain areas.
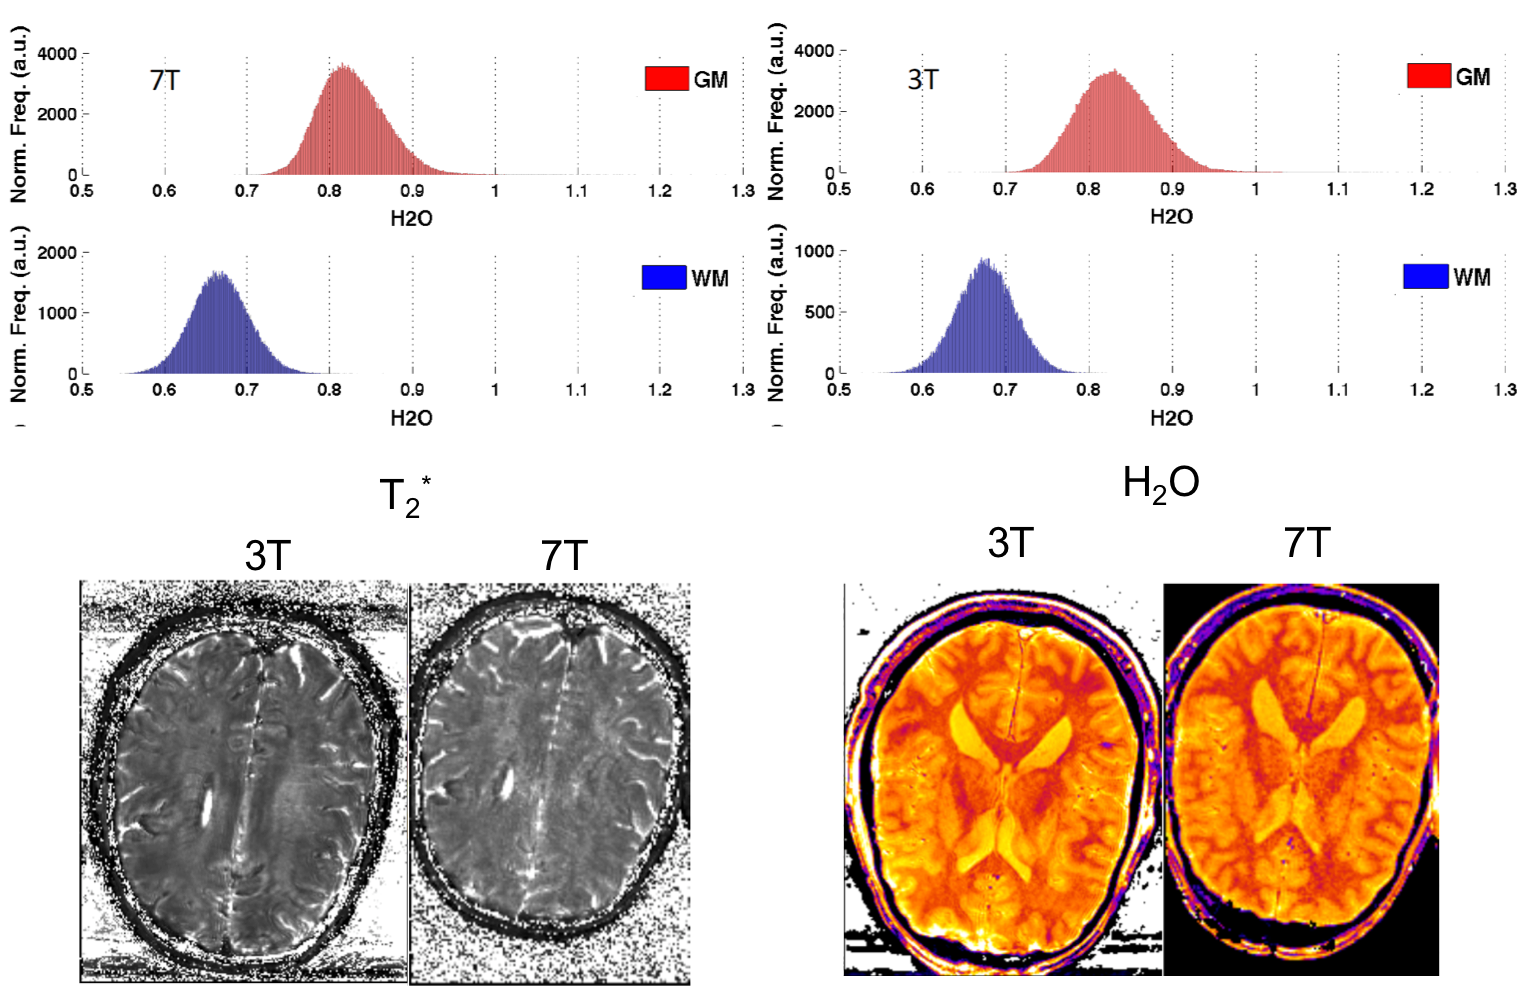
Comparison of water
content maps and tissue-class based histograms between 3T and 7T, illustrated
for one volunteer. Good quantitative agreement is found, with 7T data showing a
slightly narrower cortical distribution, likely due to higher SNR at 7T especially
on brain surface, as well as reduction in partial volume effects by higher
resolution. Water content is
not expected to change with field strength, such that the comparison on same volunteers
at two fields serves as validation of the mapping method at 7T. In contrast, R2*
relaxation rates increase by roughly a factor of two.
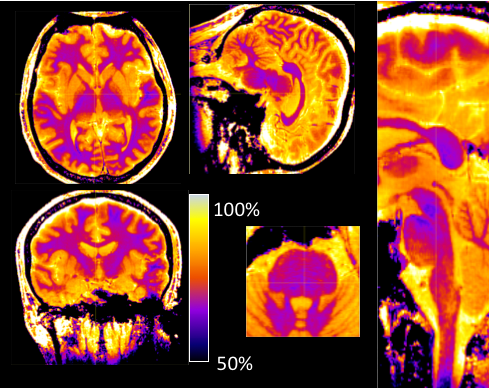
Sub-mm resolution water
content map reconstructed from six individual acquisitions, each with
0.61x0.61x1.2mm resolution. The nominal resolution of the reconstructed volume
is (0.61mm)3, but some slight blurring is observed compared to the
original images with 0.61mm in–plane resolution. The effective resolution could
be further improved by applying an iterative superresolution reconstruction (e.g.
[7]) to the acquired data sets. Rich contrast and anatomical resolution is
observed everywhere in the brain, exemplified in blown-up areas from the brain
stem.
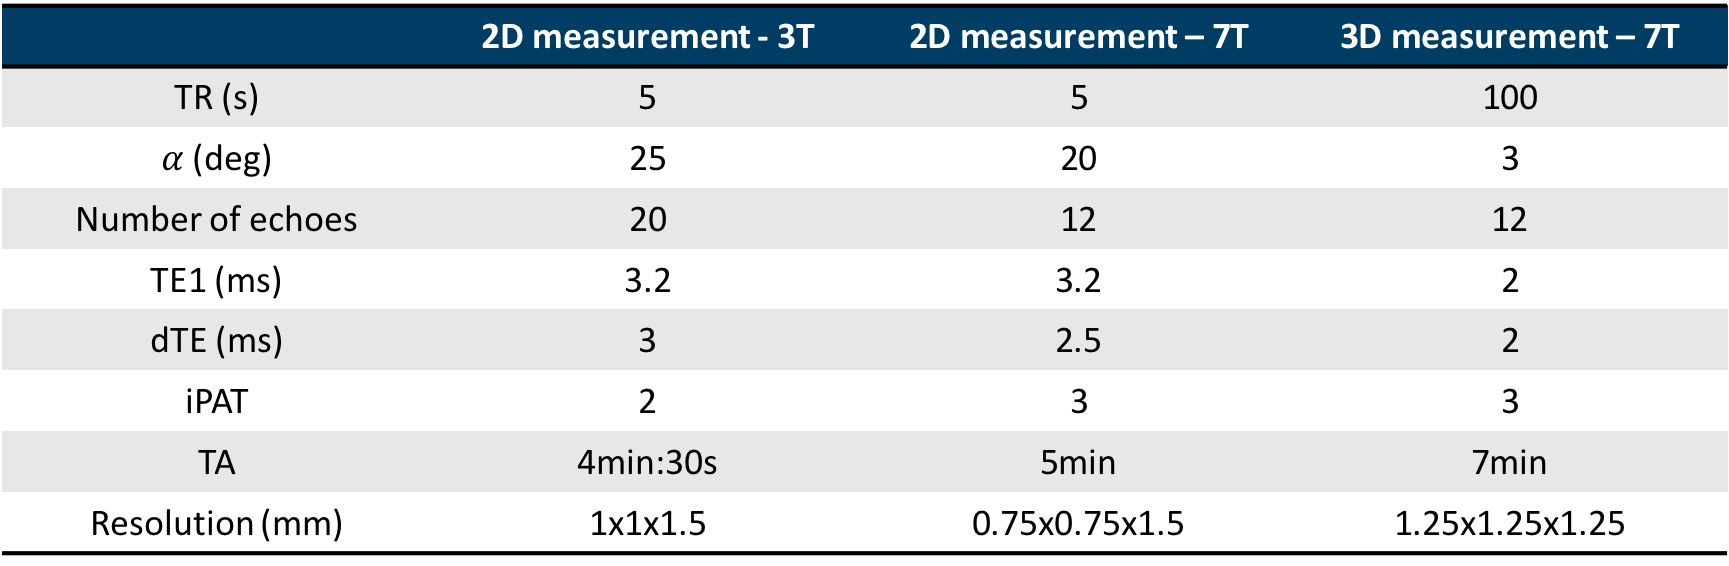
Table 1 Parameters of the mGRE acquisitions used for single-scan
multi-parametric mapping. The water content values obtained from the 2D
acquisitions at 3T and 7T were highly similar (Fig. 3), serving as validation
of water content mapping at 7T. Furthermore, a “long-TR” 3D method has been
explored at 7T, with a 3deg excitation angle to avoid T1 saturation effects in
tissue. The parameters are listed above, and the results are highly consistent
with those from the 2D method.